Indicators and strategies

MA Cross + Trend Stats (Probabilistic)Short description (one-liner)
A MA-regime framework with historical regime stats + forward performance + optional trend/noise filters for trending context.
________________________________________
Full description (TradingView-ready)
Overview
This indicator turns a classic Moving Average Cross into a regime-based trend dashboard. Instead of treating a cross as a standalone “buy/sell” event, it measures what historically happened after similar regime shifts on the current symbol and timeframe, and displays the results in a compact table.
It supports:
• EMA or SMA
• Custom fast/slow lengths (including .5 lengths via floor/ceil averaging)
• Optional trend quality filters for trending decisions:
o Slope filter (Slow MA slope)
o Market noise filter using Efficiency Ratio (ER) in real time
________________________________________
What the table shows (how to read it)
The table has two rows: Bull (Fast > Slow) and Bear (Slow > Fast). Metrics are computed on completed regimes (historical segments that already ended).
N
Number of completed regimes measured. More samples generally means more stable estimates.
μ Δ% / Med Δ%
Average and median regime return from regime start to regime end. Median helps reduce the impact of outliers.
⏱ Bars
Average regime duration (in bars). Useful to calibrate realistic holding expectations for trending.
⬆ MFE% / ⬇ MAE%
• MFE (Maximum Favorable Excursion): max move in favor during the regime
• MAE (Maximum Adverse Excursion): max move against during the regime
These are context metrics for typical run-up and typical heat.
ER μ | Hit
Trend-quality proxy:
• ER μ: average Efficiency Ratio during regimes (0–1, higher = more directional / less noisy)
• Hit: % of regimes with ER above the historical threshold you set
Forward performance (+H μ|Hit)
For two user-defined horizons (e.g., +10 / +20 bars):
• μ: average forward return after the cross
• Hit: probability (%) that the forward return was positive
This is designed to provide probabilistic context, not certainty.
________________________________________
“Trending” decision filters (optional)
These filters apply to signals/alerts/markers, not to the raw regime statistics:
1. Slope filter (Slow MA):
Only allow Bull signals if the Slow MA slope is positive (and Bear signals if negative).
2. Market noise filter (ER realtime):
Only allow signals when current ER exceeds your chosen threshold (helps avoid choppy conditions).
________________________________________
Suggested usage (educational)
• Treat Bull/Bear as a regime label (state), not a prediction.
• Use Forward Hit% as an estimate of historical frequency, not a guarantee.
• If ER realtime is below threshold, consider it a noisier environment (higher whipsaw risk).
• Combine with your own risk rules and confirmation (structure, volatility, volume, HTF context, etc.).
________________________________________
Notes
• Results depend on symbol, timeframe, and loaded history.
• Statistics are historical summaries and can change as more data becomes available.
• This tool is intended for research and decision support, not as standalone trade advice.
________________________________________
Disclaimer
This script is for educational and informational purposes only and does not constitute financial, investment, or trading advice. Trading involves risk. You are responsible for your own decisions and risk management.

Williams %RDescription
This is a modified version of the classic Williams %R oscillator, adapted for markets with defined trading sessions (e.g., FTSEMIB, DAX, US stocks, etc.). It adjusts the lookback period based on the actual trading session length, making it more accurate on intraday timeframes.
Key Features
Session Adjustment:
Automatically scales the period to trading days (default: 8.5 hours for FTSEMIB, DAX, CAC; customizable for any market).
Formula (classic Williams %R):
%R = 100 × (Close - Highest High) / (Highest High - Lowest Low)
over a user-defined period (default 14 days).
Standard Levels:
-20 (overbought)
-50 (middle line)
-80 (oversold)
Visual Enhancements:
- Customizable colors for the line, levels, and background fill
- Shaded overbought/oversold zone
How to Use:
Overbought (above -20):
Potential sell signal or reversal (especially after a prolonged uptrend).
Oversold (below -80):
Potential buy signal or reversal (especially after a downtrend).
Divergences:
Look for bullish/bearish divergences between price and %R for early reversal warnings.
Best Markets:
Indices (FTSEMIB, DAX, SPX), stocks, futures. For 24/7 markets (crypto), set session duration to 24 hours.
Timeframes:
Works on intraday (15m, 1h, etc.) and daily charts.
Customization Tips:
- Adjust the period (shorter = more sensitive, longer = smoother).
- Change session duration for different markets.
- Customize colors to match your chart theme.
Note: Williams %R is a momentum oscillator and should be used in combination with other tools (trendlines, support/resistance, volume). Always practice proper risk management.

Volume ROC (smoothed)Description
The Volume ROC (Rate of Change) indicator is designed to measure the momentum of trading volume over a user-defined period, adjusted for the trading session length of the symbol (e.g., 8.5 hours for the FTSEMIB index). This makes it particularly useful for intraday charts where standard daily calculations might not align with actual trading days.
By focusing on volume changes rather than price, it helps identify potential shifts in market participation, such as accumulation, distribution, or unusual activity that could precede price movements.
How It Works:
Session Adjustment:
The indicator calculates the number of candles per trading day based on the input session duration (in hours) and the chart's timeframe. This ensures that the ROC and other calculations are based on "trading days" rather than calendar days, making it adaptable to markets with non-standard hours like European indices (e.g., FTSEMIB).
Daily Data Fetch:
It retrieves daily high, low, close, and volume data using "request.security" to ensure consistency across timeframes.
ROC Calculation:
The Rate of Change (ROC) is computed on volume using "ta.change" over the specified length (in days), multiplied by the candles-per-day factor for timeframe independence. By chosing the subtraction method instead of the division method we avoid distortions of the ROC below the zero line (method ok for timespans inferior to two years).
Smoothing with SMA:
A Simple Moving Average (SMA) is applied to the ROC to reduce noise and highlight trends in volume momentum.
Standard Deviation Bands:
The standard deviation of the smoothed ROC is calculated over a lookback period. Bands are plotted at +2σ (overbought) and -2σ (oversold) to provide context for extreme volume changes, similar to Bollinger Bands but applied to volume ROC.
Key Plots:
SMA Line (Orange): The smoothed ROC value. Positive values indicate increasing volume momentum; negative values suggest decreasing momentum.
Zero Line (Black Dotted): A reference line at 0, separating positive and negative ROC territories.
+2σ Band (Red Dotted): Upper overbought threshold. Crossings above this may signal excessive buying volume.
-2σ Band (Green Dotted): Lower oversold threshold. Dips below this could indicate capitulation or low interest.
Usage and Interpretation:
Trend Confirmation:
Use the SMA crossing above/below zero to confirm price trends with volume backing. For example, a rising price with positive Volume ROC suggests strong conviction.
Divergences:
Look for divergences between price and Volume ROC (e.g., price making new highs but ROC weakening), which can signal reversals.
Overbought/Oversold Signals:
The ±2σ bands act as dynamic levels. Volume ROC spiking above +2σ might precede pullbacks, while below -2σ could indicate buying opportunities.
Best Applied To:
European indices (like FTSEMIB or DAX), stocks, or futures with defined session hours. Test on intraday (e.g., 2h) and combine with price-based indicators like RSI or MACD for confluence.
Customization:
Adjust the ROC/SMA lengths for sensitivity (shorter for scalping, longer for swings). The STDEV lookback affects band width—longer periods create smoother bands.
Limitations:
Volume data can be noisy in low-liquidity symbols. This indicator assumes consistent session lengths; irregular holidays may affect accuracy. Always backtest and use with risk management.
This indicator is original and built for educational/trading purposes.
sullaojo 3mHere is the English translation for the alert setup instructions:
**How to Set Up Alerts (After Adding the Code)**
1. Click the **Add to chart** button to apply the indicator to your graph.
2. Click the **Alarm Clock icon (Alerts)** on the top right toolbar of TradingView, or press `Alt + A`.
3. In the **Condition** field:
* Select the indicator named **"MA Crossover Buy Alert..."**
* Select **"แจ้งเตือนซื้อ (Buy Alert)"** to receive only buy signals.
4. In the **Trigger** (or Options) section: Select **Once per bar close**.
*(This is recommended per the textbook to confirm that the closing price actually crossed the line, avoiding false signals during intraday volatility.)*
5. Check **Notify on App** (for mobile) or **Show pop-up** as desired, then click **Create**.
Now, when the moving averages cross according to the textbook's conditions, the system will send you an alert immediately!

OKXJsonLibrary "OKXJson"
f_buildId(prefix, instrument)
Parameters:
prefix (string)
instrument (string)
f_utcTimestamp()
f_investmentType(internalAction, entryType, closeType)
Parameters:
internalAction (string)
entryType (string)
closeType (string)
f_build(id, okxAction, marketPosition, prevMarketPosition, instrument, signalToken, timestampUtc, investmentType, amount, maxLagSeconds)
Parameters:
id (string)
okxAction (string)
marketPosition (string)
prevMarketPosition (string)
instrument (string)
signalToken (string)
timestampUtc (string)
investmentType (string)
amount (string)
maxLagSeconds (string)

MGC1! Sniper Levels [NY Midnight + PDH/PDL + VWAP]This script, titled "MGC1! Sniper Levels ," is a specialized institutional-grade technical indicator designed for intraday trading on Micro Gold (MGC1!) futures. It merges Time & Price theory with Statistical Volatility to create a comprehensive roadmap for high-probability "Sniper" entries.
Core Technical Components
NY Midnight Pivot: Automatically identifies and plots the New York Midnight opening price. This level serves as the "True Open" for the daily session, helping traders determine whether the market is in a Premium or Discount zone relative to the daily start.
Previous Day Structure (PDH/PDL): Displays the Previous Day’s High and Low using a background security call. These levels are primary targets for Liquidity Sweeps (trapping retail traders) before a reversal occurs.
Advanced Session VWAP: Calculates the Volume Weighted Average Price starting from the session open. Unlike a standard moving average, VWAP represents the true fair value based on actual capital commitment.
Standard Deviation Extensions (SD 1, 2, 3): Plots three layers of volatility bands based on the variance of price and volume.
SD1 & SD2: Act as dynamic support and resistance within normal market conditions.
SD3 (Extreme Zones): Highlights the "Extreme Long" and "Extreme Short" zones, representing areas where 99.7% of price action is statistically contained, often leading to sharp mean-reversion moves.
Key Features & Interface
Customizable Labels: Includes a specific toggle to show or hide Standard Deviation labels. This allows for a cleaner chart when focusing on ICT/SMC price action while maintaining the colored "Zones" for visual context.
Real-Time Vignettes: High-contrast labels appear at the right edge of the price action, providing the exact numerical value of every key level (VWAP, PDH, NY Midnight) for immediate order execution.
Previous VWAP Close: Plots the final VWAP value from the prior session. This level often acts as a magnetic "fair value" target during the current session's open.
Strategic Trading Application
The script is built for the Gold Sniper MGC1! persona to identify "Smart Money" reversals. A typical setup involves waiting for price to reach an SD3 Extreme Zone that coincides with the PDH or PDL. Once the price "sweeps" these levels and shows a Market Structure Shift (MSS) back toward the VWAP, a high-probability trade is triggered.

RS of long term KSTDescription
Relative Strength of KST (Know Sure Thing) momentum between a stock and a reference index (e.g., Intesa San Paolo vs. FTSEMIB).
This indicator computes the KST oscillator separately for the chart symbol and the comparative symbol, then plots the difference (stock KST minus index KST). A positive or rising value indicates the stock has stronger momentum than the benchmark.
Best used on weekly timeframes.
Features:
- Fully configurable KST parameters (ROC lengths, SMA smoothing, weights).
- Signal line (SMA of the RS of KST) for potential crossover signals.
- Zero line for reference.
Rising values or crossings above the signal line may suggest improving relative momentum.
What the Script Does
This indicator calculates the Relative Strength of the KST momentum oscillator between the current chart symbol (e.g., a stock) and a comparative symbol (default: FTSEMIB).
KST Calculation (Know Sure Thing oscillator, originally developed by Martin Pring), computes four Rate-of-Change (ROC) values with different lengths (10, 13, 15, 20 by default). Each ROC is smoothed with its own SMA. The four smoothed ROCs are weighted (weights 1, 2, 3, 4 by default) and summed to create the final KST value.
This is done separately for: The chart symbol → kst
The comparative symbol → kstSymbol
Relative Strength of KST res = kst - kstSymbol
This is a subtraction-based relative strength (difference) of the two KST values, not a ratio, as to avoid singularity (division by zero).
A rising line or value above zero means the stock’s momentum (KST) is stronger than the index’s momentum.
Plotting Plots the RS of KST as a blue line.
Overlays a gray SMA (default length 10) with cross style (acts as a signal line).
Horizontal line at zero for reference.
This is best used on weekly charts (as KST is typically a longer-term momentum indicator).

Zone Eleven HTF Gate SweepThis indicator is designed as a simple visual framework rather than a rigid signal system. It highlights time-based structure and key alignment zones to help identify when price behavior is more likely to be active or responsive. The logic is intentionally flexible, allowing the user to apply their own discretion instead of relying on strict conditions. Its primary value is visual clarity and context, not automatic entries or exits.

Vertical Timelines Pro |MC|Vertical Timelines Pro |MC|
Credits go to lucemanb for the great work 👍
This indicator has been further developed and enhanced with additional features.
Vertical Timelines Pro is a customizable time-based indicator designed to mark important intraday timestamps directly on the chart. It helps traders visualize recurring market moments such as True Day Open, session opens, macro events, or personal timing models with precise vertical reference lines.
The indicator allows you to define multiple custom times, each with its own color and on/off toggle. All timestamps are calculated using a selectable timezone, ensuring consistent and accurate alignment across different markets and chart settings.
Optional labels can be displayed at each timeline to clearly identify the corresponding time. To keep the chart clean and readable, the number of visible labels can be limited retroactively. Due to Pine Script limitations, this setting only affects labels—plotted lines are not impacted.
💎 Key Features 💎
Multiple configurable intraday time markers
Timezone-aware calculations
Individual color and visibility control per line
Optional time labels with customizable size and colors
Historical label limiting to reduce chart clutter
Lightweight and suitable for all intraday timeframes
This indicator is ideal for traders who rely on time-based market behavior, session structure, or repeatable intraday cycles.
Happy Trading!

ARM-EMA COLOR BUY SELLPrice action trading is about reading what the market is doing, so you can deploy the right trading strategy to reap the maximum benefits. In simple words, price action is a trading technique in which a trader reads the market and makes subjective trading decisions based on the price movements, rather than relying on technical indicators or other factors.
At its most simplistic, it attempts to describe the human thought processes invoked by experienced, non-disciplinary traders as they observe and trade their markets. Price action is simply how prices change - the action of price. It is most noticeable in markets with high liquidity and price volatility, but anything that is traded freely (in price) in a market will per se demonstrate price action.

ARM-EMA TREND BARSPrice action trading is about reading what the market is doing, so you can deploy the right trading strategy to reap the maximum benefits. In simple words, price action is a trading technique in which a trader reads the market and makes subjective trading decisions based on the price movements, rather than relying on technical indicators or other factors.
At its most simplistic, it attempts to describe the human thought processes invoked by experienced, non-disciplinary traders as they observe and trade their markets. Price action is simply how prices change - the action of price. It is most noticeable in markets with high liquidity and price volatility, but anything that is traded freely (in price) in a market will per se demonstrate price action.

Friday Statistical Zones - Last 30 Fridays Only BTC 📊 Friday Statistical Zones (Pre / Dump / After)
This indicator highlights statistical risk zones for Fridays, based on the last 30 completed Fridays.
It analyzes historical price and volume behavior to determine:
• When a Pre-Dump phase typically starts
• When selling pressure statistically peaks
• When the After-Dump phase usually occurs
The result is a time-based overlay with three zones:
🟡 Pre-Dump · 🔴 Dump · 🟡 After-Dump
⚠️ This is not a signal indicator.
It does not predict price direction.
It provides risk-timing context only.
Best used for risk management and situational awareness on Fridays, not as a standalone trading strategy.

PCR Sentiment & Max Pain by Rakesh Sharma🎯 PCR + SENTIMENT + MAX PAIN INDICATOR
Track options market sentiment to catch reversals before they happen! See where smart money is positioning through Put-Call Ratio analysis.
✨ KEY FEATURES:
- PCR (Put-Call Ratio) with visual zones
- Market Sentiment Analysis (Bullish/Bearish/Neutral)
- Max Pain Level calculation (expiry day advantage)
- Automatic Buy/Sell signals at extreme levels
- Real-time dashboard with actionable insights
- Fear & Greed gauge
- Trading action recommendations
🎯 PERFECT FOR:
Nifty, Bank Nifty, Index Options - Intraday & Swing Trading
⚡ TRADING SIGNALS:
- PCR > 1.5 = Market oversold (Fear) → BUY signal
- PCR < 0.7 = Market overbought (Greed) → SELL signal
- Extreme levels trigger STRONG signals
- Contrarian indicator - Trade against the crowd!
💡 UNIQUE ADVANTAGE:
Combines options sentiment with price action for high-probability reversals. Know when institutions are bullish or bearish!
Created by: Rakesh Sharma

HPDR Bands with projectionHPDR: Historical Price Delta Range
What is it? The HPDR indicator measures how much an asset’s price typically changes over a specific timeframe. It looks at historical price movements ("deltas") and organizes them into percentiles. These are then plotted on your chart as a median line surrounded by statistical bands.
This tool helps you understand an asset’s unique character and its typical price deviations.
Because the median is in this context a statistically relative stable value(if you add 7 values to 1000 it doesn't change much), it allows for high-probability projections of the future median.
For a clearer understanding of the indicator's logic, try setting the Range to 7 and the Offset to -7.
The 50% percentile Band signifies that in 50% of all bars, the price remained within this statistical range.

BTC - BEAM: Adaptive Multiple (Open-Source)Title: BTC - BEAM: Adaptive Multiple Cycle Oscillator | RM
Overview & Philosophy
The BTC - BEAM (Bitcoin Economics Adaptive Multiple) is a premier macro-valuation tool designed to identify the "Logarithmic Pulse" of Bitcoin's 4-year cycles. Unlike standard oscillators that lose relevance as the network grows, BEAM uses an adaptive baseline that tracks Bitcoin’s fundamental growth curve with precision.
It identifies the harmonic distance between the current price and its multi-year mean, helping you spot the rare windows of deep capitulation and terminal euphoria.
Methodology
This edition is a hardened, gap-proof and Open-Source implementation of the canonical BEAM model.
1. The 1400-Day Anchor (200 Weeks):
The model is anchored to a 1400-day Simple Moving Average. On the Weekly chart, this aligns with the legendary 200-week moving average—the historical "floor" of the Bitcoin network. It represents one full halving cycle of data.
2. Daily-Lock Architecture:
Even when viewed on the 1W chart, the script performs its calculations using Daily data. This ensures that the oscillator captures the exact peak day of a cycle, providing a "high-resolution" signal within a "low-noise" weekly environment.
3. Logarithmic Normalization:
We calculate the natural logarithm of the price-to-mean relationship, scaled by a factor of 2.5: Score = ln(Price / 1400d MA) / 2.5 This creates a standardized "Multiple" that remains comparable across all Bitcoin eras.
How to Read the Chart (1W Context)
🟧 The BEAM Line (Orange): Tracks the "macro heat" of the market. On the 1W chart, look for the slope of this line to identify cycle acceleration.
🔴 The Cycle Ceiling (Score > 1.0): Historical Cycle Tops. When the weekly candle sustains in this zone, the market has reached a state of unsustainable mania. Every major blow-off top has been captured in this red corridor.
🟢 The Cycle Floor (Score < 0.1): Generational Accumulation. On the 1W chart, these zones appear as extended "green troughs." These are the only times in history where Bitcoin is fundamentally "too cheap" relative to its 4-year trend.
The Status Dashboard
The bottom-right monitor provides immediate cycle classification:
• BEAM Score: The exact logarithmic multiple.
• Cycle Regime: ACCUMULATION , NEUTRAL , or OVERHEATED .
Credits
BitcoinEcon: For the original concept of the BEAM adaptive model.
⚠️ RECOMMENDATION: While this indicator captures daily data, it is strongly recommended to be viewed on the Weekly (1W) Timeframe. The 1W chart filters market noise and perfectly reveals the long-term "Cycle Narrative."
Disclaimer
This script is for research and educational purposes only. Macro indicators provide structural context; they are not crystal balls. Always manage your risk according to your personal financial plan.
Tags
bitcoin, btc, beam, macro, cycle, halving, log-growth, valuation, on-chain, Rob Maths

Simple Trend Pullback Tool (EMA) v1.1Simple Trend Pullback Filter (EMA)
Overview This script is a lightweight, objective tool designed to filter out market noise and identify high-probability entry zones in trending markets. Built on the core principle of "The Rising Tide," it utilizes a dual-EMA cloud to visualize the trend’s health and highlight where the price is likely to find support after an overextended breakout.
How It Works
Trend Identification: The script tracks the alignment between the EMA 50 and EMA 200. When the price is consistently above this "Cloud," the market is in a confirmed uptrend.
The Pullback Logic: Instead of chasing breakouts (which often lead to FOMO-driven losses), this tool highlights the 'Mean Reversion' zone. It signals an entry when price action "pulls back" into the EMA cloud while the primary trend remains bullish.
Simplicity First: There are no laggy oscillators or repainting signals. It uses price action relative to time-weighted moving averages to keep your chart clean and your decisions logical.
Example Use Case: $CUU.V and NASDAQ:RKLB In the current market (December 2025), we see high-velocity breakouts in sectors like Space and Copper. While a stock like Copper Fox ($CUU.V) may jump 28% on merger news, this script helps traders wait for the necessary consolidation back toward the EMA 20/50 support before committing capital.
Settings
EMA 1 (Fast): Default 50 — Tracks intermediate momentum.
EMA 2 (Slow): Default 200 — The "Line in the Sand" for long-term trend direction.

MACD Divergences + RSI/ADXMACD Divergences + RSI/ADX Indicator
This indicator combines the classic MACD divergence detection with real-time RSI and ADX monitoring in fixed corner labels.
🔹 MAIN FEATURES:
- Automatic MACD divergence detection (Classic & Hidden)
- Visual RSI and ADX labels fixed in the right corner
- Color-coded trend direction (Green: DI+ > DI- | Red: DI- > DI+)
- Customizable MACD settings (Fast/Slow Length, Signal Smoothing)
- Configurable RSI and ADX periods
- Built-in alerts for all divergence types
🔹 DIVERGENCE TYPES:
- Classic Bullish: Price makes lower lows, MACD makes higher lows (Reversal signal)
- Classic Bearish: Price makes higher highs, MACD makes lower highs (Reversal signal)
- Hidden Bullish: Price makes higher lows, MACD makes lower lows (Continuation signal)
- Hidden Bearish: Price makes lower highs, MACD makes higher highs (Continuation signal)
🔹 RSI & ADX DISPLAY:
- Fixed labels in top-right (RSI) and bottom-right (ADX) corners
- Real-time values updated on every bar
- Background color changes based on directional movement (DI+ vs DI-)
- Large, easy-to-read format
🔹 HOW TO USE:
1. Watch for divergence patterns on MACD histogram
2. Monitor RSI for overbought/oversold conditions
3. Check ADX for trend strength (>25 = strong trend)
4. Green labels = Bullish momentum (DI+ > DI-)
5. Red labels = Bearish momentum (DI- > DI+)
🔹 BEST FOR:
- Swing trading on 4H and Daily timeframes
- Trend-following strategies with mo


Power Law of Diminishing Returns for BTC:USDTThis is a script to see if the Law of Diminshining Returns is applicable to BTC/USD

Moon Phases & Declinations - Chronos Capital [BETA]High-Precision Lunar Cycles: Moon Phases & Declinations (Swiss Ephemeris)
Overview
This indicator provides institutional-grade astronomical data directly on your chart. Unlike standard scripts that use basic sine-wave approximations, this tool implements the **Swiss Ephemeris algorithm**, the gold standard for high-precision celestial calculations.
By tracking the Moon’s phases and its **Maximum/Minimum Declinations**, traders can identify potential "turning points" or "energy shifts" in market volatility often associated with lunar cycles.
---
Key Features
Ultra-High Precision: Calculations are accurate to within *seconds* of time, ensuring that the visual plot aligns perfectly with astronomical reality.
Moon Phase Tracking: Distinct markers for New Moon, Full Moon, and Quarters.
Lunar Declination Peaks: Automatically identifies when the moon reaches its *Maximum North* and *Maximum South* points (Lunar Extremes).
Customizable Visuals: Toggle between background highlights, vertical lines, or plot signals to suit your trading style.
---
Technical Accuracy
This script is built using a ported version of the Swiss Ephemeris
Positional Accuracy: Within 0.1 arcseconds.
Time Accuracy: Within **~1-2 seconds** of official JPL data.
Algorithm: Integration of the *ELP2000-85* lunar theory for maximum reliability over decades of historical data.
---
### **How to Use**
1. **Reversal Zones:** Watch for the Moon’s *Max/Min Declination* points, which often coincide with local tops or bottoms in trending markets.
2. **Volatility Shifts:** Use the *New Moon* and *Full Moon* markers to anticipate periods of increased or decreased market liquidity and volume.
3. **Confluence:** Best used in combination with your existing price action or momentum indicators to add a "time-based" filter to your entries.
*Disclaimer: This tool is for educational and analytical purposes only. Lunar cycles are a study of time-based correlation, not a guaranteed financial signal.*

Mini RSI+STOCH-RSI+RSI-DIVERGENCE @Marx_CapitalMini version of RSI + STOCHASTIC-RSI with RSI-Divergence detection - all in one, adjustable small table overlayed on your chart. The table box gives RSI and Stoch-RSI values and signals detected RSI divergences.
Uncheck 'Update only on bar close' in indicator settings if the box does not appear right away.

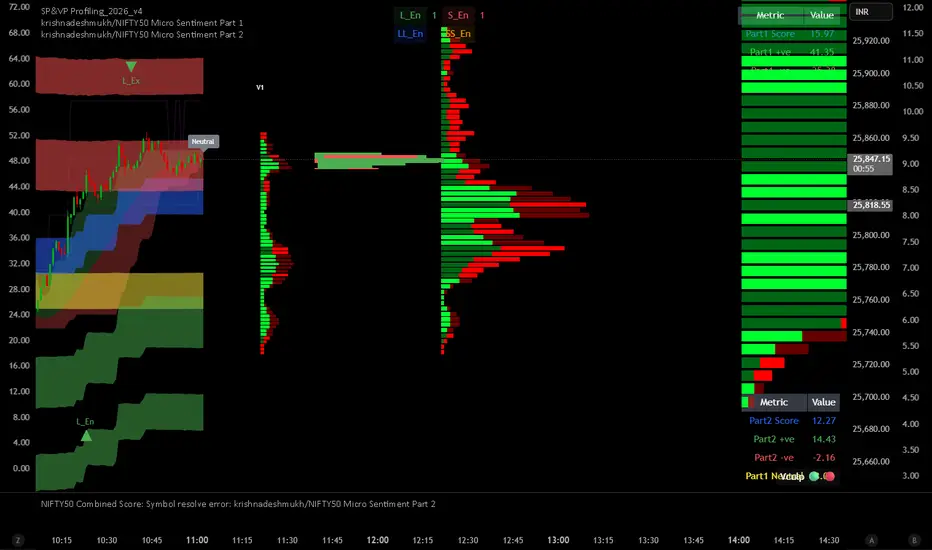
krishnadeshmukh/NIFTY50 Micro Sentiment Part 1📘 Script Description: NIFTY50 Micro Sentiment — Part 1
This indicator tracks real-time micro sentiment across the top 25 weighted stocks of the NIFTY50 index using a volume-based distribution model.
🔍 How it works:
Scans last N bars (configurable) for each stock.
Divides each stock’s price range into equal bins.
Measures bullish vs bearish volume in each bin based on:
Candle Color (Close > Open) or
Close Near High (Close > Midpoint).
Assigns a sentiment value:
+1 → Bullish dominance
-1 → Bearish dominance
0 → Neutral
📊 Each stock's sentiment is weighted by its contribution to the index.
🧮 Displays:
Weighted Sentiment Score
Bullish / Bearish / Neutral Components
Updated every 5 bars with an easy-to-read table.
Use this to gauge underlying micro shifts in sentiment before broader market moves.