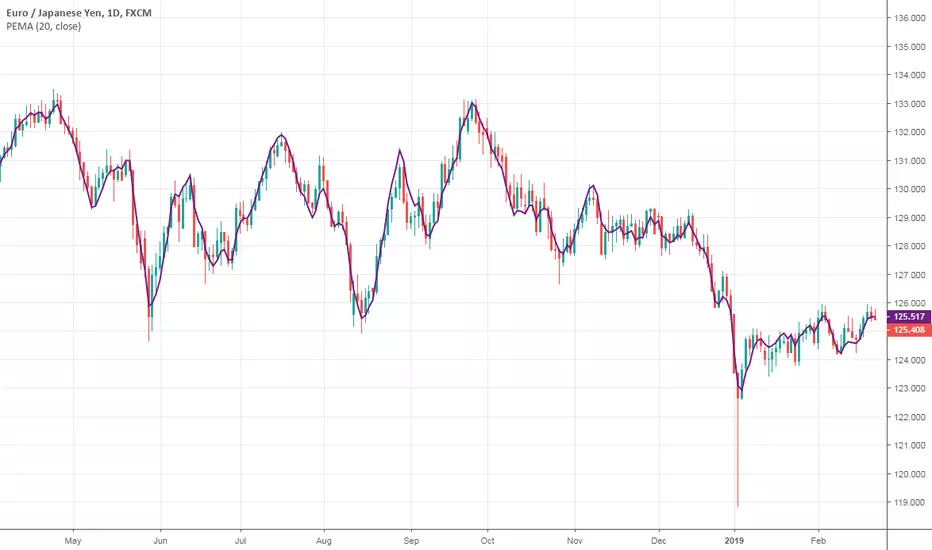
PEMA SUITESPivot based EMA (PEMA) is giving ema based on pivot .
Pivot MA's indicator is a combination of the following:
Pivot SMA
Pivot EMA's
Pullback to EMA Band
Pivot EMA's Cross Over
Pivot Double-EMA's Cross Over
Modified Pivot EMA's Cross Over
All the pivot EMA’s calculations are based on "Profiting With Pivot-Based Moving Averages" book by Frank Ochoa.
How to use it :-
One should have to refer this book for in depth usage of this indicator.
You can use the option's provided in the indicator and the signals have been generated according to the concept in this book.
Don't turn on multiple option's, it becomes clumsy to look.
Description:-
1. Pullback to PEMA Band:-
Perhaps the most trader-friendly PEMA setup is the PEMA Pull-Back, because it forces you to trade in the direction of an established trend.
In this, u get the signal when the price retraces to 13 EMA and closes above the PEMA Band.
It is like Buy the Dips & Sell the Rips. The idea of the PEMA Pull-Back is to buy the market at a discount during an uptrend, and sell the market at a premium during a down trend.
2. PEMA Cross Over :-
The PEMA Crossover fires a signal when the fast EMA crosses the slow EMA.
If the fast EMA crosses above the slow EMA, a long signal is fired; whereas, if the fast EMA crosses below the slow EMA, a short signal is fired.
Depending on your trader personality, you will have to choose the periodicities of the two moving averages to suit your taste.
Some combination of EMA's are provided.
3. Double EMA Cross Over :-
A double exponential moving average (DEMA) is basically the EMA of an EMA, meaning the output is the second derivative of the original exponential moving average.
While an EMA is a faster moving average than the SMA, the DEMA is on another level in terms of speed.
4. Modified PEMA Cross Over :-
This system is an ultra-fast PEMA crossover signal that has built-in trend confirmation.
The Modified PEMA Crossover system fires signals in the direction of the prevailing trend, as measured by a larger moving average.
For Example, Take (1,3),21 combination. In this we use 1- and 3-period pivot EMA’s for crossovers, and use a 21-period pivot EMA for trend confirmation.
1 and 3 period EMA's are not shown in the chart, Only 21 EMA and signals are shown for clear view.
Therefore, this system will only allow bullish crossover signals to fire when price is above the 21-period pivot EMA, and will only allow bearish crossover signals to fire when price is below the 21-period average.
In essence, the results are usually highly qualified “buy the dip, and sell rip” type of opportunities.
This also helps you to avoid getting chopped up during price confluence.
Traders have to look for reversal when price is near the pivot based EMA Zone.
Pema

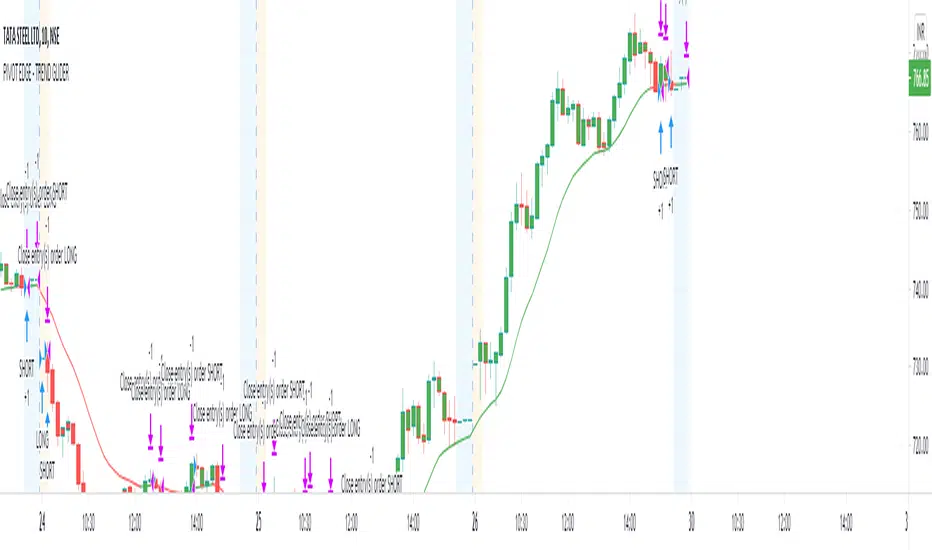
PIVOT EDGE - TREND GLIDEROne of the Biggest challenge in trading is to find the right trend and once we are in the right trend, holding on to winning trades is the next challenge. So this indicator addresses both these issues and helps you with
finding the right trend and also guide you and glide the trades till there is a change in trend by means of proper trend based candle color.
You can just look at the basic candle color as per the prevailing trend and be in the trend as long as the candle colors doesn't change. You need not worry or panic about the small pullbacks or retracements which is a normal
course of any trend continuation. Without this Indicator, in normal situation we would have ended our trades thinking the trend has changed and only to find that trend is again continuing and giving us more than 3-4 times reward after exit.
This Indicator is coded in such a way that no matter what may be the standard color of the candle, This Indicator will paint the candles to Green color in an Uptrend and it will paint the candles RED color in downtrend.
You can take entries as soon as you see the trend formation and wait till the trend is changed or the candle color is changed.
This indicator is intended for the use of newbies or Novice traders to give them confidence and also to guide them towards the proper trend so that they are not taking any counter trend trades.
This Indicator is also beneficial for experienced and master traders to keep them in trade and glide until there is a clear change in trend thereby riding their profits for longer time.
This is a Moving average crossover based strategy but slightly different in the computation where in I have used the customized PEMA values to suit most favorable win ratio.
The results are best when used for timeframe of 10 mins and above. Also you must know the basics of candle stick patterns and price action to take suitable entries and exit at favorable risk reward ratio.
Always do not wait for exit signal from the indicator. You can exit whenever you have gained decent profit and you can keep a trailing stop loss and lock in your profit.
This Indicator works on all Markets and all types of timeframes. Kindly do backtesting for atleast 2-3 months data before using it for live market. Also you must find out which stocks you wish to trade and check if this indicator works favorably for your scripts. The results might slightly vary on stocks
with high volatility.
Always look for the curve in trending up direction of trending down direction. Do not trade whenever the curve is flat and not inclined upside or downside.
Always trade with a suitable STOPLOSS in place and trade with less quantity till you find comfort and confidence with this Indicator.
Further updates to follow periodically. Incase you like this script, like it and share it to others too. Also take a look at the other scripts that I have published.
Happy Trading
Mohan
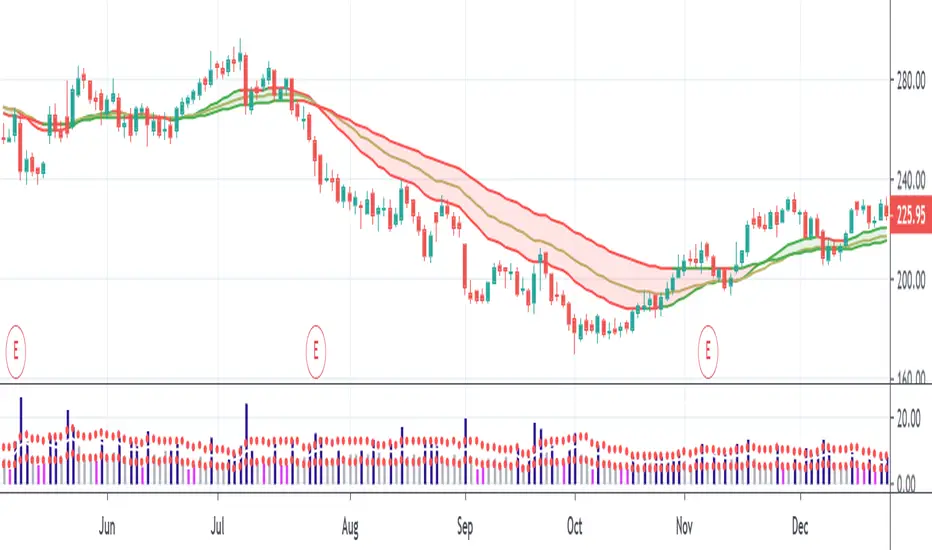
Pivot-based EMA Bands (PEMA)This indicator draws 3 exponential moving averages.
It is coded according to the concept of pivot-based exponential moving averages. It visually reveals value opportunities during trending markets.
The moving averages are constructed based on pivot/typical price.
Typical price = (H+L+C)/3
There are 3 groups of exponential moving averages calculated using a typical price.
Moving average periods:
High Intensity: 8/13/21
Medium Intensity: 13/21/34
Low Intensity: 13/34/55

IndianPivotBossPEMAPivot EMA with color codes indication the possible direction of the market.
Also added prefix to the name of the indicator for easy identification of my indicators.
Upward sloping bands indicate uptrend and Downward sloping band indicates downtrend.
Upward sloping and downward sloping are differentiated using color codes for easy visual identification.

PivotBoss PEMA MethodPivotBoss PEMA method. Very useful if you combine it with other PivotBoss ADR and PivotBoss Pivots
Pentuple Exponential Moving Average (PEMA)This type of moving average was originally developed by Bruno Pio in 2010. I just ported the original code from MetaTrader 5. The method uses a linear combination of EMA cascades to achieve better smoothness. Well, actually you can create your own X-uple EMA, but be sure that the combination' coefficients are valid.
Pivot Boss EMASFrank Ochoa concept of Pivot based EMAs.
Changes color based on the position of fast and slow PEMAs.
Default values are 21,34,55 (Fibonacci numbers)
Ideal way of usage is to use in conjunction with PEMA Oscillator which I had posted few days back.
