Hash Pivot DetectorHash Pivot Detector
Professional Support & Resistance Detection with Multi-Timeframe Zone Analysis
Developed by Hash Capital Research, the Hash Pivot Detector is a sophisticated indicator designed for identifying key support and resistance levels using pivot-based detection with institutional-grade zone analysis.
Key Features
Zone-Based Detection
Unlike traditional single-line S/R indicators, Hash Pivot Detector uses configurable zones around pivot levels to represent realistic institutional order areas. Adjustable zone width accommodates different asset volatilities.
Multi-Timeframe Analysis
Displays higher timeframe support/resistance levels alongside current timeframe pivots, providing crucial context for institutional positioning and stronger price barriers.
Clean Visual Design
Features Hash Capital's signature fluorescent color scheme (pink resistance, cyan support) optimized for dark charts with high contrast and instant visual recognition. Semi-transparent zones keep your chart clean and readable.
How It Works
The indicator uses pivot high/low detection with configurable left and right bar parameters. When a pivot is confirmed, it plots:
Primary support/resistance lines at pivot levels
Semi-transparent zones representing realistic order areas
Higher timeframe S/R levels as crosses for additional context
Recommended Settings
For Swing Trading:
Pivot Bars: 10-20 left/right
Zone Width: 0.5-1.0%
HTF: Daily (on 1H-4H charts)
For Intraday Trading:
Pivot Bars: 5-10 left/right
Zone Width: 0.3-0.5%
HTF: 1H or 4H (on 5min-15min charts)
Asset-Specific Zone Width:
Forex/Crypto: 0.3-0.5%
Stocks: 0.5-1.0%
Volatile Assets: 1.0-2.0%
What Makes It Different
✓ Zone-based approach (more realistic than lines)
✓ Multi-timeframe confluence detection
✓ Minimal visual clutter with maximum information
✓ Professional institutional aesthetic
✓ Comprehensive tooltips for easy optimization
✓ No repainting - all pivots are confirmed
Best Used For
Identifying high-probability entry/exit zones
Setting stop-loss and take-profit levels
Recognizing breakout/breakdown areas
Multi-timeframe confluence analysis
Swing trading and position trading
Intraday scalping with adjusted parameters
Notes
Works on all timeframes and markets
Fully customizable colors and parameters
All settings include detailed optimization guidance
Clean code, efficient performance
No alerts or notifications (visual analysis only)
Pivot points and levels

Wick Size Percentage (%) IndicatorA lightweight utility script that measures the wick size of every bar in percentages. It helps identify significant rejection blocks and volatility spikes by displaying the exact % value above and below each candle. Perfect for ICT concepts and precise risk management.
This indicator is designed for price action traders who need precise measurements of market volatility and rejection. It automatically calculates and displays the size of both the upper and lower wicks of a candle as a percentage relative to the open price.
Key Features:
Dual Measurement: Separately calculates the upper wick (high to body) and lower wick (body to low).
Percentage Based: Values are shown in percentages (%) rather than price points, making it easier to compare volatility across different assets (Crypto, Forex, Stocks).
Dynamic Labels: Visual labels appear above and below the candles for quick reading.
Fully Customizable: Users can adjust the decimal precision (e.g., for low timeframe scalping), change text size, and toggle visibility to keep the chart clean.
Data Window Support: Values are also visible in the side Data Window for detailed analysis without clutter.

Session important reference linesThis indicator automatically plots crucial price reference points for the Regular Trading Hours (RTH) session, including Yesterday's High/Low/Close, Session Open, Midpoint, and the Initial Balance (IB) range with its 2x extension .
In the example above the lines are:
Dotted green - Today's open price
Dashed yellow - Today's mid line
Solid yellow - Initial Balance high/low
Dotted yellow - Initial Balance extension
Dotted dark green - Previous session high
Dotted dark red - Previous session low
Dotted orange - Previous session close

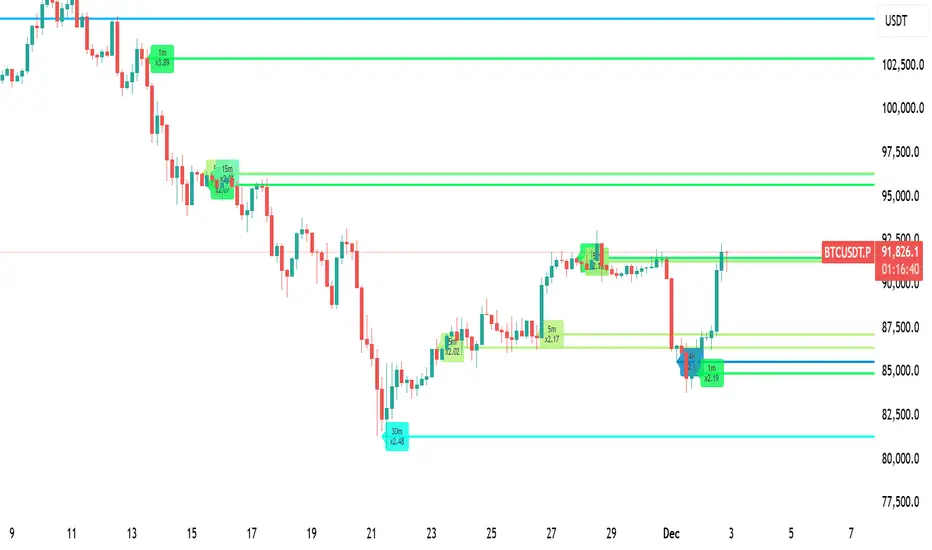
LiquidityPulse Multi-Timeframe Volume Zones/ LevelsLiquidityPulse Multi-Timeframe Volume Zones/ Levels
Non-repainting: levels appear on bar close and do not change.
What This Indicator Does
This indicator scans lower-timeframe price action to identify bars where volume and candle behaviour suggest that a notable price interaction occurred. When all conditions align, the script extracts a precise price level from that bar, plots it on your higher-timeframe chart, and extends it forward so you can observe whether the market interacts with it again later.
Each selected timeframe is processed independently. For every timeframe you enable, the script looks for the following criteria:
1. A shift in candle direction between the previous bar and the current bar
2. A close-to-open body alignment , helping filter out irregular or noisy movement
3. A volume increase relative to the recent average , based on a user-selected multiplier
If these conditions are met, the script marks the corresponding price level on the chart. You can enable up to seven lower timeframes at once, each with its own independent settings, colours, strength filters, and display capacity. This allows you to build a layered, multi-timeframe view of the levels/ zones.
How It Works
1. Candle Behaviour Shift
The script checks whether the previous bar and the current bar show opposing directional behaviour. This helps highlight moments that may reflect a shift in directional behaviour or a change in price movement characteristics.
2. Body Alignment
The previous bar’s close must closely align with the current bar’s open. This requirement reduces random noise and focuses detection on areas where structure between candles is unusually clean.
3. Volume Requirement
The combined volume of the current bar and the previous bar must exceed the recent average by a multiplier you choose.
Lower multiplier - more levels
Higher multiplier - only the most significant activity spikes qualify
This filters for bars with above-average participation (volume).
4. Price Level Identification
If all conditions are met, a price edge is defined:
Bearish pressure: upper edge
Bullish pressure: lower edge
This edge marks the price level where the qualifying candle behaviour occurred.
5. Zone Drawing
Each qualifying event produces:
A horizontal line marking the level
A (optional) shaded box around the level
A label showing the timeframe and the exact volume multiplier amount detected
The level then extends forward so you can monitor future interactions.
Key Settings
Zone Strength (Volume Multiplier)
Determines how selective the volume filter is.
Lower settings show more frequent activity
Higher settings restrict detection to only the strongest activity (volume) increases
Multi-Timeframe Framework
Enable/disable per timeframe
Custom source timeframe (e.g., 1m, 5m, 15m, etc.)
Strength threshold per timeframe
How many recent levels to display per timeframe (Show Last N Zones.)
You can display a single timeframe or stack several to highlight clustering.
How traders can use this indicator
This script is not a buy/sell signal generator. It is best used as a structural overlay that helps you identify:
Where candle behaviour abruptly shifted with increased volume
Whether multiple timeframes highlight similar levels
Comparing how frequently these conditions appear across different timeframes
How price behaves when revisiting areas of prior activity (levels)
Why this type of detection can be informative
Higher-timeframe charts compress a large amount of lower-timeframe activity. By identifying where the script found notable changes in direction, structure, and relative volume on a lower timeframe, it provides a way to reference points in the price history where behaviour differed from nearby bars. Displaying these levels on a higher timeframe allows traders to see how these conditions align with their broader analysis.
Disclaimer
This indicator does not measure true liquidity or order flow. It uses candle structure and relative-volume comparisons as interpretive tools, and the plotted levels do not represent signals or predictions. All analysis is user-interpreted, and past behaviour does not imply future behaviour.
SVE Pivot PointsSVE Pivot Points are a modified variation of traditional pivot points created by Sylvain Vervoort (SVE). They are designed to adapt more dynamically to price volatility and short-term market structure, giving traders more responsive support and resistance levels.
Unlike standard floor pivots that rely only on the previous period’s high/low/close, SVE Pivot Points incorporate volatility-based smoothing, making the levels more stable during choppy markets and more reactive when volatility expands.
1. Volatility-Adaptive Formulas
SVE uses smoothing techniques (often EMA-based or Vervoort’s proprietary volatility filters) that adjust to current market noise.
This reduces false levels and gives clearer reaction zones.
2. Dynamic Support & Resistance
You still get:
• Pivot (P)
• Support levels (S1, S2, S3)
• Resistance levels (R1, R2, R3)
But they update based on volatility-weighted highs/lows instead of raw numbers.
3. More Reliable in Intraday Trading
SVE pivot points were designed to:
• Improve accuracy
• Reduce whipsaw
• Give better intraday turning points
This is why they’re popular among futures, forex, and index traders.

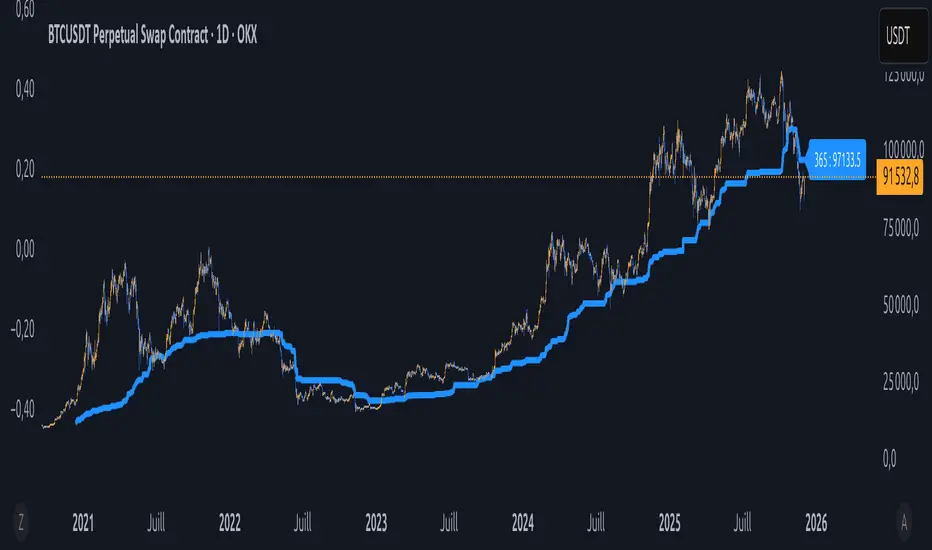
Équilibre du Sentiment – Multi-Périodes (v6)
English
A unique and advanced sentiment indicator based on the harmonic mean of highs and lows over nested rolling windows.
How it works:
The neutral sentiment point is reached when positive sentiment equals negative sentiment, which corresponds to the situation where the percentage between the price and the minimum is equal to the percentage between the maximum and the price.
For each chosen period N, the script calculates N different "neutral feeling" values:
- One using the last 1 bar
- One using the last 2 bars
- …
- One using the last N bars
It then extracts the exact median of these N values using a sorted insertion method (no approximation).
This produces an extremely smooth, non-repainting equilibrium line that represents the true "central sentiment" of the market over the selected lookback.
Features:
- Up to 3 independent periods (365, 52, 26 by default – fully customizable)
- Optional background coloring (green/red) when price is above/below the main curve
- Clean labels on the last bar showing the current value for each active period
- Zero repainting – fully compatible with strategies and alerts
- Highly responsive even with very long periods (up to 3500 bars)
Great for:
- Identifying long-term fair value / equilibrium zones
- Building mean-reversion or breakout systems
Pure Pine Script® v6 – no external libraries, no security calls, no repainting-free.
High-Res VP + Macro Auto Fib DJVolume profiling plus Fibonacci for the descrationary trader.
Volume profile: The most important tool that I know.
Fib: Gives you an idea of the moves.

new alertable spacemanhope these alerts work. open to fixes
slight modification to Key Levels SpacemanBTC IDWM script
credit: spacemanbtc
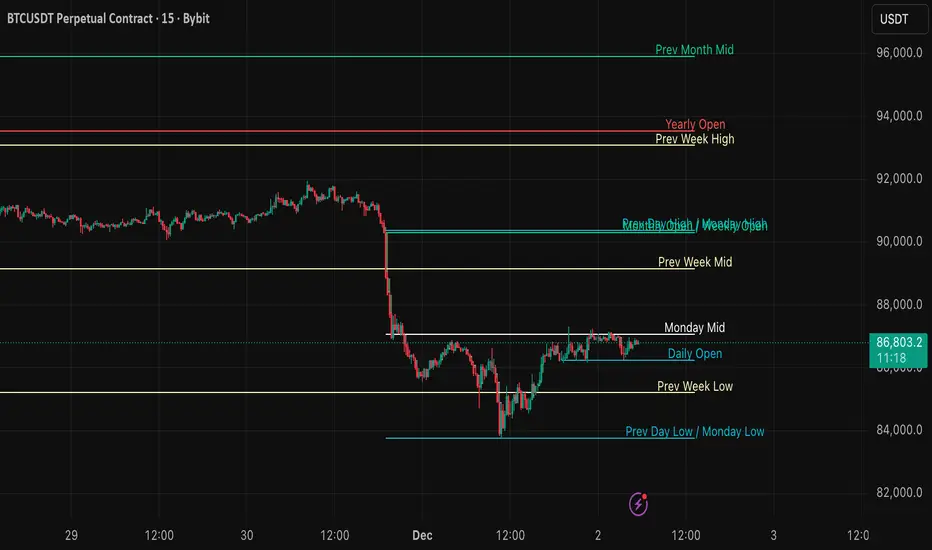
Forex indicator By petran Elevate your market analysis with this powerful, all-in-one visual toolkit designed for discretionary traders across Forex, indices, and commodities (metals).
Core Features:
Trading Sessions Overlay: Clear visual bands highlighting the Asian, London, and New York trading sessions directly on your chart. Never miss a market open or a session overlap again.
Smart Daily Levels: Automatically plots the most essential reference points from the previous day:
PDH / PDL (Previous Day High/Low) – Key support and resistance.
PWH / PWL (Previous Week High/Low) – Higher timeframe context.
DO (Day Open) – A crucial intraday pivot level.
Motivational Watermark: A unique and customizable text overlay at the top of your screen. Display your favorite trading quote, rule, or reminder to maintain the right mindset during the trading day.
Clean & Customizable: Designed for clarity. Adjust colors, session times, and watermark text to fit your personal trading style and chart aesthetics.
Why Traders Choose This Indicator:
Saves Time: No more manually drawing sessions or calculating yesterday's levels.
Improves Discipline: The visual sessions and watermark help you trade only during your planned times and follow your rules.
Universal Application: Works seamlessly on any liquid market where session activity and daily ranges matter.
Perfect for traders who rely on price action, session-based strategies, and need a clean, informative chart environment.

DWM HLOC, Mid & WicksSimple, yet effective.
1. Automatically calculate and projects key price levels from a previous period (Yesterday, OR Last Week / Month) onto the current trading session. It acts as an immediate Support & Resistance map based on historical price action.
2. Multi-Timeframe Logic
Modes --
Daily Mode: Projects yesterday's data onto today.
Weekly Mode: Projects last week's data onto the current week.
3. Key Levels Visualized The script calculates seven distinct price levels:
OHLC: Previous Open, High, Low, and Close.
Equilibrium (Mid): The exact 50% mark between the previous High and Low.
Wick Midpoints (New):
Upper Wick 50%: The midpoint between the High and the top of the body.
Lower Wick 50%: The midpoint between the Low and the bottom of the body.
4. Smart "Gap" Visualization The script uses unique starting points to help traders visualize market gaps:
Standard Levels (High, Low, Open, Mids): These lines originate from the Previous Period's Open, showing the full context of the level relative to time.
Close Level: This line originates from the Current Period's Open. This visually highlights the "Gap" (the jump in price between where the market closed previously and where it opened today).
5. Full Customization
Aesthetics: Every line can be individually toggled on/off.
Styling: Users can independently change the color, line style (Solid, Dotted, Dashed), and thickness for every specific level.

HL/LH Confirmation Strategy (Clean Market Structure)🚦 HL/LH Confirmation Strategy (Clean Market Structure)
This indicator is specifically designed to help traders identify a clean market structure by tracking the formation of Higher Lows (HL) and Lower Highs (LH). Rather than chasing new price extremes (new Highs or new Lows), the focus is on waiting for trend strength confirmation before considering an entry.
Key Strategy: Waiting for Trend Confirmation 💡
The core advantage of this indicator lies in its confirmation strategy:
For Uptrends (Bullish): The indicator doesn't signal just any low, but only when it detects a Higher Low (HL)—a low that is higher than the previous low. This is a crucial sign that the market has defended a level and is ready to continue moving up. This approach helps avoid chasing new lows and encourages entering trades after confirmation.
For Downtrends (Bearish): Similarly, the indicator looks for the formation of a Lower High (LH)—a high that is lower than the previous high. This suggests that buyers failed to breach the last resistance, signaling a potential continuation of the downside movement.
The indicator alternates between looking for an HL, then an LH, then an HL, visually mapping the Pivot swings and highlighting the moment of trend confirmation for potential trade entries.
Indicator Features ✨
Clear Structure Display: By drawing connecting lines between valid HL and LH points, the indicator visually maps the current market structure.
Pivot Detection: It uses an effective method for Pivot detection, with the sensitivity adjustable via the "Pivot Left" and "Pivot Right" parameters.
Custom Label Placement (Crucial Detail):
HL Label: Placed below the candle for better visual clarity of the bullish support area.
LH Label: Placed above the candle for better visual clarity of the bearish resistance area.
Customizable Colors: Full control over the background and text colors for HL and LH signals, as well as the thickness and color of the connecting lines between Pivot points.
⚙️ Input Parameters
Pivot Settings
Pivot Left / Pivot Right: Determine the number of bars to the left and right that must have lower/higher prices for a point to be declared a valid Pivot (Pivot High or Pivot Low). Increase these values to detect more significant, longer-term swings.
Signal Colors
HL Background/Text Color: Colors for the background and text of the Higher Low (HL) labels.
LH Background/Text Color: Colors for the background and text of the Lower High (LH) labels.
Line Settings
Line Color / Line Width: Allows customization of the appearance of the line connecting the detected HL and LH points.
Recommended Use
This indicator is ideal for traders practicing Price Action and strategies based on Market Structure. Use the HL signals as potential zones for long entries (buying) in an uptrend, and LH signals as zones for short entries (selling) in a downtrend, always after the point formation is confirmed.

MGC1! Sniper Levels Midnight PDH PDLNY Midnight (Blue): The NY midnight opening level, which extends throughout the day.
PDH & PDL (Green/Red): The previous day's closing levels.
VWAP (Orange): Reset daily.

Manual Pivot Plotter//================================================================================
//📌 Manual Pivot Plotter (P, R1–R3, S1–S3)
//📈 Pine Script v6
//
//This script allows the user to manually input Pivot levels (P), Resistance levels
//(R1, R2, R3), and Support levels (S1, S2, S3). Each line starts at the beginning
//of the new trading day (detected at 00:00 UTC+8) and extends only a limited
//distance into the future (default: 3 bars).
//
//Features:
//✔ Manual pivot, support, and resistance level inputs
//✔ Lines refresh automatically at each new day (00:00 UTC+8)
//✔ Lines extend only a few bars ahead (not full chart)
//✔ Clean label placement slightly below line and near line end
//✔ No repainting, memory-safe line handling
//✔ Smooth intraday updates when values are edited
//
//This tool is ideal for traders who manually calculate or import pivot levels and
//prefer clean, minimal, non-intrusive visual levels on the chart.
//================================================================================

Equal Highs/Lows Multi-Pivot [Julio]Equal Highs/Lows Multi-Pivot
Description
A sophisticated multi-timeframe pivot analysis tool that detects and highlights equal highs and equal lows across four different pivot lengths simultaneously. This indicator identifies price levels where the market creates identical extremes, a powerful signal of institutional support/resistance and potential reversal or breakout zones.
How It Works
Four Independent Pivot Streams
Pivot 1 (Intraday - 2 bars): Ultra-fast level detection for scalpers
Pivot 2 (Session - 4 bars): Short-term swing levels
Pivot 3 (Daily - 6 bars): Medium-term structural levels
Pivot 4 (Weekly - 9 bars): Long-term institutional levels
Equal High (EQH) Detection
Compares consecutive swing highs and draws a line when two highs are nearly identical within a defined threshold. The indicator uses ATR-based confluence to determine "equality," filtering out noise while catching true market structure.
Equal Low (EQL) Detection
Same logic applied to swing lows, identifying support zones where price repeatedly fails to break below previous lows.
Key Features
Four Simultaneous Timeframes: Analyze intraday, session, daily, and weekly structures all on one chart
ATR-Based Confluence Threshold: Automatically adjusts sensitivity based on current volatility (no fake signals)
Color-Coded Levels: Each pivot length has distinct colors for instant visual identification
Highs: Red, Orange, Yellow, Fuchsia
Lows: Green, Blue, Aqua, Purple
Confirmation Mode: Optional setting to wait for full pivot confirmation before marking levels
Customizable Alert Zones: Toggle individual pivot lengths on/off to reduce clutter
Smart Label Positioning: Labels auto-center between the two equal pivots for clarity
Ideal For
Swing traders tracking support/resistance across multiple timeframes
Scalpers identifying micro-structure for quick entries and exits
Market structure analysts studying institutional price action patterns
Multi-timeframe traders needing confluence from intraday to weekly levels
Anyone trading 1-minute to 4-hour charts
Trading Applications
Identify strong support/resistance zones: Equal levels = confirmed institutional levels
Confirm trend reversals: Multiple equal lows = strong accumulation zone; multiple equal highs = distribution
Plan entries with precision: Enter near equal levels for higher probability setups
Detect liquidity concentration: Where price repeatedly tests the same level
Multi-timeframe confluence: Look for equal levels across multiple pivot lengths for ultra-strong zones
How to Use
Identify the equal levels: Color-coded lines instantly show where price creates matching extremes
Check for confluence: Strong setups occur where multiple pivot lengths align
Wait for price action: Watch for breakouts through equal levels or reversals at these zones
Enter with structure: Use equal levels as entry/exit triggers combined with your trading methodology
Manage with confidence: These levels mark institutional decision points
Customization Options
Adjust pivot lengths to match your preferred timeframe structure
Set ATR threshold sensitivity (lower = stricter equality, higher = more signals)
Toggle confirmation mode for additional filter
Enable/disable individual pivot streams to reduce visual clutter
Customize colors to match your chart theme
Default Settings Optimized For
NASDAQ futures and liquid forex pairs
Intraday and swing trading (1-minute to 4-hour charts)
Smart Money / ICT trading methodologies
Volatility-adjusted confluence detection

XAUUSD 9/1 and 6/4 ZONE LINE (Buy zone and SELL zone)When trading the XAUUSD pair, I noticed that gold often reverses from price levels ending with the digits 9/1 and 6/4. Because of this pattern, I began drawing lines based on these price endings and integrating them into my trading strategy. When combined with other trading methods, these levels provided strong and consistent results.
Feel free to try it yourself — just make sure to analyze the market carefully before entering any trade!

Simulateur Carnet d'Ordres & Liquidité [Sese] - Custom🔹 Indicator Name
Order Book & Liquidity Simulator - Custom
🔹 Concept and Functionality
This indicator is a technical analysis tool designed to visually simulate market depth (Order Book) and potential liquidity zones.
It is important to adhere to TradingView's transparency rules: This script does not access real Level 2 data (the actual exchange order book). Instead, it uses a deductive algorithm based on historical Price Action to estimate where Buy Limit (Bid) and Sell Limit (Ask) orders might be resting.
Methodology used by the script:
Pivot Detection: The indicator scans for significant Swing Highs and Swing Lows over a user-defined lookback period (Length).
Level Projection: These pivots are projected to the right as horizontal lines.
Red Lines (Ask): Represent potential resistance zones (sellers).
Blue Lines (Bid): Represent potential support zones (buyers).
Liquidity Management (Absorption): The script is dynamic. If the current price crosses a line, the indicator assumes the liquidity at that level has been consumed (orders filled). The line is then automatically deleted from the chart.
Density Profile (Right Side): Horizontal bars appear to the right of the current price. These approximate a "Time Price Opportunity" or Volume Profile, showing where the market has spent the most time recently.
🔹 User Manual (Settings)
Here is how to configure the inputs to match your trading style:
1. Detection Algorithm
Lookback Length (Candles): Determines the sensitivity of the pivots.
Low value (e.g., 10): Shows many lines (scalping/short term).
High value (e.g., 50): Shows only major structural levels (swing trading).
Volume Factor: (Technical note: In this specific code version, this variable is calculated but the lines are primarily drawn based on geometric pivots).
2. Visual Settings
Show Price Lines (Bid/Ask): Toggles the horizontal Support/Resistance lines on or off.
Show Volume Profile: Toggles the heatmap-style bars on the right side of the chart.
Extend Lines: If checked, untouched lines will extend to the right towards the current price bar.
3. Colors and Transparency Management
Customize the aesthetics to keep your chart clean:
Bid / Ask Colors: Choose your base colors (Default is Blue and Red).
Line Transparency (%): Crucial for chart visibility.
0% = Solid, bright colors.
80-90% = Very subtle, faint lines (recommended if you overlay this on other tools).
Text Size: Adjusts the size of the price labels ("BUY LIMIT" / "SELL LIMIT").
🔹 How to Read the Indicator
Rejections: Unbroken lines act as potential walls. Watch for price reaction when approaching a blue line (support) or red line (resistance).
Breakouts/Absorption: When a line disappears, it means the level has been breached. The market may then seek the next liquidity level (the next line).
Density (Right-side boxes): More opaque/visible boxes indicate a price zone "accepted" by the market (consolidation). Empty gaps suggest an imbalance where price might move through quickly.
⚠️ Disclaimer
This script is for educational and technical analysis purposes only. It is a simulation based on price history, not real-time order book data. Past performance is not indicative of future results. Trading involves risk.

Key Levels: Monday / Weekly / Monthly + Year/Quarter + LiquidityKey Levels: Monday / Weekly / Monthly / Year / Quarter + Liquidity

SNP420/TRCS_MASTERMicro Body Candle Highlighter is a visual tool for TradingView that continuously scans the active timeframe and highlights all candles with an extremely small body.
For every bar (including the currently forming one), the indicator compares the absolute distance between Open and Close to a user-defined threshold in ticks (default: 1 tick, based on syminfo.mintick).
If the candle’s body size is less than or equal to this threshold, the indicator draws a red frame around the candle – either around the body only or the full high-to-low range, depending on user settings.
Optionally, the indicator can also trigger alerts whenever such a “micro body” candle is detected, allowing traders to react immediately to potential indecision, pauses, or micro-reversals in price action.
author: SNP_420
project: FNXS
ps: Piece and love

8am H1 High/LowThis indicator labels and produces horizontal lines indicating 1 hour liquidity levels.

Chandelier Exit + Pivots + MA + Swing High/LowIt combines four indicators.
For use in the Hero course.

Psychological levels [Kodologic] Psychological levels
Markets are not random, they are driven by human psychology and algorithmic order flow. A well-known phenomenon in trading is the "Whole Number Bias" — the tendency for price to react significantly at clean, round numbers (e.g., Bitcoin at $95,000 or EURUSD at 1.0500).
Manually drawing horizontal lines at every round number is tedious, clutters your object tree, and distracts you from analyzing price action.
Psychological levels Numbers is a workflow utility designed to solve this problem. It automatically projects a clean, customizable grid of key price levels onto your chart, helping you instantly identify areas where liquidity and orders are likely to cluster.
Why This Indicator Helps Traders :
Professional traders know that "00" and "50" levels act as magnets for price. Here is how this tool assists in your analysis:
1. Institutional Footprints : Large institutions and bank algorithms often execute orders at whole numbers to simplify accounting. This script highlights these potential liquidity zones automatically.
2. Support & Resistance Discovery: You will often notice price wicking or reversing exactly on these grid lines. This helps in spotting natural support and resistance without needing complex technical analysis.
3. Cognitive Load Reduction: Instead of calculating where the next "major level" is, the grid is visually present, allowing you to focus on candlestick patterns and market structure.
Features :
Dynamic Calculation : The grid updates automatically as price moves, you never have to redraw lines.
Zero Clutter : The lines are drawn using code, meaning they do not appear in your manual drawing tools list or clutter your object tree.
Fully Customizable Step : You define what constitutes a "Round Number" for your specific asset class (Forex, Crypto, Indices, or Stocks).
Visual Control : Adjust line styles (Solid, Dotted, Dashed), colors, and transparency to keep your chart aesthetic and readable.
How to Use in Your Strategy :
1. Target Setting (Take Profit)
If you are in a long position, use the next upper grid line as a logical Take Profit area. Price often gravitates toward these whole numbers before reversing or consolidating.
2. Stop Loss Placement
Avoid placing Stop Losses exactly on a round number, as these are often "stop hunted." Instead, use the grid to visualize the level and place your stop slightly *below* or *above* the round number for better protection.
3. Confluence Trading
Do not use these lines in isolation. Look for Confluence :
Example: If a Fibonacci 61.8% level lines up exactly with a Round Number grid line, that level becomes a high-probability reversal zone.
Settings Guide (Important)
Since every asset is priced differently, you must adjust the "levels Step Size" to match your instrument:
Forex (e.g., EURUSD, GBPUSD): Set Step Size to `0.0050` (50 pips) or `0.0100` (100 pips).
Crypto (e.g., BTCUSD): Set Step Size to `500` or `1000`.
Indices (e.g., US30, SPX500): Set Step Size to `100` or `500`.
Gold (XAUUSD):** Set Step Size to `10`.
Disclaimer: This tool is for educational and visual aid purposes only. It does not provide buy or sell signals. Always manage your risk.

Previous & Current Day LevelsPine Script indicator that displays key price levels from the previous trading day and the current day's opening price on your chart.
What it displays:
The script draws four horizontal reference lines across your chart:
Previous Day High (PDH) - The highest price reached yesterday
Previous Day Low (PDL) - The lowest price reached yesterday
Previous Day Close (PDC) - Yesterday's closing price
Daily Open (DO) - Today's opening price
Key features:
Visual customization - You can adjust colors, line styles (solid/dashed/dotted), line thickness, and text size for all levels
Label positioning - Labels can be offset to the right of the current price action to keep them visible and out of the way
Flexible display - Choose between full descriptive labels ("Prev Day High") or shorthand abbreviations ("PDH")
Performance optimization - The script limits how far back lines are drawn (configurable up to 5000 bars) to prevent rendering issues
Clean presentation - Each level includes a solid horizontal line from its starting point, plus a dotted connector line extending to the label
Why traders use it:
These levels are important reference points for intraday traders. Previous day levels often act as support/resistance zones, and the daily open helps identify potential trend direction. The script automatically updates these levels each day, making it easy to track key price areas without manual drawing.

Key Levels: PDH/L, PMH/L, Oopening RangeBasic scrip that shows Previous Day High and Low, and also Pre-Market High Lows, and also the Opening Range. Everything is adjustable.
