Pivot Points Standard w/ Future PivotsPivot Points Standard with Future Projections
This indicator displays traditional pivot point levels with an added feature to project future pivot levels based on the current period's price action.
Key Features:
Multiple Pivot Types: Choose from Traditional, Fibonacci, Woodie, Classic, DM, and Camarilla pivot calculations
Flexible Timeframes: Auto-detect or manually select Daily, Weekly, Monthly, Quarterly, Yearly, and multi-year periods
Future Pivot Projections: Visualize potential pivot levels for the next period based on current price movement
Custom Price Scenarios: Test "what-if" scenarios by entering a custom close price to see resulting pivot levels
Customizable Display: Adjust line styles, colors, opacity, and label positioning for both historical and future pivots
Historical Pivots: View up to 200 previous pivot periods for context
Future Pivot Options:
The unique future pivot feature calculates what the next period's support and resistance levels would be using the current period's High, Low, Open, and either the current price or a custom price you specify for the closing value. Future pivots are displayed with customizable line styles (solid, dashed, dotted) and opacity to distinguish them from historical levels.
Use Cases:
Plan entries and exits based on projected support/resistance
Scenario analysis with custom price targets
Identify key levels before the period closes
Multi-timeframe pivot analysis
Works on all timeframes and instruments.
Points

Magic Equity Trend & PivotsMagic Equity Trend & Pivots is a robust technical analysis engine designed specifically for equity and index traders. It serves as a comprehensive "Trend & Level" companion, combining institutional Pivot Points with a proprietary EMA trend filtering system to identify high-probability setups.
How the Magic Works
This indicator simplifies complex market data into a clear visual workflow:
1. The Magic Equity Trend (Trend Identification) The script uses a weighted system to determine the dominant market direction:
Bullish Trend: Price holds above the primary Trend SMA + a Volatility Buffer (Green Zone).
Bearish Trend: Price is rejected below the Trend SMA - Buffer (Red Zone).
No-Trade Zone: When the price is trapped inside the buffer (Gray Channel), the trend is considered weak or ranging.
2. Institutional Pivot Points Price often reacts at hidden levels. This tool calculates and overlays these levels automatically:
Multi-Type Support: Choose between Traditional, Fibonacci, Woodie, Classic, DM, and Camarilla pivots.
Timeframe Smart-Switching: Use fixed timeframes (e.g., Weekly Pivots on a Daily chart) or let the "Auto" mode decide the best reference period for your current view.
Historical Mode: Unlike standard pivots, these can be back-tested visually to see how prices respected levels in the past.
3. Precision Entry & Exit Logic Trade signals are not random; they are based on a strict confluence of "Magic" factors:
Entry Signal: Requires Trend Alignment + Fast/Slow EMA Crossover + RSI Strength (>60) + Relative Volume Spike.
Top-Up (Add-on): Detects low-risk opportunities to add to a position when price pulls back to the EMA10/20 during a strong trend.
Two-Stage Exit: Secures profits using either an ATR Trailing Stop or an Intraday RSI Breakdown, depending on your settings.
4. Divergence & Momentum
RSI Divergence: Automatically plots Regular Bullish and Bearish divergences to warn of potential reversals at tops or bottoms.
Darvas Boxes: Visualizes consolidation ranges to help identify breakouts.
5. Performance Dashboard A data table provides a snapshot of the asset's health:
Mean Reversion: Measures the % distance from key EMAs (10, 20, 50).
RVOL & ADR: Displays Relative Volume and Average Daily Range to gauge volatility.
Performance Tracker: A theoretical summary table showing how the trend signals have performed over the last 1W, 1M, and 1Y periods.
Settings & Customization
Visuals: Fully customizable colors for the Trend Cloud, Pivots, and Backgrounds.
Filters: Toggle specific filters (Volume, RSI, Trend Buffer) to adapt the sensitivity to different asset classes.
Disclaimer: This tool is for educational purposes and technical analysis assistance only. Past performance displayed in the dashboard does not guarantee future results.

Magic Swing Suite: Trend, Pullback & Risk DashboardMagic Swing Suite: Trend, Pullback & Risk Dashboard
This indicator is a complete Swing Trading System designed to identify high-probability trend continuation setups. It combines classic trend-following principles with a unique "3-Bar Retest" logic and provides a real-time Strategy Dashboard to help you manage positions without needing a separate strategy script.
How it Works:
The system looks for a "Confluence" of factors before generating a signal. It scores every bar out of 140 points based on the following criteria:
Trend Alignment: Price must be above EMA 10, and EMA 10 must be above EMA 20.
Momentum (RSI): RSI must be in the "Bullish Control Zone" (60-80) and above its SMA.
Volume: Volume must be significantly higher than the average (1.5x by default).
The "Magic" Retest: The script checks the last 2-5 bars to see if the price has pulled back to "kiss" the EMA 10. This ensures we are buying a dip in a trend, not chasing a top.
Breakout Confirmation: Checks for Darvas Box breakouts and price position relative to Pivot R1.
Features:
🎯 Virtual Strategy Dashboard: A table that mimics a strategy tester. It tracks Entry, Stop Loss (Trailing), Target 1, and Target 2 in real-time.
📊 Confluence Scorecard: A detailed table showing exactly why a signal was (or wasn't) generated (Trend, Retest, RSI, Volume, etc.).
🛡️ Risk Management: automatically calculates a Trailing Stop (EMA 10) and fixed Risk:Reward targets based on recent highs.
📉 Multi-Layered Overlays: Includes Auto-Pivots (Traditional, Fib, Woodie, etc.) and Darvas Boxes to identify support/resistance levels.
How to Use:
Wait for a Signal:
"FULL BUY SIGNAL" (Green): All conditions are met, including a recent retest of the EMA. This is the highest probability setup.
"BUY - NO RETEST" (Orange): Trend and momentum are strong, but price hasn't pulled back recently. Use caution, as this may be a breakout trade.
Monitor the Dashboard: Once a trade is active, the dashboard will change to "IN POSITION." Follow the "Action" row.
If the trend weakens, the Trailing Stop (EMA 10) will move up to protect profits.
Targets:
T1: Previous Swing High (or 5% if no high found).
T2: 1:1.6 Risk/Reward extension.
Settings:
Volume Spike Factor: Adjust how much volume is needed to confirm a move. Default is 1.2.
Retest Tolerance: Adjust how close the price needs to get to the EMA 10 to count as a "retest."
Dashboard Toggles: You can hide the tables if you prefer a clean chart.
Pivot Timeframes: customizable lookback for S/R levels.
FAQ:
Does this repaint?
No. All signals trigger only on confirmed bars.
Can I use this intraday?
Yes. Works great from 5m to 1D.
Are exits manual or automated?
The indicator tracks SL, T1, and T2, and marks them on the chart.
Does retest affect the buy signal?
Retest is optional. The buy logic does not require it, but adds weight to the score.
Disclaimer: This tool is for educational purposes only. The "Strategy Dashboard" is a simulation based on script calculations and does not execute real trades. Always manage your own risk.

Adaptive Support and Resistance LevelsAdaptive Support and Resistance Levels
This indicator is a comprehensive institutional-grade trading tool designed to visualize Auction Market Theory (AMT), Support and Resistance concepts directly on the price chart. It is built for traders who require a deep understanding of market structure without the visual clutter of standard retail indicators.
Key Features:
1] Fractal Adaptive Engine:
The indicator automatically adjusts its calculations based on your timeframe.
-Intraday (1m-15m): Displays Daily Levels.
-Swing/Positional (30m-1H): Displays Weekly Levels.
-Long Term (Daily+): Displays Monthly Levels.
2]Untested Levels:
-Identifies levels from previous sessions that have not been tested by price.
-Extends these levels forward as "Magnets" until price touches them.
-Touch-Delete Logic: Once price interacts with a magnet, the line is automatically removed to keep the chart clean.
3] Institutional Dashboard:
- A "Flight Deck" table in the top-right corner provides real-time metrics:
-Context: Are we inside, above, or below the previous value zone?
-Auction State: Is the current market balanced or imbalanced?
-IB Status: Initial Balance (first 60 mins) breakout/breakdown status.
-Fuel Gauge: Measures current range vs. ADR (Average Daily Range) to gauge exhaustion.
-Volume Flow: Detects high-aggression volume relative to the average.
How to Use:
Trend Following: Look for price breaking out of the (Static Lines) , Pullback rejection, Rejection from the lines.
Reversion: Use the lower lines for bulls reversal and Upper lines for bears reversal ( Kind of reversal candle formation )
Risk Management: Use the ADR Fuel Gauge to avoid buying extended markets (>100% ADR).
Disclaimer: This tool is only for educational and analytical purposes only. Not any recommendation.

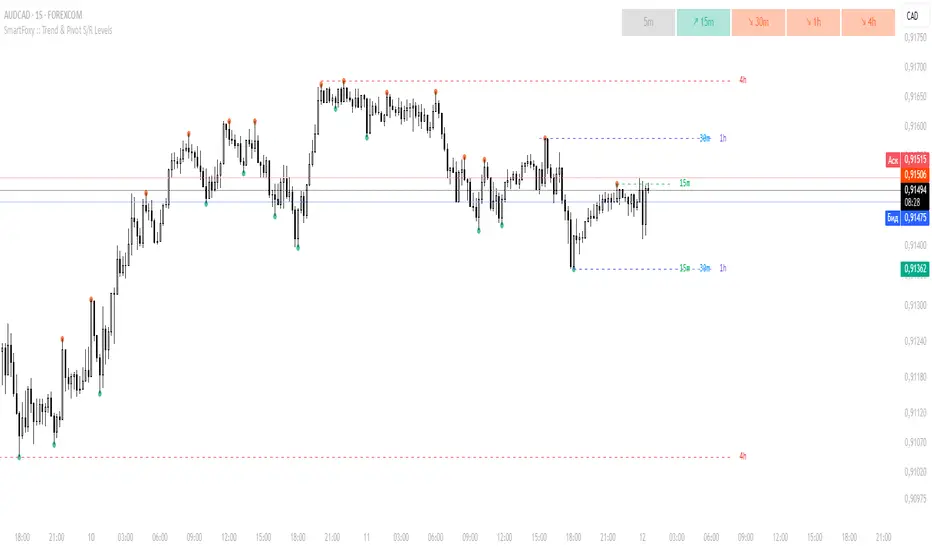
MTF Trend Analyzer with Swing Pivots & S/R Levels [SmartFoxy]Indicator “Multi-Timeframe Trend Analyzer with Swing Pivots & S/R Levels”
📌 Overview
Trend & Pivot S/R Levels is a multi-timeframe market structure analyzer that identifies trend direction, detects swing highs/lows, and plots higher-timeframe support/resistance levels directly on your chart.
Designed for traders who want fast, clean, and accurate trend context without constantly switching timeframes.
________________________________________________________________________________
✨ Core Features
1. Multi-Timeframe Trend Analyzer .
Analyze up to five higher timeframes simultaneously — for example:
5m, 1H, 4H, 1D, 1W , etc.
For each timeframe, the indicator detects:
a) Trend direction:
🡕 Uptrend;
🡖 Downtrend.
b) Breakouts of recent pivot highs/lows to determine trend shifts.
c) Automatic graying-out of timeframes lower than the current chart TF .
d) A clean visual Trend Panel that shows:
Arrow direction;
Timeframe label (1D, 1W, etc.);
Trend color (bullish, bearish, neutral).
________________________________________________________________________________
2. Swing Pivot Detection (Current TF)
The script detects local swing points using customizable lookback parameters:
a) Pivot Type:
High/Low — classic swing structure;
Close — smoother swing detection using closing prices.
b) Left/Right Bars Lookback — the number of bars required on both sides to validate the pivot.
c) Multiple marker styles :
Built-in plot shapes (circle, cross, histogram, etc.);
Custom visual labels (▲▼, ◉, ✖, 🡇🡅, ◆, ◼, etc.).
This makes it easy to visually confirm that your swing settings are correct.
________________________________________________________________________________
3. Higher-Timeframe Support/Resistance
The indicator automatically draws HTF S/R lines based on the latest pivot highs/lows from each selected timeframe.
Each timeframe has:
Separate Support / Resistance colors ;
Adjustable line width ;
Selectable line style (solid, dashed, dotted, arrows);
Optional HTF labels displayed on the lines.
This allows you to see major market structure levels from higher timeframes without switching charts.
________________________________________________________________________________
4. Smart Timeframe Safety Checks
If a selected timeframe is lower than your current chart timeframe , its data is:
Disabled for S/R plotting ;
Shown in gray inside the Trend Panel;
Prevents invalid S/R calculations and ensures stable chart performance.
________________________________________________________________________________
⚙️ Customization Options :
Show/Hide the Trend Panel;
Panel placement anywhere on the chart;
Swing pivot type: High/Low or Close ;
Pivot lookback (left/right bars);
Choose five HTFs to analyze;
Enable/Disable HTF S/R;
Configure S/R color for each timeframe;
Line style + line width;
Pivot marker type + size;
Custom label styles + text scaling.
________________________________________________________________________________
✅ Benefits :
Perfect for traders who need instant multi-timeframe structure awareness ;
Reduces the need to constantly switch charts;
Works on all markets : crypto, stocks, forex, indices, futures;
Clean, modern, and intuitive visualization;
Helps confirm trend direction and key S/R levels at a glance.
________________________________________________________________________________
⚠️ Note
The indicator only displays S/R and trend data from higher timeframes relative to the current chart timeframe.
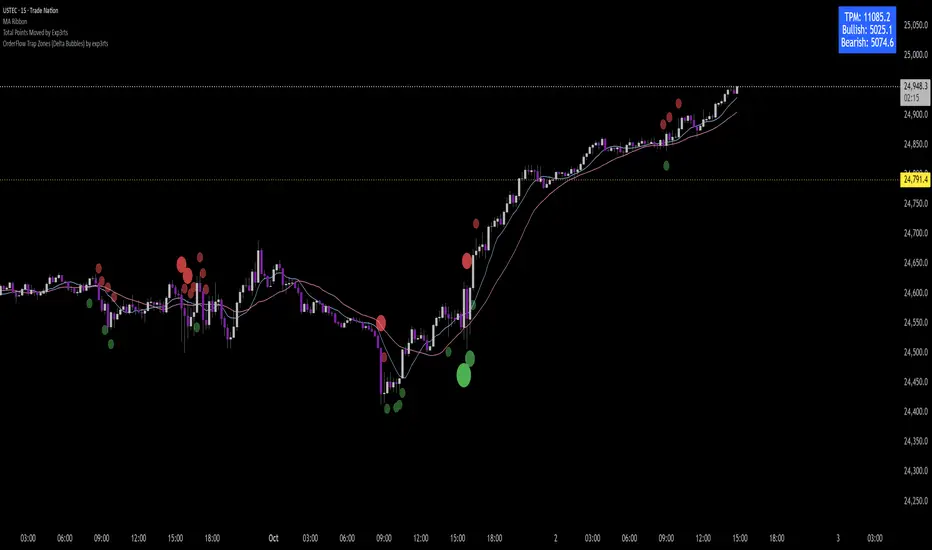
Total Points Range by exp3rtsThis indicator measures and displays the true intraday movement of a market by approximating tick-level activity using 1-second data aggregation. Instead of only looking at net candle movement, it sums every price change during a session, giving traders a more accurate picture of market effort and volatility.
Total Points Moved (TPM) – Captures the full distance traveled by price, not just the net gain/loss.
Bullish vs. Bearish Movement – Separates upward and downward moves so you can see who dominated the session.
Custom Sessions – Define your own session start/end times and time zone for precise tracking.
End-of-Session Summary – Automatically plots a label at session completion with totals for TPM, bullish, and bearish movement.
Visual Session Highlighting – Background shading makes it easy to see when the chosen session is active.
This tool is useful for:
Understanding the true effort vs. result of price movement
Comparing volatility across sessions
Identifying whether bulls or bears contributed more to market swings
Supporting order flow and tick-based trading strategies

Total Points Moved by exp3rtsThis lightweight utility tracks the total intraday range of price movement, giving you real-time insight into market activity.
It calculates:
🟩 Bullish Points – Total range from bullish candles (close > open)
🟥 Bearish Points – Total range from bearish candles (close < open)
🔁 Total Points Moved (TPM) – Sum of all high–low ranges for the day
Values are pulled from the 1-second chart for high precision and displayed in a compact tag in the top-right corner.
Fundur - Market Sentiment A Fundur - Market Sentiment A: Complete Trading Indicator Guide
Indicator Overview
The Fundur - Market Sentiment A is a revolutionary multi-timeframe sentiment analysis indicator that combines advanced ZigZag pivot detection, wave-based structure analysis, and comprehensive market sentiment evaluation into one powerful trading tool. This indicator is designed to identify high-probability reversal points and trend continuations by analyzing market sentiment across 11 different timeframes simultaneously.
What Makes Market Sentiment A Unique?
Market Sentiment A is a sophisticated ZigZag system that utilizes the Market Sentiment B oscillator to perform advanced on-chart analysis against price action. By introducing Histogram-Correlated ZigZag Analysis - a breakthrough methodology that correlates sentiment histogram waves with actual price pivots to identify validated market extremes. Unlike static pivot indicators, Market Sentiment A provides dynamic analysis that adapts to changing market conditions while maintaining precise accuracy in pivot identification.
Core Methodology
The indicator operates on the principle that market sentiment oscillates in measurable waves that precede price movements. By analyzing sentiment patterns across multiple timeframes and correlating them with histogram wave behavior, traders can identify precise entry and exit points with quantifiable strength ratings and comprehensive wave event analysis.
Key Features
🎯 Revolutionary ZigZag System
Histogram-Correlated Detection : Unique correlation between sentiment waves and price pivots
Dynamic Speed Control : High, Medium, Low sensitivity settings for different market conditions
Validated Extremes : Only confirmed pivots are marked with comprehensive validation system
Real-Time Correlation : Live correlation between histogram turns and price extremes
📊 Multi-Timeframe Sentiment Engine
11 Timeframe Analysis : Simultaneous analysis across periods from 8 to 987 bars
Advanced Sentiment Calculation : Proprietary algorithm combining multiple sentiment factors
Momentum Wave Integration : 34-period momentum waves for trend context
Dynamic Smoothing : Optional smoothing for cleaner signals
🧠 Intelligent Wave Event Tracking
Green Wave Events : Bullish histogram wave analysis with comprehensive event detection
Red Wave Events : Bearish histogram wave analysis with detailed event tracking
Event Deduplication : Advanced system prevents duplicate event detection
10+ Event Types : MPIV, HTURN, TRI, SW, VOL, MDIV, HDIV, PDIV and more
⚖️ Advanced Strength Rating System
0-100 Strength Score : Comprehensive strength calculation for every pivot
Multi-Factor Analysis : Based on wave events, trend context, structure, and sentiment
Real-Time Calculation : Dynamic strength scoring as conditions change
Strength Breakdown : Detailed tooltip showing strength components
🎨 Sophisticated Visual System
Validated Pivot Labels : Clear ✓ markers for confirmed extremes
Structure Analysis : HH/HL/LH/LL structure identification with trend context
Dynamic ZigZag Lines : Connecting validated extremes with trend-based coloring
Bar Coloring Options : Momentum swings and market sentiment bar coloring
Comprehensive Tooltips : Detailed information on hover for every pivot
Setup Guide
Step 1: Adding the Indicator
Open TradingView and navigate to your desired chart
Click the "Indicators" button or press "/" key
Search for "Fundur - Market Sentiment A"
Add the indicator to your chart
Step 2: Core System Configuration
ZigZag System Settings
✅ Enable ZigZag System: ON (Core functionality)
ZigZag Speed : Choose based on your trading style:
High Speed : Most sensitive, fastest detection (2-bar lookback) - Best for scalping
Medium Speed : Balanced approach (3-bar lookback) - Recommended for most traders
Low Speed : Most reliable, slower detection (4-bar lookback) - Best for swing trading
✅ Show ZigZag Lines: ON (Visual connection of validated pivots)
Bar Coloring Settings
⚠️ Momentum Swings: OFF (Avoid visual clutter initially)
✅ Market Sentiment: ON (Primary sentiment-based bar coloring)
Step 3: Label Display Configuration
Essential Labels (Recommended Settings)
✅ Show Validated Pivots (✓): ON (Core validated extremes)
⚠️ Show Potential Turns (●): OFF (Reduces noise - enable once familiar)
⚠️ Show Structure Labels: OFF (Start clean, enable for advanced analysis)
⚠️ Include Trend in Structure Labels: OFF (Advanced feature)
✅ Show Strength Rating (💪): ON (Critical for trade quality assessment)
⚠️ Show Market Sentiment Wave Events: OFF (Advanced feature for later)
Label Visual Customization
Label Coloring : Standard (Highs=Red, Lows=Green)
Label Size : Normal
Label Transparency : 0%
Text Transparency : 0%
Step 4: Alert System Setup
✅ Enable Alerts: ON
⚠️ Alert Potential Bullish Turns: OFF (Disabled by design to prevent noise)
⚠️ Alert Potential Bearish Turns: OFF (Disabled by design to prevent noise)
✅ Alert ONLY on Confirmed Extremes: ON (High-quality signals only)
✅ Include Wave Events in Confirmed Alerts: ON (Comprehensive context)
Basic Trading Guide
Understanding the Dynamic ZigZag System
Market Sentiment A is fundamentally a Dynamic ZigZag System that displays validated highs and lows on your price chart. The indicator uses Market Sentiment B wave calculations internally to determine when sentiment waves finish, but these histograms and oscillators are NOT displayed on your chart .
What You See on Your Chart:
✓ Validated Highs : Red checkmarks marking confirmed resistance levels
✓ Validated Lows : Green checkmarks marking confirmed support levels
ZigZag Lines : Connecting validated extremes to show market structure
💪 Strength Ratings : 0-100 scores indicating signal quality
Structure Labels : HH/HL/LH/LL showing trend context
How Validation Works (Behind the Scenes):
High Validation : Uses Market Sentiment B wave analysis to confirm when a price high represents a true resistance level
Low Validation : Uses Market Sentiment B wave analysis to confirm when a price low represents a true support level
Dynamic Detection : Continuously monitors sentiment waves to validate extremes in real-time
Quality Filtering : Only displays the most significant highs and lows based on wave completion
Key Trading Concept:
Focus entirely on the validated highs and lows displayed on your chart. These represent dynamic support and resistance levels that have been confirmed by underlying sentiment analysis. The histogram and oscillator calculations happen internally - your trading decisions should be based on price action around these validated levels.
Entry Strategies
Primary Strategy: Dynamic Support/Resistance Reversals
Setup : Wait for validated pivot with ✓ marker and strength rating displayed on chart
Entry Timing : Enter on the bar when validation occurs or on pullback to the validated level
Direction : Counter-trend to the validated extreme (buy at validated lows/support, sell at validated highs/resistance)
Confirmation : Look for strength rating above 60 for higher probability setups
Structure Context : Consider overall trend using HH/HL/LH/LL structure labels
Secondary Strategy: ZigZag Trend Continuation
Setup : Identify trend direction using consecutive validated highs and lows
Entry : Enter in trend direction when price pulls back to previous validated level
Confirmation : Look for structure labels confirming trend (HH/HL for uptrend, LH/LL for downtrend)
Strength Filter : Use strength ratings above 70 for trend continuation entries
Stop Loss Methodology
For Long Positions (Validated Lows) : Place stop below the validated low price level
For Short Positions (Validated Highs) : Place stop above the validated high price level
Alternative Method : Use previous validated extreme in opposite direction as stop level
Structure-Based Method : Use significant validated levels that would invalidate the trade setup
Buffer Consideration : Add small buffer beyond validated level to account for wicks and spread
Profit Taking Strategy
For Long Positions (Validated Low Entries):
Target 1 : Previous validated high shown on chart (75% of position)
Target 2 : Next significant validated high or key resistance level (50% of remaining 25% = 12.5% of original position)
Target 3 : Extended targets using ZigZag structure analysis and trend context (remaining 12.5% of original position)
Management : Move stop loss to breakeven once first target (TP1) is executed
For Short Positions (Validated High Entries):
Target 1 : Previous validated low shown on chart (75% of position)
Target 2 : Next significant validated low or key support level (50% of remaining 25% = 12.5% of original position)
Target 3 : Extended targets using ZigZag structure analysis and trend context (remaining 12.5% of original position)
Management : Move stop loss to breakeven once first target (TP1) is executed
ZigZag Structure Trading Approach
Sideways Markets : Trade between validated highs and lows - buy at support, sell at resistance
Trending Markets : Use validated levels as pullback entry points in trend direction
Structure Breaks : Watch for breaks of significant validated levels to signal trend changes
Range Identification : Use consecutive validated highs and lows to identify trading ranges
Breakout Trading : Enter when price breaks beyond validated levels with strong momentum
Strength Rating Interpretation
Understanding the 0-100 Strength Score
The strength rating combines multiple factors:
Base Strength (25 points) : Fundamental pivot validation
Wave Events (12 points each) : Number and quality of wave events detected
Trend Context (5-10 points) : Alignment with overall trend direction
Structure Quality (3-8 points) : HH/HL/LH/LL structure strength
Sentiment Position (5-10 points) : Extreme sentiment readings
Momentum Context (5 points) : Momentum divergence confirmation
Strength Categories
90-100 : Exceptional strength - Highest probability setups
75-89 : Strong signal - High confidence trades
60-74 : Good signal - Solid trading opportunities
45-59 : Moderate signal - Use additional confirmation
30-44 : Weak signal - Proceed with caution
Below 30 : Very weak - Generally avoid
Wave Event Reference (Calculation Background)
Understanding Wave Events in Strength Calculations
Wave events are used internally by Market Sentiment A to calculate strength ratings and validate pivots. While these events may appear in alert messages or tooltips, they are not meant for direct trading decisions - they are calculation components that contribute to the overall strength score.
Key Wave Events (For Reference Only)
MPIV↑/MPIV↓ : Momentum pivot detection used in validation process
HTURN : Histogram turn identification used for wave completion
TRI↑/TRI↓ : Triangle pattern detection contributing to strength calculation
SW : Small wave indication affecting pivot quality assessment
VOL : Volume spike detection adding to strength scoring
MDIV↑/MDIV↓ : Momentum divergence contributing to validation strength
HDIV↑/HDIV↓ : Histogram divergence used in pivot confirmation
PDIV↑/PDIV↓ : Price divergence analysis for strength enhancement
How Wave Events Affect Your Trading
Strength Score Impact : More events generally result in higher strength ratings for validated pivots
Alert Context : Events may be mentioned in alerts to provide background on signal quality
Focus on Results : Instead of analyzing individual events, focus on the final strength rating and validated pivot levels
Trust the System : The indicator processes these events automatically - your job is to trade the validated highs and lows
Analysis Setups
Setup 1: Scalping Configuration (1-5 minute charts)
Core Settings:
ZigZag Speed: High (fastest detection for quick scalps)
Show Validated Pivots: ON
Show Strength Rating: ON
Bar Coloring: Market Sentiment
Visual Settings:
Label Size: Small (reduce visual clutter)
ZigZag Lines: ON
Potential Turns: ON (for immediate signals)
Trading Approach:
Focus on strength ratings above 70 for scalp entries
Quick entries at validated highs/lows with immediate execution
Tight stops just beyond validated levels
Target previous validated pivots shown on chart for quick profits
Use ZigZag structure to identify rapid reversal opportunities
Setup 2: Day Trading Configuration (5-15 minute charts)
Core Settings:
ZigZag Speed: Medium (balanced approach)
Show Validated Pivots: ON
Show Strength Rating: ON
Include Wave Events: ON (for context)
Visual Settings:
Label Size: Normal
Show Structure Labels: ON (for trend context)
ZigZag Lines: ON with trend coloring
Trading Approach:
Wait for strength ratings above 60 for quality setups
Use HH/HL/LH/LL structure labels for trend bias
Combine reversal trades at extremes with trend continuation at pullbacks
Hold positions targeting next validated pivot levels
Use ZigZag structure analysis for entry timing and market context
Setup 3: Swing Trading Configuration (1-4 hour charts)
Core Settings:
ZigZag Speed: Low (most reliable signals)
Show Validated Pivots: ON
Show Structure Labels: ON
Include Trend Analysis: ON
Visual Settings:
Label Size: Normal
Show all wave events for comprehensive analysis
Enable all alert types
Trading Approach:
Focus on strength ratings above 75 for swing positions
Emphasize trend continuation using ZigZag structure
Use validated level breaks for major position adjustments
Hold positions across multiple sessions targeting distant validated levels
Use comprehensive structure analysis (HH/HL/LH/LL) for entries/exits
Setup 4: Position Trading Configuration (4H-Daily charts)
Core Settings:
ZigZag Speed: Low (maximum reliability)
Show Validated Pivots: ON
Show Structure Labels: ON
Show all analysis features
Visual Settings:
Clean, comprehensive labeling
Full wave event display
Trend-based coloring for major bias
Trading Approach:
Only trade strength ratings above 80 for position entries
Focus on major ZigZag structure changes and validated level breaks
Use long-term structure analysis (HH/HL/LH/LL) for bias
Hold positions for weeks to months targeting major validated levels
Align with fundamental analysis and major market structure
Setup 5: Multi-Asset Analysis Configuration
For Forex Pairs:
Use Medium to Low speed settings
Focus on major session changes
Pay attention to news event correlation
Use strength ratings above 70
For Crypto Assets:
Medium speed for 24/7 market adaptation
Higher volatility requires strength above 75
Monitor weekend behavior patterns
Consider market sentiment cycles
For Stock Markets:
Align with market hours
Consider earnings and economic events
Use sector-specific analysis
Respect market close/open dynamics
Visual Components
Core Visual Elements
✓ Validated Pivots : Green checkmarks for confirmed lows, red for confirmed highs
● Potential Turns : Small dots showing histogram turn correlations (optional)
ZigZag Lines : Connecting validated extremes with trend-based coloring
💪 Strength Ratings : Numerical strength scores from 0-100
Structure Labels : HH/HL/LH/LL with trend context (optional)
Bar Coloring System
Market Sentiment Coloring : Based on sentiment oscillator position and momentum
Extreme Conditions : Special coloring for extreme overbought/oversold conditions
Momentum Swing Coloring : Alternative coloring based on momentum analysis
Advanced Visual Features
Wave Event Labels : Comprehensive event display within pivot labels
Trend Context : Dynamic trend identification and display
Strength Breakdown : Detailed tooltips showing strength components
Custom Coloring Modes : Standard vs trend-based coloring options
Alert System
Core Alert Types
Validated High Confirmed : When red wave validates ultimate high with full context
Validated Low Confirmed : When green wave validates ultimate low with full context
Trend Change Detected : When structure analysis detects trend shifts
Alert Message Structure
Each alert includes:
Timeframe identification
Signal type (BULLISH/BEARISH)
Structure context (HH/HL/LH/LL)
Strength score with 💪 rating
Exact price level
Wave events context (if enabled)
Setting Up Alerts
Enable desired alert types in indicator settings
Focus on "Confirmed Extremes" alerts for quality
Enable wave events for comprehensive context
Test alerts on historical data first
Set up multiple notification methods
Risk Management Framework
Strength-Based Position Sizing
Strength 90-100 : Maximum position size (3-5% risk)
Strength 75-89 : Large position size (2-3% risk)
Strength 60-74 : Standard position size (1-2% risk)
Strength 45-59 : Small position size (0.5-1% risk)
Below 45 : Avoid or minimal size (0.25% risk maximum)
Stop Loss Guidelines
Primary Method : Always use validated pivot levels for stops
Buffer Method : Add small buffer beyond validation level
Multiple Timeframe : Consider higher timeframe validated levels
Wave Event Context : Adjust stops based on event confluence
Risk-Reward Optimization
Minimum R:R : 1.5:1 for all trades
Preferred R:R : 2:1 or better for strength above 70
Exceptional Setups : 3:1+ for strength above 85
Position Management : Take 75% at TP1, 50% of remaining at TP2, close remaining at TP3
Stop Management : Move stop to breakeven after TP1 execution
Best Practices
Signal Quality Assessment
Always wait for validated pivots with ✓ checkmarks displayed on chart
Prioritize strength ratings above 60 for trade quality
Focus on the validated high/low levels rather than underlying calculations
Consider HH/HL/LH/LL structure labels for directional bias
Use ZigZag line connections to understand market structure flow
Entry Timing Optimization
Enter on validation bar or immediate pullback to validated level
Use lower timeframes for precise entry refinement around validated levels
Wait for strength score calculation completion before entry
Monitor price action around validated highs and lows
Consider multiple timeframe validated level alignment
Exit Strategy Management
Use opposite validated pivots displayed on chart as primary targets
Execute Fundur 3-stage exit: 75% at TP1, 12.5% at TP2, 12.5% at TP3
Move stop loss to breakeven immediately after TP1 execution
Monitor strength ratings of new validated levels that could reverse remaining position
Watch for structure changes (trend breaks) via HH/HL/LH/LL labels for early exit consideration
Common Mistakes to Avoid
Signal Interpretation Errors
Don't trade potential turns without ✓ validation markers
Never ignore strength ratings below 45 - they indicate weak signals
Don't chase signals after significant movement away from validated levels
Avoid overriding clear ZigZag structure and trend context
Don't ignore the relationship between consecutive validated highs and lows
Risk Management Failures
Never risk more than the strength score suggests for position sizing
Don't move stops against validated levels - they represent key structure
Avoid oversizing on "sure thing" setups - even high-strength signals can fail
Don't ignore multiple timeframe validated level context
Never trade without clear invalidation levels (validated highs/lows for stops)
System Usage Mistakes
Don't enable all features immediately - start simple
Avoid changing speed settings mid-session
Don't ignore alert system capabilities
Never disable core validation features
Don't overlook customization for your chart setup
Advanced Techniques
Multi-Timeframe ZigZag Analysis
Use higher timeframe validated levels for major bias and targets
Align lower timeframe entries with higher timeframe validated structure
Look for validated level confluence across timeframes
Monitor strength rating consistency of validated levels across periods
Advanced Structure Pattern Recognition
Identify recurring validated level patterns and their outcomes
Recognize high-probability ZigZag structure sequences
Use historical validated level patterns for target projection
Combine ZigZag analysis with other Fundur technical analysis tools
Advanced Alert Utilization
Create custom alert combinations based on strength thresholds
Use validated level break alerts for position management
Combine strength rating filters with validated pivot alerts
Develop systematic responses to different validated level types
Conclusion
The Fundur - Market Sentiment A indicator represents a breakthrough in technical analysis, providing a dynamic ZigZag system that displays validated highs and lows with unprecedented accuracy. By following the methodologies outlined in this guide and adapting the settings to your trading style, you can harness the full power of this sophisticated system for more precise and profitable trading decisions.
The key to success with Market Sentiment A lies in understanding that it is fundamentally a dynamic support and resistance system. Focus on the validated highs and lows displayed on your chart, use the strength ratings to assess signal quality, and leverage the structure analysis for trend context. Start with conservative settings, focus on high-strength signals, and gradually incorporate advanced features as you become familiar with the system's behavior across different market conditions.
Remember that this indicator provides the tools for identification and analysis - successful trading still requires proper risk management, psychological discipline, and continuous learning. Use the strength rating system as your primary guide, respect the validated pivot methodology, and always prioritize capital preservation over profit maximization.

PivotBox by Nadeem Al-QahwiPivotBox by Nadeem Al-Qahwi
General Idea of the Indicator: The PivotBox indicator is an advanced technical analysis tool designed to identify key reversal points in the market based on pivot highs and pivot lows. The indicator helps traders to detect breakout and breakdown opportunities based on past price movements, guiding informed trading decisions.
Indicator Functions:
Key Reversal Points (Pivot Points):
The indicator identifies pivot highs and pivot lows over a user-defined period, helping traders spot significant price levels in the market.
These points are plotted on the chart, showing where market reversals may occur.
Breakouts and Breakdowns:
The indicator identifies breakouts when the price moves above a pivot high or breakdowns when the price falls below a pivot low.
Once these breakouts or breakdowns are detected, the indicator draws lines indicating the critical price levels for visual reference.
Trend Levels using Zero-Lag MA:
The indicator includes an option to add a Zero-Lag Moving Average (Zero-Lag MA) to display the overall trend in the market. This moving average helps filter out noise and identify the general market direction, improving trade decision-making.
Line Styles:
The pivot points (highs and lows) are displayed using different line styles, such as solid, dashed, or dotted lines. The user can customize the style based on their preference.
These lines represent the breakouts or breakdown levels in the market.
Alerts:
The indicator can activate alerts when a breakout or breakdown occurs. Users can customize the alerts to notify them when specific conditions are met, ensuring that they do not miss significant price movements.
Input Variables:
Period (prd): The time period over which the pivot highs and lows are calculated. The user can define this period based on their trading strategy.
Max Breakout Length (bo_len): The maximum time duration for a breakout or breakdown to occur. This variable helps determine the relevance of the price movement.
Threshold Rate (cwidthu): The width percentage that helps to define the price area for breakouts and breakdowns.
Line Style (lstyle): Allows the user to choose the style of lines used to display the pivot points (solid, dashed, or dotted).
Minimum Number of Tests (mintest): The minimum number of tests required before a breakout or breakdown is considered valid.
How the Indicator Works:
The indicator first calculates the pivot highs and lows based on the user-defined period (Period).
It then tracks price movements to detect if a breakout or breakdown occurs.
When a breakout or breakdown is confirmed, the indicator draws lines at these levels and shows the user the new price direction.
Alerts can be triggered based on predefined conditions such as when a breakout or breakdown occurs.
The Zero-Lag MA helps the user visualize the trend, adding another layer of analysis to the market movements.
Key Benefits:
Accurate Reversal Point Analysis: Helps traders identify key entry and exit points based on precise technical analysis.
Breakout and Breakdown Detection: Allows traders to spot breakout and breakdown opportunities in real-time.
Customizable Alerts: Users can set up alerts to notify them when a breakout or breakdown happens, ensuring they don't miss important market moves.
Flexible Customization: The indicator offers various options to customize the display (line styles, alerts, trendlines), catering to different trading strategies.

Average Candle Size (Points)ATR but with the ability to add threshold lines (UP TO 3) that help gauge how volatile the market is. Also, note that the default threshold values are set up for NQ Futures so you will need to change your values to your specific needs.

MATHR3E LINES█ OVERVIEW
MATHR3E LINES automatically draws Demand lines and Supply lines with their associated targets
█ CONCEPTS
Disclaimer:
MATHR3E LINES indicator is intended for advanced traders and may fit your profile, whether you are a day trader or a long-term investor.
It was originally developed by a renowned market analyst and documented in numerous books. Among them is the author Jason Perl.
It is recommended to have read the trading techniques mentioned in the books covering this indicator beforehand.
How to use:
The indicator draws Demand lines and Supply lines with their associated targets.
These lines connect pivot points which are:
- Lows surrounded on either side by higher lows
- Highs surrounded on either side by lower highs.
The key to drawing trend lines objectively is to select the right pivot points. Their significance is determined by the number of surrounding highs and lows.
By default, these are set to 1 since they are more sensitive to price action than higher level pivot points, and therefore provide an earlier breakout signal.
Another approach suggests that the most significant points to connect are those whose levels coincide with trend reversals.
Once you have chosen a demand line, there are 3 conditions that must be met for the trend line to be used.
As far as one or more of the conditions is met, a break of the intrabar trendline is expected, and a closing violation above the breakout level is likely.
Qualifiers
• Qualifier #1: Reverse Break
• Qualifier #2: Gap Break
• Qualifier #3: Pressure Break
In turn, a confirmed breakout entry may be invalidated the following bar, if any of the disqualifying conditions occur:
Disqualifiers
• Open Failure
• Close Failure
• H/L Failure
█ FEATURES & BENEFITS
Versatile:
This indicator can be applied to any market or time frame.
The methodology is equally relevant whether you are day trading or position trading.
Breakout confirmation:
• If a breakout is confirmed, its associated lines will turn solid.
• Otherwise, for invalidated breakouts or broken trendlines , they will remain dashed
Alerts
Get notified on:
•Demand/Supply Line Confirmed Breaks
•Demand/Supply Invalidated Breaks
•Demand/Supply Target Reached

Support & Resistance Trendlines with PP + Fib. Channel█ Support & Resistance Trendlines with Pivot Points + Fibonacci Channel
This script automatically draw support and resistance trend lines based on pivot points and add a fibonacci channel.
It will show potential patterns with the help of support and resistance lines as well as breakout target and pullback entry with the fibonacci extension and retracement levels.
It is based on atolelole's script, I only made it more configurable so please check out his script.
I added the possibility to change values and add additional retracement and extension levels.
I also made it customizable with the possibility to change lines color, width and style.

MapMap - an indicator that shows the highest and lowest points on the price movement road.
The calculation is based on the type of price data specified in the "Source" parameter and the length of the time interval specified in the "Length" parameter.
The indicator helps to visually find a local trend and rebound points.
Thanks for your attention!

Unraided Liquidity and S/R PivotsThis indicator is designed to show key pivot points, also known as levels, which could provide good trade entries.
Utilising liquidity concepts, untested pivot levels can be a good place to enter a trade after the pivot is tested, liquidity is taken and the direction reverses.
Alternatively, utilising the option of viewing already tested levels, you can easily see the key support and resistance areas that price is likely to have a strong reaction to, whether it wants to go toward or bounce away from these levels.
The indicator does not give buy and sell signals, it is up to you to use the levels to form your trading plan.
Oorah.

Pivot Order Blocks// How it Works \\
Order Blocks based on pivot reversal candle
When a pivot High or Pivot Low is found and confirmed, a box will be plotted on the open and close values of that pivot candle
// Settings \\
In the settings you have the ability to change the distances required to confirm an pivot High or Low
These are the lengths where the script checks to see if it is at its local high or low.
You also have the ability to change the amount of candles the box stretches over as well as the colors of the bullish and bearish boxes
// Use Case \\
Pivot points often provide Support and Resistance points on their own,
one way of marking up order blocks is by taking the pivot candle and marking that up as a resistance area where you could be looking for price to reverse
// Suggestions \\
Happy for anyone to make any suggestions on changes which could improve the script,
// Terms \\
Feel free to use the script, If you do use the script could you please just tag me as I am interested to see how people are using it. Good Luck!

Pivot Points High Low MTF [Anan]█ OVERVIEW
Pivot Points High Low with Multi Time Frames support and bull/bear signal depends on pivot average
█ FEATURES
- Fully control of pivot (Source / Length Left / Length Right)
- Show HH, LL, LH, HL price on candles
- Show Avg Pivot High Low.
- Show Bull/Bear Labels.
- Control of signal accuracy (default: 0.5%)
- Show Pivot High Low Levels as a Fractal Chaos Channel.
- Multi-timeframe Table with support of Pivot High Low and pivot Average.
- BreakOut and BreakDown Labels in the table.
- Full control of displaying any row or any column.
- Full control of Table position and Size and Colors.

Logging in Pine ScriptI'm building quite a lot of pretty complicated indicators/strategies in Pine Script. Quite often they don't work from the 1 try so I have to debug them heavily.
In Pine Script there are no fancy debuggers so you have to be creative. You can plot values on your screens, check them in the data window, etc.
If you want to display some textual information, you can plot some info as labels on the screen.
It's not the most convenient way, so with the appearance of tables in Pine Script, I decided to implement a custom logger that will allow me to track some useful information about my indicator over time.
Tables work much better for this kind of thing than labels. They're attached to your screen, you can nicely scale them and you can style them much better.
The idea behind it is very simple. I used few arrays to store the message, bar number, timestamp, and type of the message (you can color messages depend on the type for example).
There is a function log_msg that just append new messages to these arrays.
In the end, for the last bar, I create the table and display the last X messages in it.
In parameters, you can show/hide the entire journal, change the number of messages displayed and choose an offset. With offset, you can basically scroll through the history of messages.
Currently, I implemented 3 types of messages, and I color messages according to these types:
Message - gray
Warning - yellow
Error - red
Of course, it's a pretty simple example, you can create a much fancier way of styling your logs.
What do you think about it? Is it useful for you? What do you use to debug code in Pine Script?
Disclaimer
Please remember that past performance may not be indicative of future results.
Due to various factors, including changing market conditions, the strategy may no longer perform as good as in historical backtesting.
This post and the script don’t provide any financial advice.

Percentage Or Point Bar CalculatorHello Everyone This Indicator Base on Bar (Candle)
How to work its indicator?
➤This indicator calculating Every Bar Percentage Or Point with any Time Frame For eg: if you want to 50 Percentage above or below bar
Indicator Feature
➤ Long Signal with Alert
➤ Short Signal with Alert
➤ You can add Custom Point
➤ You can add Custom Percentage
Coming soon Feature
Take Profit
Stop Lose
Trailing Stoplose
Important: This Indicator we are using for Automation Trading if You Want This Indicator Access, Please Contact me PM on Tradingview

Pocket PivotPockets Pivot were introduced by Gil Morales and Chris Katcher in the book "Trading like an O'Neil Disciple",
Pocket Pivot day occurs when the Volume has been higher than any down day 10 days prior and with a positive close.
Here is shown 5 days Pocket Pivots and 10 Days Pocket Pivots

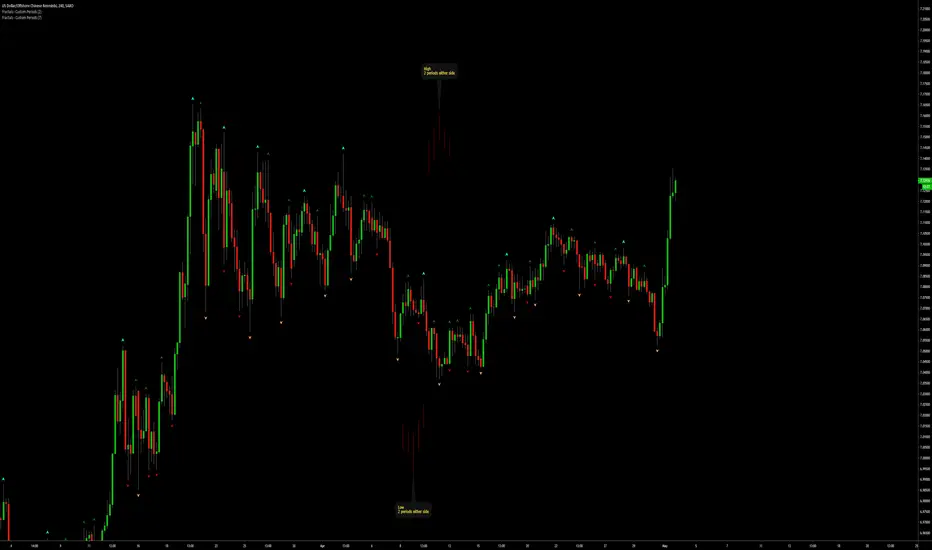
Fractals | Swing Points | Highs & Lows | Custom PeriodsSimple script which marks out key swing highs & lows.
One of the only indicators I have on the chart most days
- perfect for naked charting
- quickly helps you to visually identify key areas of interest
An extension of Bill Williams fractals
- aka short term swing points
Allows you to filter for only the most prominent swing points
- you can even overlay multiple swingpoint filters in different colours (as per example chart)
The number ( Fractal Periods) is simply:
- the number of less prominent points either side of your swing high/low
- example shown on the chart
Otherwise make a fist
- look at your 5 knuckles
- swing high is your middle knuckle
- 2 lower points either side
Bill Williams Original Fractal:
Fractal Periods = 2
Your Fractal Period for Filtering:
3, 4, 5, 30, 365, etc
Allows you to find swing points down to:
Fractal Periods = 1
Simple, easy, shared to enjoy =)

Fractals | Swing Points | Highs & Lows | Custom PeriodsSimple script which marks out key swing highs & lows.
One of the only indicators I have on the chart most days
- perfect for naked charting
- quickly helps you to visually identify key areas of interest
An extension of Bill Williams fractals
- aka short term swing points
Allows you to filter for only the most prominent swing points
- you can even overlay multiple swingpoint filters in different colours (as per example chart)
The number (Fractal Periods) is simply:
- the number of less prominent points either side of your swing high/low
- example shown on the chart
Otherwise make a fist
- look at your 5 knuckles
- swing high is your middle knuckle
- 2 lower points either side
Bill Williams Original Fractal:
Fractal Periods = 2
Your Fractal Period for Filtering:
3, 4, 5, 30, 365, etc
Simple, easy, shared to enjoy =)
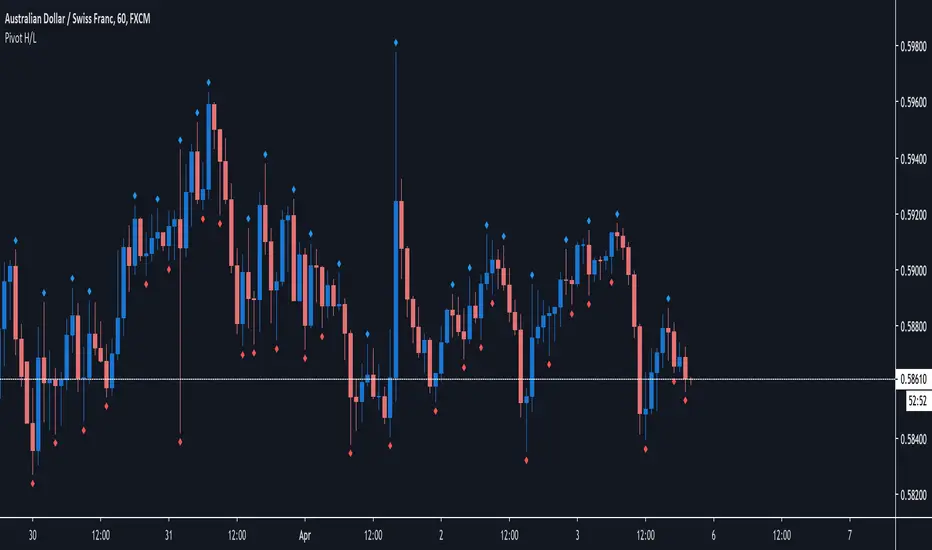
Pivot H/LPivot high low based on 3 candles. Pivot low= low->lower low->higher low. Pivot high = high->higher high> lower high.
That shows me referal points where i would like to setup stop loss.
It also shows me trend or rotation and supports and rezists.
Chonky Pivot Pointsstandard pivot points re-written with circle plots.
Only shows the current pivot points. P, R1/R2, S1/S2
I don't use R3, R4 etc. so I didnt include them but feel free to modify the code.
You can change the resolution in indicator settings, default is set to Monthly.
Also to change the size of the circles all at once, you can input a number 1-4 in the inputs section.
