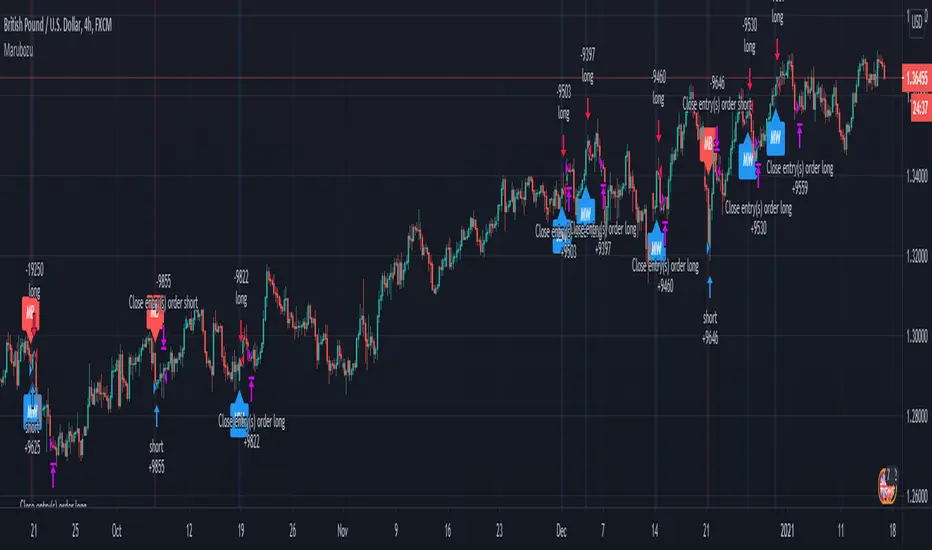
Marubozu Forex Price actionHi, today I bring you a price action strategy/indicator for Forex, made out for Marubozu candle type.
For the entries of it check if we have a long or a short marubozu.
For exit we have for long when the actual candle is green and the last previous two were red.
For exit we have for short, when the actual candle is red and the last previous two were green.
If you have any questions private message me !
Priceaction
Amazing strategy for silver -XAGUSD, XAGEUR etcToday I bring an amazing strategy that works for 1h time frames for silver.
Its made of price actions movement combined together with MACD and simple moving average
It does not use neither stop loss/take profit levels. Instead it will always exit at the next candle after it opens a trade.
The rules are the next one :
For short condition : we have a bull candle, and candle is above the moving average, and MACD histogram is > 0 and last high0 and candle close > last high1 and, previus high1 and candle close > last high2
At the same time, viceversa for long condition.
In development terms, this is the formula
long1 = (close > open ) and time_cond and close > out and hist > 0 and hist > hist and high > high and high > high and close > high and close > high and close > high
short1 = (close < open) and time_cond and close < out and hist < 0 and hist < hist and low < low and low < low and close < low and close < low and close < low
But when we enter the trade, we enter in reverse, like lets say we go long -> for this we apply the short1 condition. If we go short we apply the long1 condition.
If you have any questions , please let me know .

BANKNIFTY - PRICE ACTION TRADING SYSTEM (BackTestable + Alerts)This study is based on several Price Action parameters of :-
• Candle Pattern,
• Supply Demands,
• Support and Resistance ,
• Breakouts.
► How To Use This Study ?
• Suitable Trade Session for this study 10:15 AM to 02:30 PM ( UTC +05:30)
• Buy Whenever a Up Arrow Appears on Chart with text "TYPE: LE".
• Sell Whenever a Down Arrow Appears on Chart with text "TYPE: SE".
• Exit Buy Whenever a Down Arrow Appears with text "TYPE: LX" After A Buy call and Exit Sell Whenever a up Arrow Appears with text "TYPE: SX" After A Sell Call.
• Take Only 1 trade Per Trading Session.
Backtest Values Used:-
Initial Capital : 1000000
Order Size (Lots) : 1 (Contract) Lots
Pyramiding : 0 orders
Commission : 0.001%
Test Yourself and give feedback.
PM us to obtain access.

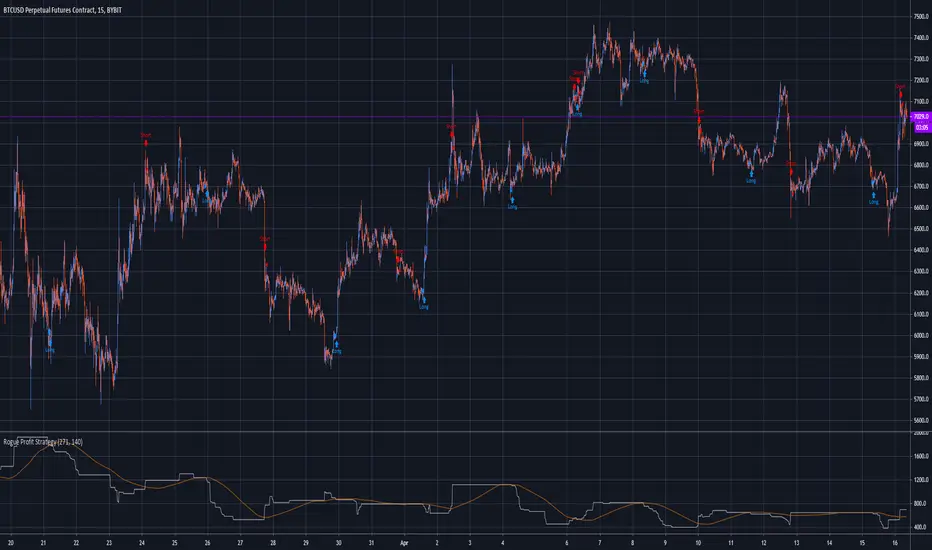
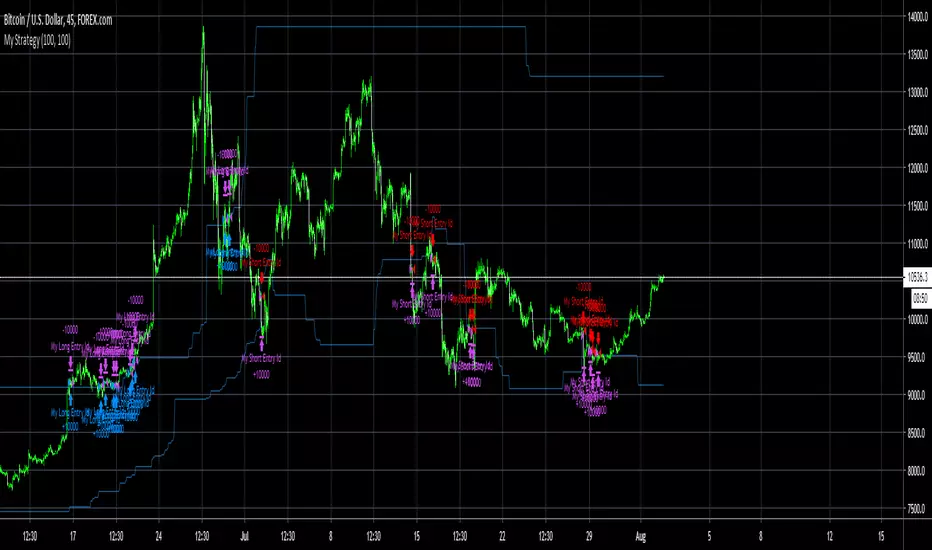
Rogue Profit StrategyThis is a complex script developed to measure specific volatility parameters and enter trades based on predetermined rules which are proprietary and will not be released, so don't ask for specific strategy settings.
The strategy keeps you in the market at all times either long or short. Parameters can be changed to better suit the asset your are trading, time frame and your particular trading style but the overall volatility rules for entering and exiting remain the same. It can be used to trade any asset but be aware the parameters you use for one asset, lets say Bitcoin, will not work with another asset like Forex. If the asset is on TradingView, you can use this indicator to trade it.
It is meant to trade pure price action candlesticks so do not use anything but a typical candlestick chart. You are going to have to put in some work and play around with the input parameters to make this strategy the most profitable for your trading style. Trading is hard but hopefully this strategy will help flatten the learning curve. This strategy is accompanied by an indicator study named "Rogue Profit Alert Indicator" that will work with setting alerts for manual or automated trading.
This strategy does NOT repaint.
This is a very powerful and profitable script that will simplify your trading and has been in development and tested for three years. Message for details on how to obtain access. Please allow up to 24 hours for a response.
Pure Price ActionThis is a little trade bot for BTCUSD on the daily chart. I won't give away the specifics, but it's mainly based on price action derived from candle stick analysis. With some tweaks it also works on the weekly and monthly, but on lower timeframes than daily the performance drops quite siginifcantly.

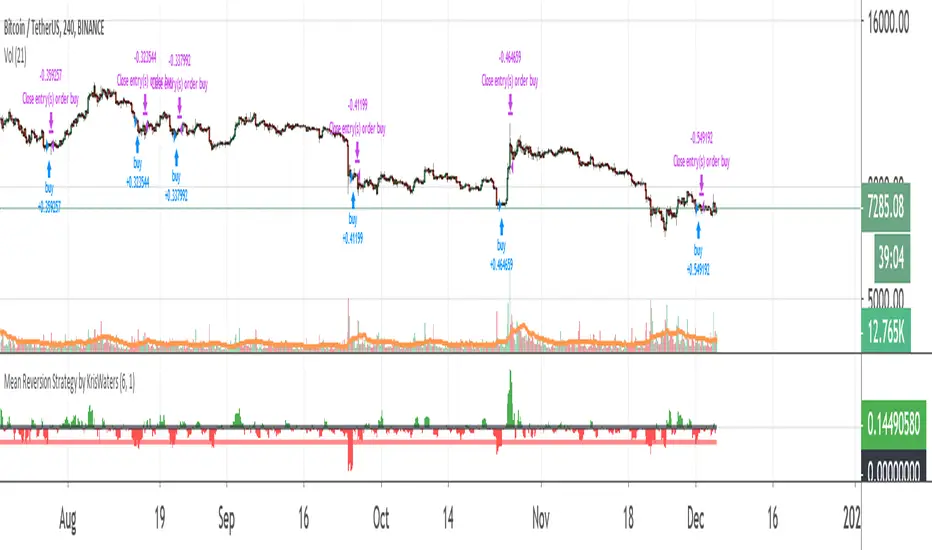
Mean Reversion Strategy by KrisWatersThis is a type of mean reversion strategy. It only generates long signals when the price is far away from the mean. It tries buy from the dip. Use it with BTC/USDT pair on 4 hour timeframe.
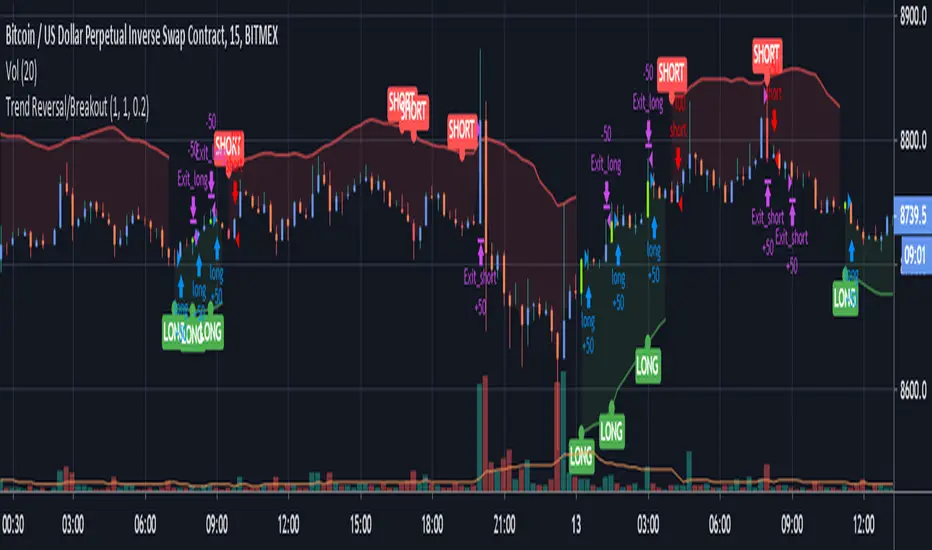
Trend Reversal/BreakoutThis is an strategy for trading low timeframes. It have better performance on 15min XBTUSD after parameter optimization.
It is generic and configurable meaning you can use it not only on XBT, but alos ETH, LTC etc.
Automatic trading can be achieved if used in conjunction with alert and webhook .
It does not repaint! Try it by yourself!!
Bearish&Bullish Engulfing (created by LucaBono)Questo indicatore (o price action pattern) stampa sul grafico delle frecce o barre colorate (modificabili dalle impostazioni) quando si verificano entrambi i segnali del Bearish e Bullish Engulfing ufficiali, ovvero quando il corpo della candela è più ampio dell'intera candela precedente.
Il segnale LONG si effettua quando il massimo della Bullish bar viene rotto dalla candela successiva.
Il segnale SHORT viceversa si effettua alla rottura del minimo.
E' più facile trovare questo tipo di segnali su timefrime giornaliero e mercati come azioni, futures e titoli che non stanno aperti 24h.
Consiglio sempre di accompagnare questi segnali ad altri tipi di segnali o analisi per maggiorare le probabilità di successo e di tenuta del trade.
This indicator (or price action pattern) prints on the graph arrows or colored bars (which can be changed from the settings) when both official Bearish and Bullish Engulfing signals occur, ie when the body of the candle is wider than the entire previous candle.
The LONG signal is made when the maximum of the Bullish bar is broken by the next candle.
The SHORT signal, on the other hand, is performed when the minimum is broken.
It is easier to find this type of signals on daily timefrime and markets like stocks, futures and stocks that are not open 24h.
I always advise to accompany these signals to other types of signals or analyzes to increase the chances of success and stability of the trade.

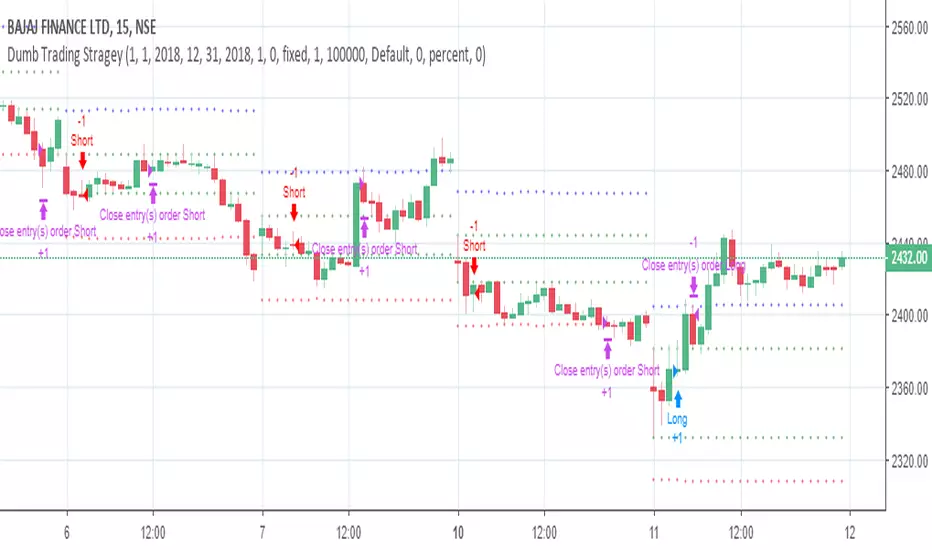
Naresh - iJPASIMPORTANT NOTE
This strategy has been developed as a professional service. It was published only or testing and verification by the customer. As such, access cannot be granted to anyone else. Sorry about that!
Other open source scripts are available on the BacktestRookies profile.
Intra-day Japanese Candlestick Price Action Strategy
An intraday strategy which focuses on analyzing price action of the opening 3 bars to make trading decisions.
Once certain criteria are met, entry and exit targets are set and left until they are hit else we reset and start again on a new day.

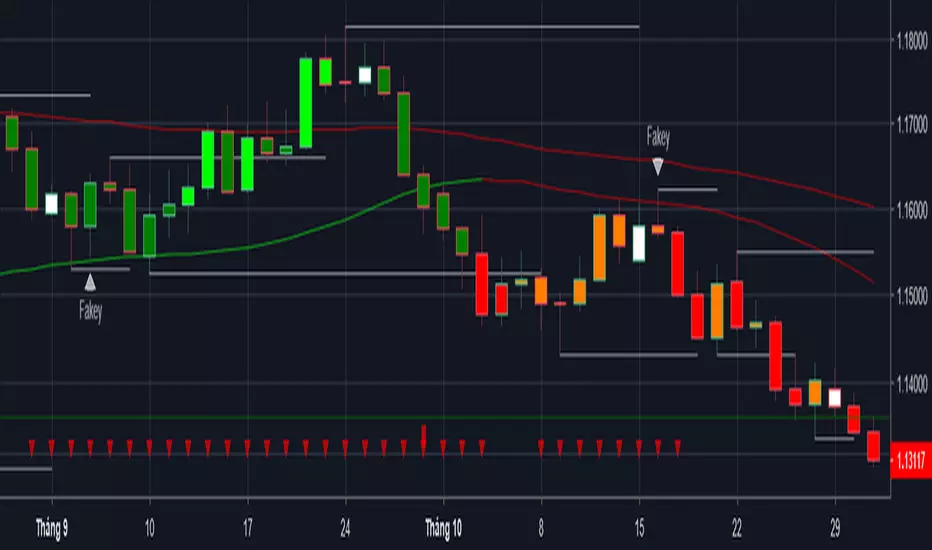
Price Action with MACD Barcolor + Insidebar + Fakey + Key level EMA 89 and Hull MA 89 used to filter trading signals and working as support and resistance.
When both of them are red, market is bearisk, only short.
When both of them are green, market is bullish, only long.
when there is 1 green and 1 red, market is neutral, can short or long.
Enjoy and happy trading!
You can follow me there: www.facebook.com you are welcom!
PRICE ACTION VIGORThis is the first of my RENKO strategies and studies series.
I'm developing some studies on Renko charts from a while and now is time to share the results.
This startegy is based on this idea: to measure the "vigor" or strength of a price action and to follow it.
I use Renko charts to identify the price action.
The indicator will rise or fall when a price action starts and it is flat at half of this movement.
Time frame should be 1 minute but I would need a premium account to have RENKO charts with one minute.
The most important point for this strategy is to set the correct brick size for each symbol.
Look in the result how you could obtain starting with a 1000€ account in just few months.
I have also a study with alerts so one could use autoview for automated trading. If you are interested to use it, follow me and add a comment.
Please use comment section for any feedback.
********************************** IMPORTANT*******************************
I have developed an expert advisor for metatrader4 (MT4) and for jforex platform: results of expert advisor form 2015-01-01 to 2018-11-25 are very good with low drawdown and good profit.
********************************************************************************

Taribo EMA StrategyIt is a simple script that take price action and EMA 13 crossovers to give visual buy and sell signals which works on all timelines.
Sample Chart:

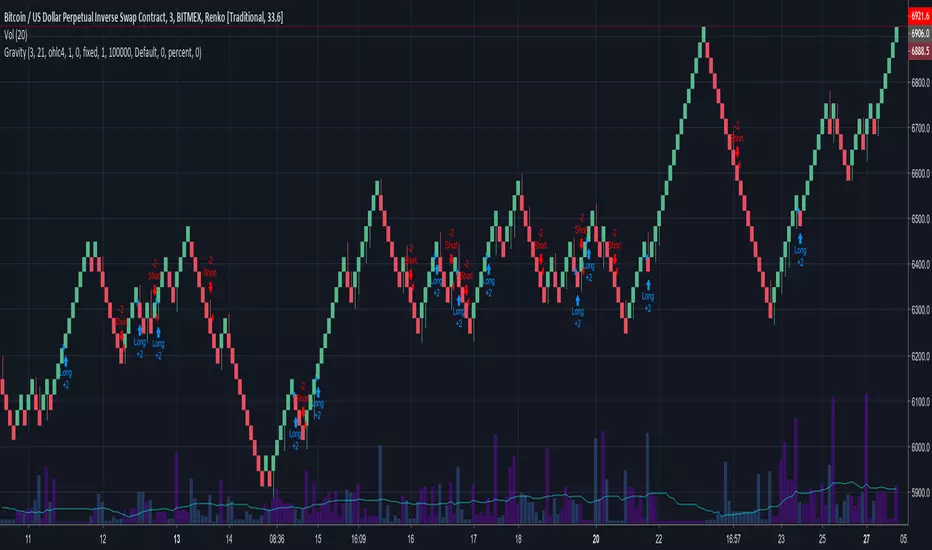
GravityBuys and sells make relative ripples in the market that can be leaned into for the trader's advantage. In order to get the most out of these ripples we need to consider space (price) as much as time. Renko charts with traditional box sizes (representing about a 0.4% move) can help us to achieve this.
This strategy is a drop in the cosmic bucket compared to what's out there, but it can help anyone who's lost money between January and now.
For traders who are looking for more of an edge, visit here:
Enjoy!
Best Parabolic SAR Study and StrategyCustom built Parabolic Stop and Reversal (SAR)
Produces more responsive results.
Also included is an ATR based SAR which better indicates trend.
Long and short stops are marked on the chart and can be found in the style tab.
PSAR source is variable and is shown on the chart.
Trading source is variable, this is what is used to determine a change in direction against the calculate PSAR and for stops/reversals.
Access is open for now so long as I am getting constructive feedback. Thanks for trying it out!

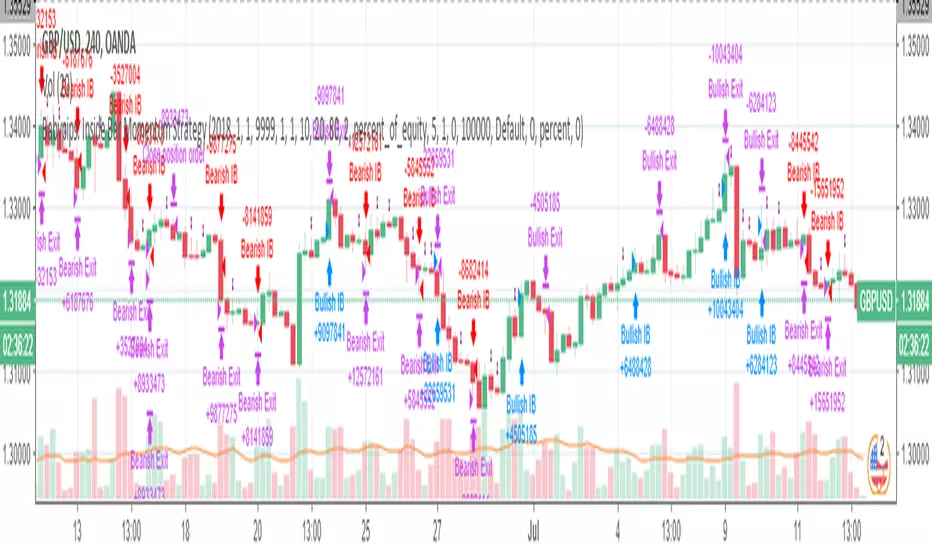
Babypips: Inside Bar Momentum StrategyThe strategy contained in this post comes courtesy of babypips (.com), an excellent resource for all thing forex related. If you are new to trading, the site is definitely worth checking out!
Code commentary and an introduction to Inside Bars are available for this post on the Backtest-Rookies (.com) website.
Note: If you are interested in custom development services, please check out our services page on the Backtest-Rookies site.
Strategy Overview
Inside Bar Momentum Strategy.
Inside Bar Detection
Position sizing based on stoploss distance ( Note: Based on equity and assumes that the account currency is the counter currency.
Stop buys for entries
Takeprofit / Stoplosses for exits
Control Stopbuy, Takeprofit and Stoploss targets with inputs
Control Backtest start/end dates
[NG] Strategy: CryptoMine - v1 - Low Drawdown - Beats Buy&Hold!So, I created this strategy that works on BTCUSD 0.28% pair along with almost all ALT-BTC pairs, and ALT-USD pairs (i.e. the cryptosphere). Here are some of the considerations I had when creating this script:
- Should work on BTCUSD 0.28% , along with most ALT-BTC and ALT-USD pairs without modifying strategy parameters for individual pairs.
- Should work with several timeframes, esp -0.67% . 15m-4hr timeframes. Better if the parameters are adjusted for these timeframes, automatically.
- Should have a small MaxDrawdown. Arguably <50% for cryptos.
- Should beat buy and hold profits for the pair.
- Should have multiple modes for switching between: Higher Returns vs Lower Drawdowns, multiple Long/Short versions - one which allows me to do margin trading by using the short calls (so, LONG, SHORT and FLAT), and another one where I can use the short calls by exiting out of the market and entering when the short call ends (so, LONG and SHORT only).
- Should have proper risk management built-in. Moreover, TakeProfit and StopLoss will be defined at a fixed 20% each, which is reasonable for crypto markets. Most strategies I see on tradingview fail on this count.
After several weeks of building such a script, and testing it successfully on multiple pairs - here are the results. :)
ETHBTC
=======================================================================================
Mode 1 (LONG and SHORT only)
--------------------------------------
First Trade: 2015-08-10 09:30, Final Profit: 1474649.65%, Drawdown: 66.21%, PF: 2.149, Trades: 1059
--------------------------------------
Mode 2 (LONG, SHORT and FLAT positions)
First Trade: 2015-08-14 05:30, Final Profit: 715274.55%, Drawdown: 36.34%, PF: 2.806, Trades: 589
BTCUSD 0.28%
=======================================================================================
Mode 1 (LONG and SHORT only)
--------------------------------------
First Trade: 2015-01-03 21:30, Final Profit: 28944.04%, Drawdown: 44.87%, PF: 1.353, Trades: 1222
--------------------------------------
Mode 2 (LONG, SHORT and FLAT positions)
First Trade: 2015-01-11 13:30, Final Profit: 22522.28%, Drawdown: 27.77%, PF: 1.877, Trades: 669
NANOBNB
=======================================================================================
Mode 1 (LONG and SHORT only)
--------------------------------------
First Trade: 2018-02-04 23:30, Final Profit: 365.5%, Drawdown: 39.4%, PF: 1.967, Trades: 51
--------------------------------------
Mode 2 (LONG, SHORT and FLAT positions)
First Trade: 2015-01-11 13:30, Final Profit: 236.91%, Drawdown: 25.62%, PF: 3.692, Trades: 25
NOTE: I will not be sharing access to this script, since market saturation is a real thing. Send me an email at menikhguptacom - if you are really interested in this script.

Jeremy: Candle StrategyPrice action strategy developed for a Backtest Rookies service customer. Published for verification and acceptance.
Please visit the Backtest Rookies website if you are interested in Development services
Features
Hammer / Hanging man candle detection with variable inputs
2 position entries
2 different SL and TP ratios
Custom position sizing algorithm
Move the second position to break even once the first take profit is hit

Critical Level Hybrid Strategy (private beta)*This is a private beta version. Public version coming soon.*
-This strategy is based off the MTFCLM indicator, and Kaufman Adaptive Moving Averages.
-Perform in-depth technical analysis within seconds.
-Buy and sell signals, plus custom alert script included.
Note: To see the most accurate levels displayed on the screen, refresh your chart whenever new levels are drawn.

