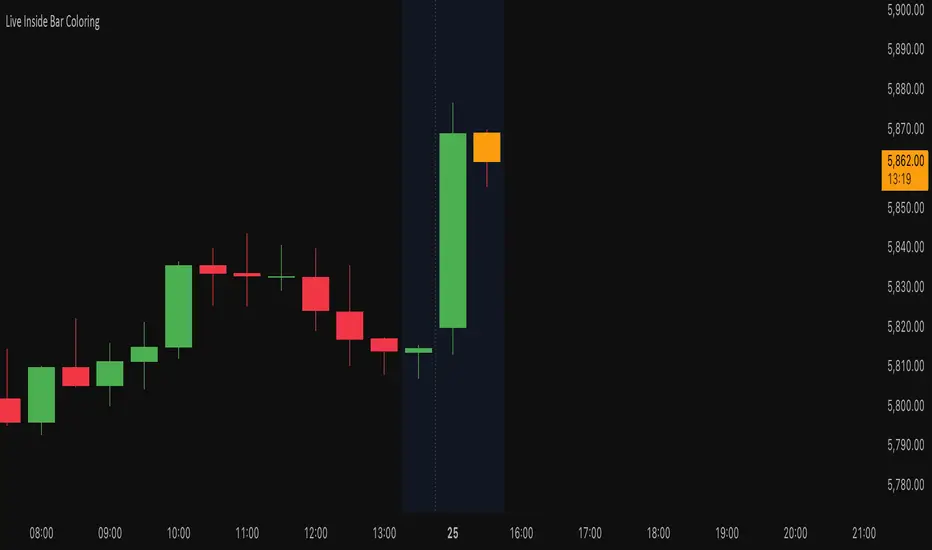
Price Ranged FVG📌 Price Ranged FVG
Is a clean and efficient tool designed to detect Fair Value Gaps (FVGs) with adjustable filters and structural context. It’s especially useful for traders looking to filter out insignificant gaps and focus on high-probability areas, particularly around swing breaks or structural shifts.
🧠 What is a Fair Value Gap (FVG)?
A Fair Value Gap appears when there’s a price imbalance between candles — typically after a strong move — where the market skips over certain price levels without trading there. These zones can act as potential areas for price to return to (mean reversion), or serve as support/resistance depending on market structure.
🔍 FVG Detection Types
You can choose between three different detection modes under the "FVG Detection" input:
Same Type: Only detects FVGs where the last 3 candles are in the same direction (all bullish or all bearish).
All: Detects any FVG, regardless of candle direction.
Twin Close: Detects FVGs only when the last two candles are in the same direction and close accordingly — offering a stricter confirmation.
🎯 FVG % Filters
To filter out noise or insignificant gaps, this indicator includes:
Minimum FVG % Filter: Ignores FVGs smaller than your specified percentage of the current close.
Maximum FVG % Filter: Ignores overly large gaps that may be unreliable or caused by anomalies.
These filters help focus on relevant FVGs that are more likely to act as reaction zones.
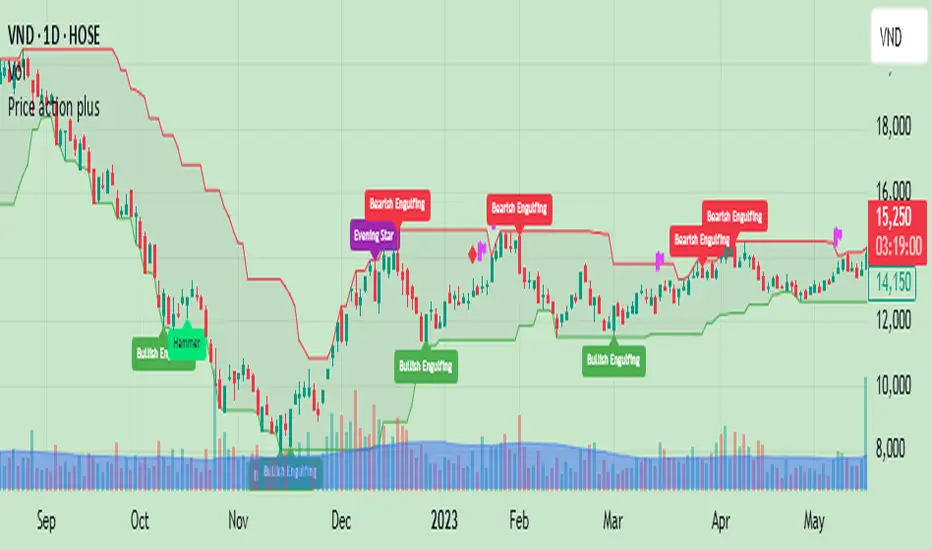
🏛 Structural Context (Swing Highs and Lows)
The indicator plots swing highs and swing lows with dots to provide structure-based context:
Set Swing Strength to 3 for detecting internal structure (shorter-term moves).
Use a higher setting like 5 to focus on external structure (more significant highs/lows).
These levels can help you determine whether an FVG is forming within a consolidation, breakout, or key structural transition.
✅ Use Case (My Personal Workflow)
I personally use this indicator to:
Filter out weak or irrelevant FVGs using the % filters.
Watch for price interaction at swing breaks — especially when an FVG aligns with a break in internal or external structure.
Refine entry and exit planning in confluence with other tools or strategies.
⚠️ Disclaimer
This indicator is not financial advice. It is a technical analysis tool intended to support your own decision-making process. Always do your own research and risk management.
Pine Script® indicator