3D Candles (Zeiierman)█ Overview
3D Candles (Zeiierman) is a unique 3D take on classic candlesticks, offering a fresh, high-clarity way to visualize price action directly on your chart. Visualizing price in alternative ways can help traders interpret the same data differently and potentially gain a new perspective.
█ How It Works
⚪ 3D Body Construction
For each bar, the script computes the candle body (open/close bounds), then projects a top face offset by a depth amount. The depth is proportional to that candle’s high–low range, so it looks consistent across symbols with different prices/precisions.
rng = math.max(1e-10, high - low ) // candle range
depthMag = rng * depthPct * factorMag // % of range, shaped by tilt amount
depth = depthMag * factorSign // direction from dev (up/down)
depthPct → how “thick” the 3D effect is, as a % of each candle’s own range.
factorMag → scales the effect based on your tilt input (dev), with a smooth curve so small tilts still show.
factorSign → applies the direction of the tilt (up or down).
⚪ Tilt & Perspective
Tilt is controlled by dev and translated into a gentle perspective factor:
slope = (4.0 * math.abs(dev)) / width
factorMag = math.pow(math.min(1.0, slope), 0.5) // sqrt softens response
factorSign = dev == 0 ? 0.0 : math.sign(dev) // direction (up/down)
Larger dev → stronger 3D presence (up to a cap).
The square-root curve makes small dev values noticeable without overdoing it.
█ How to Use
Traders can use 3D Candles just like regular candlesticks. The difference is the 3D visualization, which can broaden your view and help you notice price behavior from a fresh perspective.
⚪ Quick setup (dual-view):
Split your TradingView layout into two synchronized charts.
Right pane: keep your standard candlestick or bar chart for live execution.
Left pane: add 3D Candles (Zeiierman) to compare the same symbol/timeframe.
Observe differences: the 3D rendering can make expansion/contraction and body emphasis easier to spot at a glance.
█ Go Full 3D
Take the experience further by pairing 3D Candles (Zeiierman) with Volume Profile 3D (Zeiierman) , a perfect complement that shows where activity is concentrated, while your 3D candles show how the price unfolded.
█ Settings
Candles — How many 3D candles to draw. Higher values draw more shapes and may impact performance on slower machines.
Block Width (bars) — Visual thickness of each 3D candle along the x-axis. Larger values look chunkier but can overlap more.
Up/Down — Controls the tilt and strength of the 3D top face.
3D depth (% of range) — Thickness of the 3D effect as a percentage of each candle’s own high–low range. Larger values exaggerate the depth.
-----------------
Disclaimer
The content provided in my scripts, indicators, ideas, algorithms, and systems is for educational and informational purposes only. It does not constitute financial advice, investment recommendations, or a solicitation to buy or sell any financial instruments. I will not accept liability for any loss or damage, including without limitation any loss of profit, which may arise directly or indirectly from the use of or reliance on such information.
All investments involve risk, and the past performance of a security, industry, sector, market, financial product, trading strategy, backtest, or individual's trading does not guarantee future results or returns. Investors are fully responsible for any investment decisions they make. Such decisions should be based solely on an evaluation of their financial circumstances, investment objectives, risk tolerance, and liquidity needs.
Priceactiontrading

Cnagda Pure Price ActionCnagda Pure Price Action (CPPA) indicator is a pure price action-based system designed to provide traders with real-time, dynamic analysis of the market. It automatically identifies key candles, support and resistance zones, and potential buy/sell signals by combining price, volume, and multiple popular trend indicators.
How Price Action & Volume Analysis Works
Silver Zone – Logic, Reason, and Trade Planning
Logic & Visualization:
The Silver Zone is created when the closing price is the lowest in the chosen window and volume is the highest in that window.
Visually, a large silver-colored box/rectangle appears on the chart.
Thick horizontal lines (top and bottom) are drawn at the high and low of that candle/bar, extending to the right.
Reasoning:
This combination typically occurs at strong “accumulation” or support areas:
Sellers push the price down to the lowest point, but aggressive buyers step in with high volume, absorbing supply.
Indicates potential exhaustion of selling and likely shift in market control to buyers.
How to Plan Trades Using Silver Zone:
Watch if price returns to the Silver Zone in the future: It often acts as powerful support.
Bullish entries (buys) can be planned when price tests or slightly pierces this zone, especially if new buy signals occur (like yellow/green candle labels).
Place your stop-loss below the bottom line of the Silver Zone.
Target: Look for the nearest resistance or opposing zone, or use indicator’s bullish label as confirmation.
Extra Tip:
Multiple touches of the Silver Zone reinforce its importance, but if price closes deeply below it with high volume, that’s a caution signal—support may be breaking.
Black Zone – Logic, Reason, and Trade Planning (as CPPA):
Logic & Visualization:
The Black Zone is created when the closing price is the highest in the chosen window and volume is the lowest in that window.
Visually, a large black-colored box/rectangle appears on the chart, along with thick horizontal lines at the top (high) and bottom (low) of the candle, extending to the right.
Reasoning:
This combination signals a strong “distribution” or resistance area:
Buyers push the price up to a local high, but low volume means there is not much follow-through or conviction in the move.
Often marks exhaustion where uptrend may pause or reverse, as sellers can soon step in.
How to Plan Trades Using Black Zone:
If price revisits the Black Zone in the future, it often acts as major resistance.
Bearish entries (sells) are considered when price is near, testing, or slightly above the Black Zone—especially if new sell signals appear (like blue/red candle labels).
Place your stop-loss just above the top line of the Black Zone.
Target: Nearest support zone (such as a Silver Zone) or next indicator’s bearish label.
Extra Tip:
Multiple touches of the Black Zone make it stronger, but if price closes far above with rising volume, be cautious—resistance might be breaking.
Support Line – Logic, Reason, and Trade Planning (as Cppa):
Logic & Visualization:
The Support Line is a dynamically drawn dashed line (usually blue) that marks key price levels where the market has previously shown significant buying interest.
The line is generated whenever a candle forms a high price with high volume (orange logic).
The script checks for historical pivot lows, past support zones, and even higher timeframe (HTF) supports, and then extends a blue dashed line from that price level to the right, labeling it (sometimes as “Prev Support Orange, HTF”).
Reasoning:
This line helps you visually identify where demand has been strong enough to hold price from falling further—essentially a floor in the market used by professional traders.
If price approaches or re-tests this line, there’s a good chance buyers will defend it again.
How to Plan Trades Using Support Line:
Watch for price to approach the Support Line during down moves. If you see a bullish candlestick pattern, buy labels (yellow/green), or other indicators aligning, this can be a high-probability entry zone.
Great for planning stop-loss for long trades: place stops just below this line.
Target: Next resistance zone, Black Zone, or the top of the last swing.
Extra Tip:
Multiple confirmations (support line + Silver Zone + bullish label) provide powerful entry signals.
If price closes strongly below the Support Line with volume, be cautious—support may be breaking, and a trend reversal or deeper correction could follow.
Resistance Line – Logic, Reason, and Trade Planning (from CPPA):
Logic & Visualization:
The Resistance Line is a dynamically drawn dashed line (usually purple or red) that identifies price levels where the market has previously faced significant selling pressure.
This line is created when a candle reaches a high price combined with high volume (orange logic), or from a historical pivot high/resistance,
The script also tracks higher timeframe (HTF) resistance lines, labeled as “Prev Resistance Orange, HTF,” and extends these dashed lines to the right across the chart.
Reasoning:
Resistance Lines are visual markers of “supply zones,” where buyers previously failed, and sellers took control.
If the price returns to this line later, sellers may get active again to defend this level, halting the uptrend.
How to Plan Trades Using Resistance Line:
Watch for price to approach the Resistance Line during up moves. If you see bearish candlestick patterns, sell labels (blue/red), or bearish indicator confirmation, this becomes a strong shorting opportunity.
Perfect for placing stop-loss in short trades—put your stop just above the Resistance Line.
Target: Next support zone (Silver Zone) or bottom of the last swing.
If the price breaks above with high volume, avoid shorting—resistance may be failing.
Extra Tip:
Multiple resistances (Resistance Line + Black Zone + bearish label) make short signals stronger.
Choppy movement around this line often signals indecision; wait for a clear rejection before entering trades.
Bullish / Bearish Label – Logic, Reason, and Trade Planning:
Logic & Visualization:
The indicator constantly calculates a "Bull Score" and a "Bear Score" based on several factors:
Trend direction from price slope
Confirmation by popular indicators (RSI, ADX, SAR, CMF, OBV, CCI, Bollinger Bands, TWAP)
Adaptive scoring (higher score for each bullish/bearish condition met)
If Bull Score > Bear Score, the chart displays a green "BULLISH" label (usually below the bar).
If Bear Score > Bull Score, the chart displays a red "BEARISH" label (usually above the bar).
If neither dominates, a "NEUTRAL" label appears.
Reasoning:
The labels summarize complex price action and indicator analysis into a simple, actionable sentiment cue:
Bullish: Majority of conditions indicate buying strength; trend is up.
Bearish: Majority signals show selling pressure; trend is down.
How to Use in Trade Planning:
Use the Bullish label as confirmation to enter or hold long (buy) positions, especially if near support/Silver Zone.
Use the Bearish label to enter/hold short (sell) positions, especially if near resistance/Black Zone.
For best results, combine with candle color, volume analysis, or other labels (yellow/green for buys, blue/red for sells).
Avoid trading against these labels unless you have strong confluence from zones/support levels.
Yellow Label (Buy Signal) – Logic, Reason & Trade Planning:
Logic & Visualization:
The yellow label appears below a candle (label.style_label_up, yloc.belowbar) and marks a potential buy signal.
Script conditions:
The candle must be a “yellow candle” (which means it’s at the local lowest close, not a high, with normal volume).
Volume is decreasing for 2 consecutive candles (current volume < previous volume, previous volume < second previous).
When these conditions are met, a yellow label is plotted below the candle.
Reasoning:
This scenario often marks the end of selling pressure and start of possible accumulation—buyers may be stepping in as sellers exhaust.
Decreasing volume during a local price low means selling is slowing, possibly hinting at a reversal.
How to Trade Using Yellow Label:
Entry: Consider buying at/just above the yellow-labeled candle’s close.
Stop-loss: A bit below the candle’s low (or Silver Zone line, if present).
Target: Next resistance level, Black Zone, or chart’s bullish label.
Extra Tip:
If the yellow label is found at/near a Silver Zone or Support Line, and trend is “Bullish,” the setup gets even stronger.
Avoid trading if overall indicator shows “Bearish.”
Green Label (Buy with Increasing Volume) – Logic, Reason & Trade Planning:
Logic & Visualization:
The green label is plotted below a candle (label.style_label_up, yloc.belowbar) and marks a strong buy signal.
Script conditions:
The candle must be a “yellow candle” (at the local lowest close, normal volume).
Volume is increasing for 2 consecutive candles (current volume > previous volume, previous volume > second previous).
When these conditions are met, a green label is plotted below the candle.
Reasoning:
This scenario signals that buyers are stepping in aggressively at a local price low—the end of a downtrend with strong, rising activity.
Increasing volume at a price low is a classic sign of accumulation, where institutions or large players may be buying.
How to Trade Using Green Label:
Entry: Consider buying at/just above the green-labeled candle’s close for a momentum-based reversal.
Stop-loss: Slightly below the candle’s low, or the Silver Zone/support line if present.
Target: Nearest resistance zone/Black Zone, indicator’s bullish label, or next swing high.
Extra Tip:
If the green label is near other supports (Silver Zone, Support Line), the setup is extra strong.
Use confirmation from Bullish labels or trend signals for best results.
Green label setups are suitable for quick, high momentum trades due to increasing volume
Blue Label (Sell Signal on Decreasing Volume) – Logic, Reason & Trade Planning:
Logic & Visualization:
The blue label is plotted above a candle (label.style_label_down, yloc.abovebar) as a potential sell signal.
Script conditions:
The candle is a “blue candle” (local highest close, but not also lowest, and volume is neither highest nor lowest).
Volume is decreasing over 2 consecutive candles (current volume < previous, previous < two ago).
When these match, a blue label appears above the candle.
Reasoning:
This typically signals buyer exhaustion at a local high: price has gone up, but volume is dropping, suggesting big players may not be buying any more at these levels.
The trend is losing strength, and a reversal or pullback is likely.
How to Trade Using Blue Label:
Entry: Look to sell at/just below the candle with the blue label.
Stop-loss: Just above the candle’s high (or above the Black Zone/resistance if present).
Target: Nearest support, Silver Zone, or a swing low.
Extra Tip:
Blue label signals are stronger if they appear near Black Zones or Resistance Lines, or when the general market label is "Bearish."
As with buy setups, always check for confirmation from trend or volume before trading aggressively.
Here’s a summary of all key chart labels, zones, and trading logic of your Price Action script:
Silver Zone: Powerful support zone. Created at lowest close + highest volume. Best for buy entries near its lines.
Black Zone: Strong resistance zone. Created at highest close + lowest volume. Ideal for short trades near its levels.
Support Line: Blue dashed line at historical demand; buyers defend here. Look for bullish setups when price approaches.
Resistance Line: Purple/red dashed line at supply; sellers defend here. Great for bearish setups when price nears.
Bullish/Bearish Labels: Summarize trend direction using price action + multiple indicator confirmations. Plan buys, holds on bullish; sells, shorts on bearish.
Yellow Label: Buy signal on decreasing volume and local price low. Entry above candle, stop below, target next resistance.
Green Label: Strong buy on increasing volume at a price low. Entry for momentum trade, stop below, target next zone.
Blue Label: Sell signal on dropping volume and local price high. Entry below candle, stop above, target next support.
Best Practices:
Always combine zone/label signals for higher probability trades.
Use stop-loss near zones/lines for risk management.
Prefer trading in the trend direction (bullish/bearish label agrees with your entry).
if Any Question, Suggestion Feel free to ask
Disclaimer:
All information provided by this indicator is for educational and analysis purposes only, and should not be considered financial advice.

4 Flags Whale PatternThis indicator detects a unique 4-bar candlestick pattern characterized by alternating bullish and bearish candles (or vice versa), where all four candles have similar body sizes within a specified tolerance.
Usage:
This pattern may indicate a consolidation phase or a potential breakout zone after indecisive price action. Traders can use it to anticipate a directional move following the "tug-of-war" between buyers and sellers.

Swing High Low Detector by RV5📄 Description
The Swing High Low Detector is a visual indicator that automatically detects and displays swing highs and swing lows on the chart. Swings are determined based on configurable strength parameters (number of bars before and after a high/low), allowing users to fine-tune the sensitivity of the swing points.
🔹 Current swing levels are shown as solid (or user-defined) lines that dynamically extend until broken.
🔹 Past swing levels are preserved as dashed/dotted lines once broken, allowing traders to see previous support/resistance zones.
🔹 Customizable line colors, styles, and thickness for both current and past levels.
This indicator is useful for:
Identifying key market structure turning points
Building breakout strategies
Spotting trend reversals and swing zones
⚙️ How to Use
1. Add the indicator to any chart on any timeframe.
2. Adjust the Swing Strength inputs to change how sensitive the detector is:
A higher value will filter out smaller moves.
A lower value will capture more frequent swing points.
3. Customize the line styles for visual preference.
Choose different colors, line styles (solid/dashed/dotted), and thickness for:
Current Swing Highs (SH)
Past Swing Highs
Current Swing Lows (SL)
Past Swing Lows
4. Observe:
As new swing highs/lows are detected, the indicator draws a new current level.
Once price breaks that level, the line is archived as a past level and a new current swing is drawn.
✅ Features
Fully customizable styling for all lines
Real-time updates and automatic level tracking
Supports all chart types and instruments
👨💻 Credits
Script logic and implementation by RV5. This script was developed as a tool to improve price action visualization and trading structure clarity. Not affiliated with any financial institution. Use responsibly.

Master Candle Breakout V1 Master Candle Breakout V1 - Indicator Description
The Master Candle Breakout V1 indicator is a powerful price action-based tool designed to help traders identify and capitalize on breakout opportunities from consolidation phases. This indicator is particularly useful for identifying master candles, which are large candles that encompass the range of subsequent candles, creating a key level of support or resistance. Once the price breaks above or below the range of the master candle, the indicator provides clear buy or sell signals, allowing traders to ride the momentum of the breakout.
Key Features:
Master Candle Detection: The indicator identifies master candles based on a user-defined period, marking them on the chart as critical breakout points.
Buy and Sell Signals: When the price breaks above the master candle's high, a buy signal is plotted. Similarly, when the price breaks below the master candle's low, a sell signal is generated. These signals are displayed on the chart with customizable shapes (diamonds, arrows, circles, crosses) and colors for easy visualization.
Stop-Loss Level Display: For risk management, the indicator calculates and plots a stop-loss level based on user-defined ticks above or below the master candle's high or low. The stop-loss value is shown as a label next to the signal, helping traders manage risk effectively.
Customizable Colors and Shapes: Users can fully customize the appearance of the signals, including the color of the buy/sell diamonds, the stop-loss label text color, and the type of shape used for the signals.
Versatile Application: The Master Candle Breakout V1 can be applied to any timeframe and market, from forex and stocks to commodities and cryptocurrencies, making it a highly versatile tool for traders of all types.
How to Use:
Master Candle Period: Define how many candles should follow the master candle for confirmation.
Stop Loss Ticks: Set the number of ticks above or below the master candle to define your stop-loss level.
Entry Signals: Once the price closes outside the high or low of the master candle, enter the trade accordingly (buy on breakouts above the high, sell on breakouts below the low).
Risk Management: Use the stop-loss level provided by the indicator to minimize losses and protect your capital.
This indicator is perfect for traders who prefer a simple, price-action-based strategy and want to avoid the clutter of traditional indicators. By focusing on the core principle of breakouts, Master Candle Breakout V1 helps traders quickly identify consolidation zones and potential breakout trades.

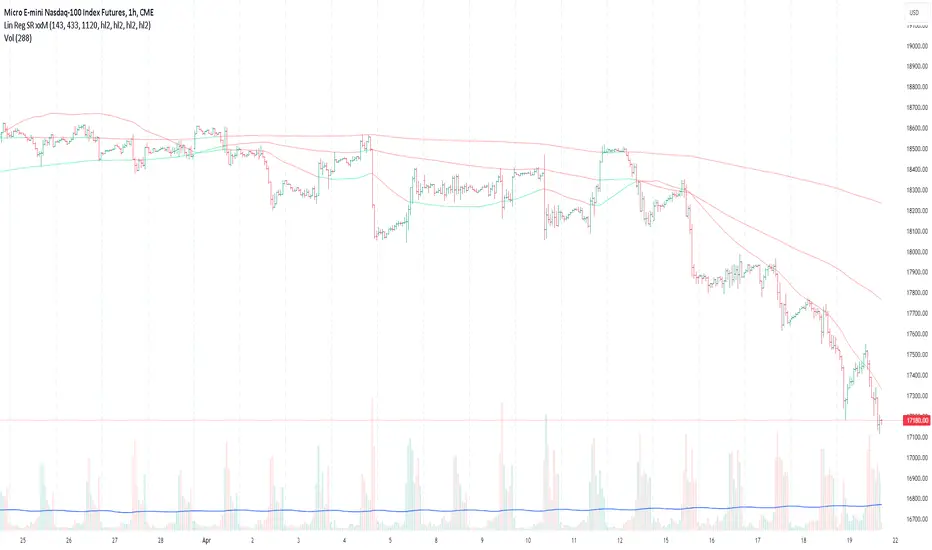
Lin Reg (Linear Regression) Support and Resistance by xxMargauxLin Reg (Linear Regression) Support & Resistance by xxMargaux 💸
This indicator plots three linear regression lines (Lin Reg) on the price chart, providing insights into potential support and resistance levels. It calculates Lin Reg lines based on user-defined lengths and sources.
This indicator's settings were initially configured for MNQ1! (E-Mini Nasdaq 100 futures contracts). But works as intended on any security and on any timeframe.
When price is below a given Lin Reg line, that line will be red and may serve as resistance as price moves up towards the line. That is, it may be a potential short entry opportunity. When price is above a given Lin Reg line, that line will be green and may serve as support as price continues up from the line. That is, it may be a potential long entry opportunity.
When price starts to break sideways or down through the Lin Reg lines, this may signal a reversal from uptrend to downtrend. When price starts to break sideways or up through the Lin Reg Lines, this may signal a reversal from downtrend to uptrend. In very strong trends, breaking through the lines briefly may provide an entry opportunity, but be cautious because a trend reversal may also be possible.
Inputs:
Length of Price Lin Reg Lines: Customize the lengths of the three Lin Reg lines.
Source for Price Lin Reg Lines: Choose the source for each Lin Reg line.
Source for Security Price: Select the price source for the security.
Features:
Trend Analysis: Assists in visualizing price trends based on the relationship between the security price and Lin Reg lines, which will be colored according to whether price is above or below each Lin Reg line.
Customizable Colors: When price is above a Lin Reg line that line will be green. When price is below a Lin Reg line, that line will be red.
Here's a beginner-friendly explanation of linear regression lines 💡
Best-Fit Line: Imagine you have a scatter plot of closing prices on a chart. Linear regression aims to find the straight line that best fits the overall trend of these data points. It's like drawing a line through the center of the data that minimizes the distance between the line and each data point.
Trend Identification: Once the linear regression line is plotted on a price chart, it provides a visual representation of the trend. If the price is generally rising, the linear regression line will slope upwards. If the price is falling, the line will slope downwards. This helps traders identify whether the trend is bullish (upward) or bearish (downward).
Support and Resistance: Linear regression lines can also act as dynamic support and resistance levels. When the price is above the linear regression line, it may act as support, meaning the price tends to bounce off the line and continue higher. Conversely, when the price is below the line, it may act as resistance, with the price encountering selling pressure and potentially reversing lower.
Reversal Signals: Changes in the slope or direction of the linear regression line can signal potential trend reversals. For example, if the price breaks above a downward-sloping linear regression line, it may indicate a shift from a downtrend to an uptrend, and vice versa.
Adjustable Parameters: Traders can customize the length of the linear regression line by adjusting the period over which it's calculated. Shorter periods may be more sensitive to recent price changes, while longer periods may provide a smoother trend line.
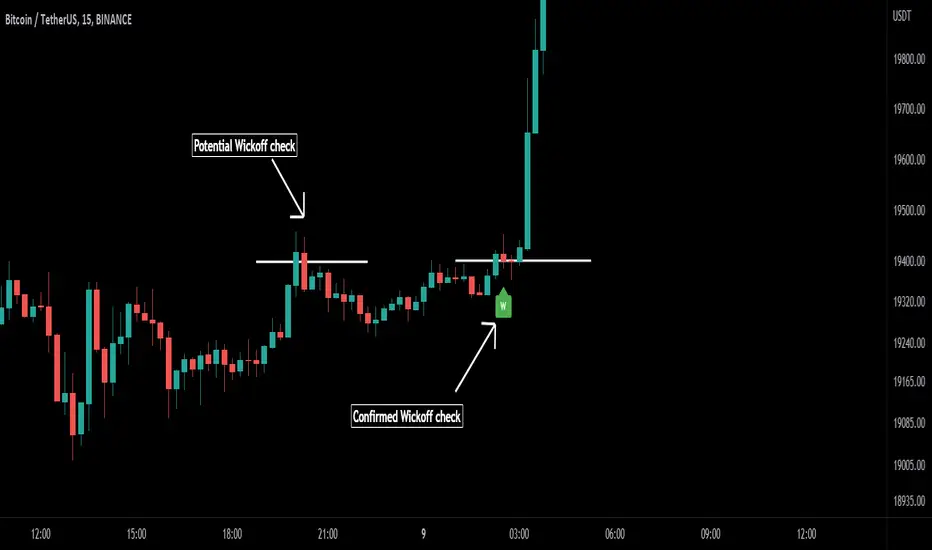
Wick-off Check Pattern [Misu]█ This Indicator shows a wick-off check pattern.
This pattern appears when a candle goes below a level (support or resistance) and closes above it OR when it goes above a level and finishes below it. This causes a wick to go through the level: a wick-off check .
This can confirm a pullback or a breakout.
█ Usages:
This indicator can be used to validate a resistance or support level.
It can also be used to validate breaking levels.
█ Parameters:
Deviation: Parameter used to calculate pivots.
Depth: Parameter used to calculate pivots.
Wickoff Mode: Mode used to detect Wickoff check pattern.
> counter pattern: only shows "pullback" wickoff check.
> breakout pattern: only shows "breakout moves" wickoff check.
> both: shows both.
Lenght Avg Body: Lenght used to calculate the average body size.
First Breakout Factor:
Lenght Avg Wick Validation: This factor multiplied by the "body avg" filters out the non-significant breakout.
Factor Avg Wick Validation: Lenght used to calculate the average wick size.
Max Bars Wickoff: This factor multiplied by the "wick avg", filters out the non-significant wickoff signals.
Average Price LineThis was published in substitute of the original AVG price line that was already implemented into TradingVIew.
Get the average price in the desired range you want.

Bobbin DetectorENGLISH
BOBBINS (cluster)
BOBBINs can also be called clusters. In the region where the price sees an up and down
similar to side-by-side BOBBINs formed by clustering. The decision is the region.
In the BOBBIN formation, the bars are not taken into account much at first. with BOBBINs
When using other formations, attention should be paid to the needles.
through
Sellers dominate from above, price falls; price with more buyers below
comes out again. Until either side gives up or one side of a buy or sell order
This go-and-go movement continues until it ends. When finished, the BOBBIN dissolves and destroys
The movement towards the shadow continues.
Often the BOBBINs are voluminous untied. A strong candle with momentum
bar is formed. This is where Supdems, that is, supply-demand drawings come into play.
TÜRKÇE
BOBİNLER
Bobinlere küme de denilebilir. Fiyatın bir yukarı bir aşağı doğru giderek aynı bölgede
kümelenmesiyle oluşur, yan yana dizilmiş bobinlere benzer. Karar bölgesidir.
Bobin oluşumunda barların iğneleri ilk başta çok dikkate alınmaz. Bobinler ile birlikte
başka formasyonlar kullanılırken iğnelere dikkat edilir.
Yukarıdan satıcılar baskın çıkar, fiyat düşer; aşağıda alıcıların fazla olmasıyla fiyat
tekrar çıkar. İki taraftan biri pes edinceye kadar ya da alış ya da satış emirlerinin bir tarafı
bitinceye kadar bu git-gel hareketi devam eder. Bittiği zaman bobin çözülür ve yok ettiği
gölgeye doğru hareket devam eder.
Çoğu zaman bobinler hacimli bir şekilde çözülür. Momentumlu, kuvvetli bir mum
çubuk oluşur. İşte burada da Supdem’ler yani arz-talep çizimleri devreye girer.
kaynak:
Price Action TR

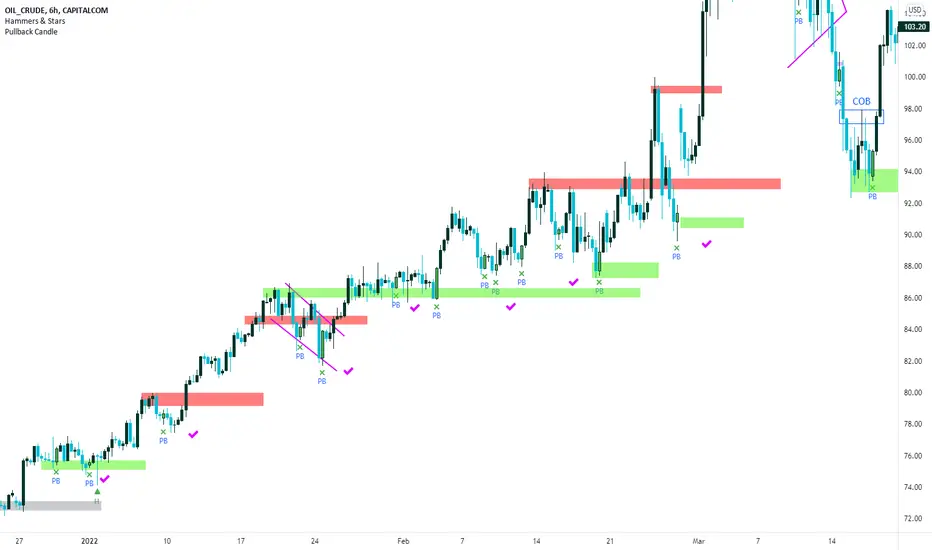
Pullback Candles (Candlestick Analysis) Guaranteed Winners!!!!Pullback Candle will signal when price is at the end of a pullback and entering a balance phase in the market (works on all markets)
Also we can expect a Pullback Candle during flash crashes as the theory of this script is when there is a turning point in momentum - this candle will appear and we can look long from this signal.
This candle will only work in Swing Low areas and appear when below an moving average which can be changed in the settings.
This candle will work on all timeframes - HTF provided very good rexpectancy whereas the LTF has a slightly less expectancy.
This candle can be alerted to signal the Pullback Candle when the bar is confirmed and not during.
The way i trade this candle is
1) Candle signal must be in probably area to increase efficiency.
2) Enter on the second candle after candle IS CONFIRMED
3) Set stop loss below Pullback Candle or use ATR value
4) Trade with the trend ie only bullish price action
5) This candle can catch falling knifes - we had one on LUNA before the rally to $7.50
6) Trading with a confluence along with the Pullback is better than solely trading this candle
Please leave a comment.
If we get to 100 likes i will publish the script.
Have a good weekend :)
RVOL Relative Volume - IntradayHello All,
Relative Volume is one of the most important indicators and Traders should check it while trading/analyzing. it is used to identify whether the volume flows are increasing or decreasing. Relative volume measures current volume in relation to the “usual” volume for this time of the day. What is considered “usual"? For that, we have to use a historical baseline known as the average daily volume. That means how much volume a security does on a daily basis over a defined period. (This scripts runs on the time frames greater or equal 1 minute and less than 1 day)
The common definition for real-time relative volume is: Current volume for this time of day / Average volume for this time of day. It does not mean taking the volume (for example) from 10:30 am to 10:45 am and comparing it to what it does from 10:30 am to 10:45 am every day. What it truly means is to compare cumulative volumes. Therefore, this is the precise definition of real-time relative volume:
Current cumulative volume up to this time of day / Average cumulative volume up to this time of day
What should we understand while checking RVOL;
- Relative volume tell us if volume flows are increasing or decreasing
- A high relative volume tells us that there is increased trading activity in a security today
- Increased volume flows often accompany higher volatility i.e. a significant price move
Let see an example:
P.S. if you want to get more info about RVOL/Relative Volume then you can search it on the net. While developing the script this was used as reference, you can also check it for more info.
Enjoy!

Price ActionFirst, you have to know price action, RTM price action Handbook could help you
this indicator shows you base and momentum candles
base candles could be zones of trade that show you fighting of bulls and bears, and momentum candles could show the power of those zones.
Base candles are white in the chart, and you can place your order at the good zone.
Rally candles and drop candles are momentum candles, and bold rally and bold drop show that it is more powerful than its before candle.
Zigzag compression is one way that shows the compression in trend.
it looks like the Wedges pattern at classic technical that shows pending orders are closed, so the target zone could be powerful to reverse the trend.
Black background of candle means that candle doesn't reach its before candle and so it is poor candle, I named it domination.
It is better to do not trade at poor candles.
At the end, I find Price action the best way to trade, and it makes you free of other indicator, even volume indicator.
This indicator is good for those who use price action strategy to trade and those who want to learn the price action.
It could be so helpful and reliable way to find the zones, and place buy or sell order and the target, specially for scalping.

Moving Average of Upper and Lower Wicks with optional smoothingIn the book, The New Technical Trader by Tushar Chande and Stanley Kroll there is a part that talks about candlestick analysis and how the wicks play a role on how the price will behave. When wick lengths increase then there could be uncertainty. Weakening of support and resistance levels can also be seen by the size of the candlestick wicks or shadows. Shoutouts to Mango2Juice from Tradingview and the The Academy of Forex for helping me out in making this and providing the moving averages function.
When combined with other indicators or strategies, I find that this increases their accuracy when used correctly. For those that believe in price action, this might be worth a try. The book has only a brief section on candlestick wicks but it is one of the most interesting ideas I found. The book likes to include a simple moving average in its indicators with a certain length to provide a smoothing type of effect or a sort of extra indicator for the other to be above to give off quicker signals at the cost of accuracy. For this indicator it acts as a smoothing type effect which I put in because it is hard to see the slope and direction of where the moving averages of the wicks are going. The type of moving averages to use and the correct lengths are questionable and are not explained well in the book. If anyone can figure out a good use for this or know better settings or tips, please let me know.
