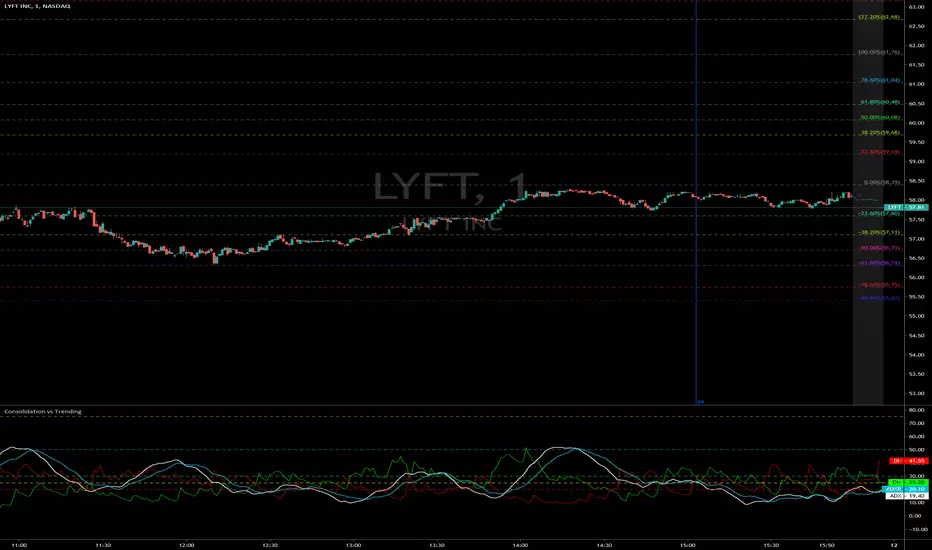
Consolidation vs Trending
ADX is used to quantify trend strength. ADX calculations are based on a moving average of price range expansion over a given period of time. The default setting is 14 bars, although other time periods can be used. ADX can be used on any trading vehicle such as stocks, mutual funds, exchange-traded funds and futures.
ADX is plotted as a single line with values ranging from a low of zero to a high of 100. ADX is non-directional; it registers trend strength whether price is trending up or down. The indicator is usually plotted in the same window as the two directional movement indicator (DMI) lines, from which ADX is derived.
When the +DMI is above the -DMI, prices are moving up, and ADX measures the strength of the uptrend. When the -DMI is above the +DMI, prices are moving down, and ADX measures the strength of the downtrend.
ADX values help traders identify the strongest and most profitable trends to trade. The values are also important for distinguishing between trending and non-trending conditions. Many traders will use ADX readings above 25 to suggest that the trend is strong enough for trend-trading strategies. Conversely, when ADX is below 25, many will avoid trend-trading strategies.
ADX Value Trend Strength
0-25 Absent or Weak Trend
25-50 Strong Trend
50-75 Very Strong Trend
75-100 Extremely Strong Trend
Range
RePaNoCHa [Alerts]Script for automatic trading with Alerts (Use Backtest to customize your own settings)
All timeframes but good results on 2H.
LG --> Long
ST --> Short
TS --> Trailing Stop
xL --> Close Long Position
xS --> Close Short Position
SL --> Stop Loss
The trailing stop closes the trade if the price changes direction by a specified percentage or offset. There is no ideal distance because markets and price are always changing and we know that is impossible to exit on the top or bottom. This script interpolate the trailing Stop Offset with profit, higher profit -- > higher Trailing Stop Offset. Despite this, it's difficult to catch the price. If someone comes up with a good idea, comment, I'm happy to learn.
No security() function so no repaint but has time() and can appear a warning for it.
Alerts:
'Once per bar' More profit but not confirmed alerts (10-20% fake alerts)... I like risk
'Once per bar close' Confirmed alerts (0% fake alerts)... You will sleep better
Some settings:
XBTUSD (BITMEX)
Timeframe = 2H
Position Side = BOTH
Source = hlc3
T3 Length = 5
T3 Volume Factor = 0.9
Sampling Period = 16
Range Multiplier = 1.3
ADX lenght = 10
ADX Threshold = 20
SAR start = 0.07
SAR inc = 0.02
SAR max = 0.15
Pyramiding = 10
Trailing Stop Activation % = 0.5
Trailing Stop Offset % (when profit=0.5 %) = 0.35
Trailing Stop Offset % (when profit=10 %) = 1.5
Stop Loss = 3.5
Tics/Pips Correction = 10
Initial Capital = 1000
Quantity = 100 %
Commission value = 0.075 %
ETHUSD (BITMEX)
Timeframe = 2H
Position Side = BOTH
Source = hlc3
T3 Length = 5
T3 Volume Factor = 0.7
Sampling Period = 13
Range Multiplier = 0.9
ADX lenght = 11
ADX Threshold = 19
SAR start = 0.06
SAR inc = 0.03
SAR max = 0.15
Pyramiding = 10
Trailing Stop Activation % = 0.5
Trailing Stop Offset % (when profit=0.5 %) = 0.35
Trailing Stop Offset % (when profit=10 %) = 1.5
Stop Loss = 4
Tics/Pips Correction = 100
Initial Capital = 1000
Quantity = 100 %
Commission value = 0.075 %
BNBUSDT (BINANCE)
Timeframe = 2H
Position Side = LONG
Source = hlc3
T3 Length = 3
T3 Volume Factor = 1.6
Sampling Period = 17
Range Multiplier = 1.3
ADX lenght = 5
ADX Threshold = 18
SAR start = 0.04
SAR inc = 0.03
SAR max = 0.25
Pyramiding = 10
Trailing Stop Activation % = 0.5
Trailing Stop Offset % (when profit=0.5 %) = 0.4
Trailing Stop Offset % (when profit=10 %) = 1.5
Stop Loss == false
Tics/Pips Correction = 10000
Initial Capital = 1000
Quantity = 100 %
Commission value = 0.075 %
LTCUSDT (BINANCE)
Timeframe = 2H
Position Side = LONG
Source = hlc3
T3 Length = 3
T3 Volume Factor = 1.6
Sampling Period = 11
Range Multiplier = 1.1
ADX lenght = 6
ADX Threshold = 22
SAR start = 0.07
SAR inc = 0.04
SAR max = 0.15
Pyramiding = 10
Trailing Stop Activation % = 0.5
Trailing Stop Offset % (when profit=0.5 %) = 0.4
Trailing Stop Offset % (when profit=10 %) = 1.5
Stop Loss == false
Tics/Pips Correction = 100
Initial Capital = 1000
Quantity = 100 %
Commission value = 0.075 %
TRXUSDT (BINANCE)
Timeframe = 2H
Position Side = LONG
Source = hlc3
T3 Length = 3
T3 Volume Factor = 0.9
Sampling Period = 8
Range Multiplier = 1.2
ADX lenght = 4
ADX Threshold = 22
SAR start = 0.07
SAR inc = 0.04
SAR max = 0.15
Pyramiding = 10
Trailing Stop Activation % = 0.5
Trailing Stop Offset % (when profit=0.5 %) = 0.4
Trailing Stop Offset % (when profit=10 %) = 1.5
Stop Loss == false
Tics/Pips Correction = 100000
Initial Capital = 1000
Quantity = 100 %
Commission value = 0.075 %
NAS100 (OANDA)
Timeframe = 2H
Position Side = BOTH
Source = hlc3
T3 Length = 3
T3 Volume Factor = 1
Sampling Period = 12
Range Multiplier = 1.3
ADX lenght = 18
ADX Threshold = 21
SAR start = 0.08
SAR inc = 0.06
SAR max = 0.25
Pyramiding = 10
Trailing Stop Activation % = 0.2
Trailing Stop Offset % (when profit=0.5 %) = 0.15
Trailing Stop Offset % (when profit=10 %) = 1
Stop Loss = 1.8
Tics/Pips Correction = 10
Initial Capital = 1000
Quantity = 3 contracts
Commission value = 0.2 USD per contract
NATGAS(OANDA)
Timeframe = 2H
Position Side = BOTH
Source = hlc3
T3 Length = 3
T3 Volume Factor = 1
Sampling Period = 18
Range Multiplier = 1.1
ADX lenght = 10
ADX Threshold = 17
SAR start = 0.1
SAR inc = 0.04
SAR max = 0.35
Pyramiding = 10
Trailing Stop Activation % = 0.2
Trailing Stop Offset % (when profit=0.5 %) = 0.15
Trailing Stop Offset % (when profit=10 %) = 1
Stop Loss = 1.6
Tics/Pips Correction = 1000
Initial Capital = 1000
Quantity = 4500 contracts
Commission value = 0.002 USD per contract
SPX500 (OANDA)
Timeframe = 2H
Position Side = BOTH
Source = hlc3
T3 Length = 3
T3 Volume Factor = 0.6
Sampling Period = 14
Range Multiplier = 1.3
ADX lenght = 12
ADX Threshold = 17
SAR start = 0.23
SAR inc = 0.05
SAR max = 0.2
Pyramiding = 10
Trailing Stop Activation % = 0.15
Trailing Stop Offset % (when profit=0.5 %) = 0.1
Trailing Stop Offset % (when profit=10 %) = 0.75
Stop Loss = 1.5
Tics/Pips Correction = 10
Initial Capital = 1000
Quantity = 8 contracts
Commission value = 0.2 USD per contract
US30 (OANDA)
Timeframe = 2H
Position Side = BOTH
Source = hlc3
T3 Length = 4
T3 Volume Factor = 0.9
Sampling Period = 11
Range Multiplier = 1.1
ADX lenght = 16
ADX Threshold = 24
SAR start = 0.08
SAR inc = 0.03
SAR max = 0.05
Pyramiding = 10
Trailing Stop Activation % = 0.15
Trailing Stop Offset % (when profit=0.5 %) = 0.1
Trailing Stop Offset % (when profit=10 %) = 0.75
Stop Loss = 1.5
Tics/Pips Correction = 10
Initial Capital = 1000
Quantity = 1 contracts
Commission value = 1.5 USD per contract
WHEAT (OANDA)
Timeframe = 2H
Position Side = BOTH
Source = hlc3
T3 Length = 3
T3 Volume Factor = 1.1
Sampling Period = 12
Range Multiplier = 1
ADX lenght = 13
ADX Threshold = 21
SAR start = 0.07
SAR inc = 0.05
SAR max = 0.15
Pyramiding = 10
Trailing Stop Activation % = 0.2
Trailing Stop Offset % (when profit=0.5 %) = 0.15
Trailing Stop Offset % (when profit=10 %) = 1
Stop Loss = 2.5
Tics/Pips Correction = 1000
Initial Capital = 1000
Quantity = 2500 contracts
Commission value = 0.003 USD per contract

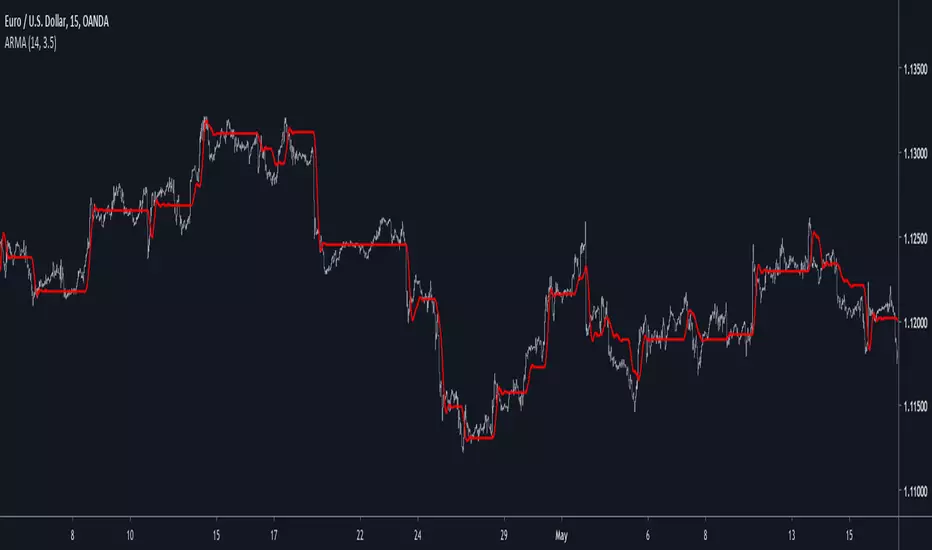
Autonomous Recursive Moving AverageIntroduction
People often ask me what is my best indicators, i can't really respond to this question with a straight answer but i would say you to check this indicator. The Autonomous Recursive Moving Average (ARMA) is an adaptive moving average that try to minimize the sum of squares thanks to a ternary operator, this choice can seem surprising since most of the adaptive moving averages adapt to a smoothing variable thanks to exponential averaging, but there are lot of downsides to this method, i really wanted to have a flat filter during flat markets and this is what i achieved.
The Indicator
length control the amount of smoothing during trending periods, gamma is the trend sensitivity threshold, higher values of gamma will make an overall flat filter, adjust gamma to skip ranging markets.
gamma = 2, we can adjust to 3 while preserving smoothing reactivity with trading periods.
gamma = 3
low length and higher gamma create more boxy result, the filter add overshoots directly in the output, its unfortunate.
The Zero-Lag option can reduce the lag as well as getting additional flat results without changing gamma.
Conclusion
The indicator need work, but i can't leave without publishing it, the overshoots are a big problems, changing sma for another stable filter can help. I hope you find an use to it, i really like this indicator.
Thanks for reading
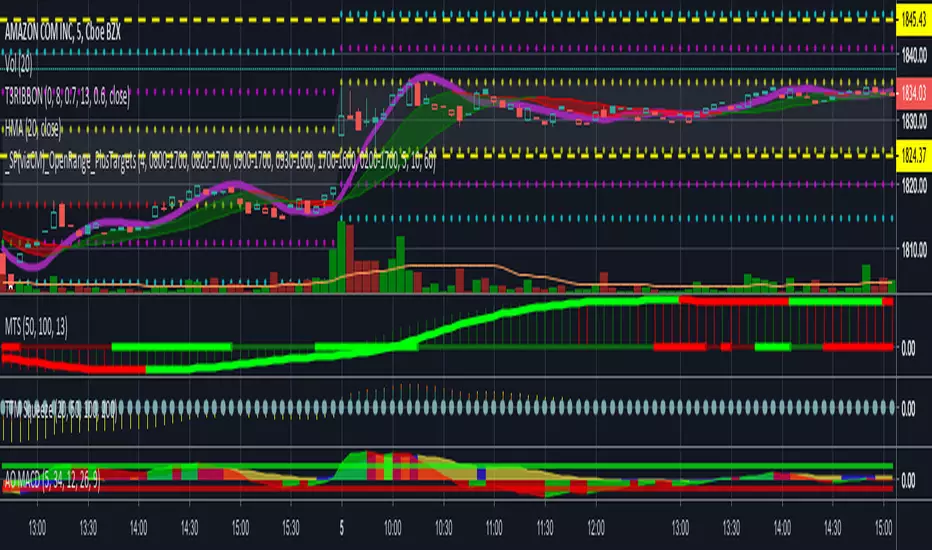
_SP(viaCM)_Opening-Range-FinalChris Moody's script. I just lessened the line/circle width, got rid of the highlighting overall, and reduced the highlighting between OR high and OR low.
[Long/Short] Range Filter-ADX-SAR [BACKTEST]Backtest of the same previous script with alerts.
Range Filter + ADX + SAR + Trailing Stop + Take Profit

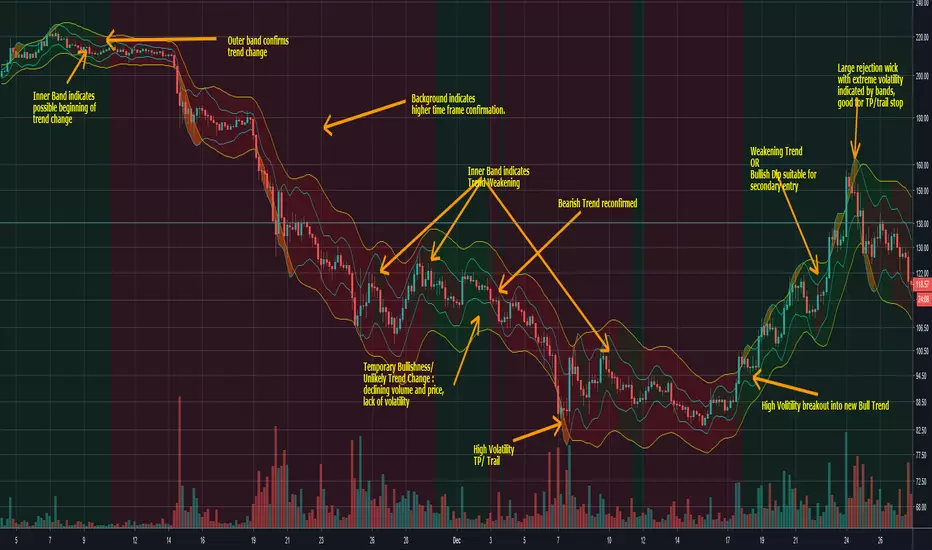
Rumpy's Volume Weighted ALMA Trend and VolatilityA number of experiments have been tested, refined and combined into a trend following system.
There's elements of pivot boss, multiple length volume weighted ALMA based trend detection (optional MTF) and my own "chandelier" based cycle/volatility bands.
Inner bands indicate short term volatility range, support/resistance, Outer bands medium term.
Inner band colour represents short term trend and can indicate early a possible trend change, trend weakening etc.
Confirmed by the medium term trend and the chart background MTF trend.
High volatility events can indicate tops/bottoms, or at the very least cautionary areas where at the very least partial TP/more active risk management should come into play.
During periods of prolonged sideways/chop you will get mixed signals and it is best to wait for a good high volatility/volume breakout before considering an entry.
Additional notes on the chart.
-------------------------------------------------------
A lot of time and effort went into this one, if you find it useful please consider a tip/donation : BTC - 3BMEXEDyWJ58eXUEALYPadbn1wwWKmf6sA
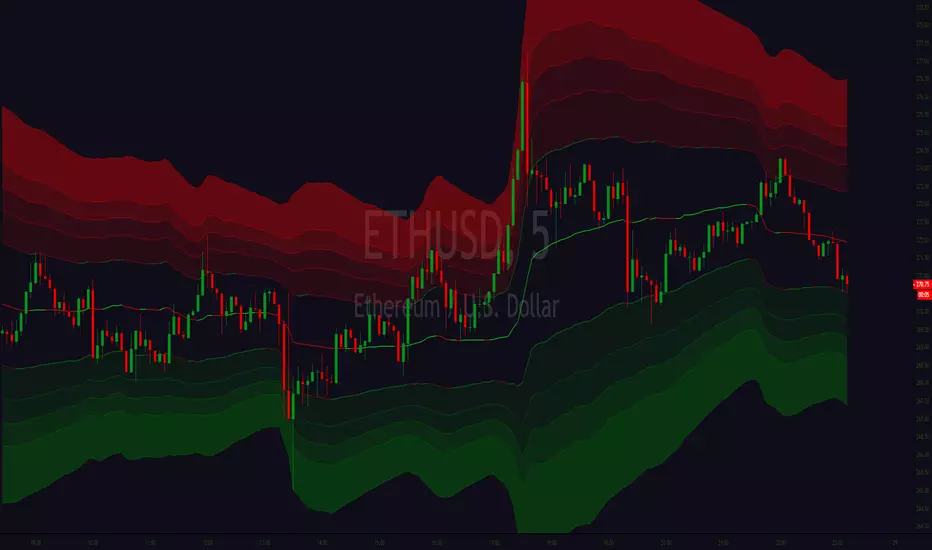
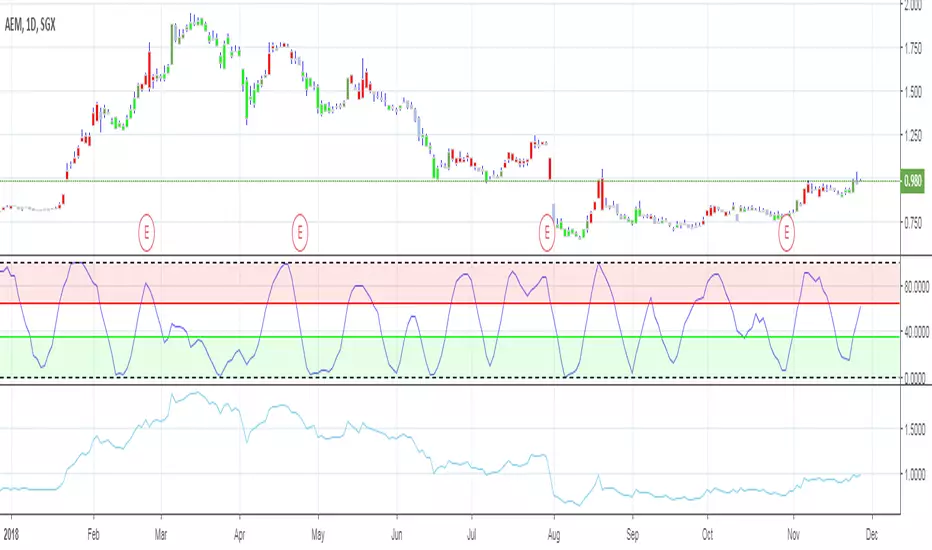
9 Seasons Rainbow Indicator DEMO [GO8686]Having good pattern recognition? Use this indicator to test and practice it.
Market is full of life, with seasons.
9 Seasons Rainbow Indicator displays 9 seasons of any trading instrument in multiple time frames, helping traders and investors understand the flow of price.
The combination of seasons in different time dimensions may give perfect trading signals, for instance: overbought in both small time frame and big time frame has high success probability of shorting trade.
Please install the indicator: Demo, PRO or STANDARD Version. Apply the indicator to your favorites trading instruments: indices, stocks, futures, forex or crypto currencies. Find your patterns that make money.
---------- 9 Seasons ----------
Bull(Green), evolves into BullRest, OverBought, Bear, or Neutral
Bull Rest(Light Green): a pullback or retracement, evolves into Bull or Bear
OverBought(Yellow): may have defined a top or resistance, can happen in range, evolves into CrazyBought or Bear
CrazyBought(Lime): going up in a high volatility, evolves into Bear, OverBought, or BullRest
Neutral(White): a wandering season without direction, evolves into Bull or Bear
Bear(Red), evolves into BearRest, OverSold, Bull or Neutral
Bear Rest(Light Red): a bounce, evolves into Bear or Bull
OverSold(Blue): may have defined a bottom or support, can happen in range, evolves into CrazySold or Bull
CrazySold(Fuchsia): going down in a high volatility, evolves into Bull, OverSold, or BearRest
---------- Some important evolutions of seasons ----------
OverBought -> CrazyBought: can happen with a breakout
CrazyBought -> OverBought or Bear: could mean fading of a breakout
CrazyBought -> BullRest: can happen after rising over a new level
OverSold -> CrazySold: can happen with a breakdown
CrazySold -> OverSold or Bear: could mean fading of a breakdown
CrazySold -> BearRest: can happen after dropping to a new level
---------- Rainbow Ribbons for multiple time frames ----------
Each ribbon of the rainbow represents a time frame,
The difference between two frames is 1.4142 fold (square root of 2), if level 1 is 15 M, level 2 is 15 * (square root of 2) M. level 3 is 15*2 M, level 4 is 30 * (square root of 2) M, level 5 is 30 * 2 m etc.
The uppermost ribbon represents the smallest time frame - current time period of the chart.
The lower ribbons represent bigger time frames, which work as context.
Examples for time frame rainbow:
For DEMO in 30M: 30M - 42M - 60M(1H) - 85M - 120M(2H) - 170M - 240M(4H) - 339M
For STANDARD in 15M: 15M - 21M - 30M - 42M - 60M(1H) - 85M - 120M(2H) - 170M
For PRO in 15M: 15M - 21M - 30M - 42M - 60M(1H) - 85M - 120M(2H) - 170M - 240M(4H) - 339M - 480M(8H) - 679M
---------- Versions Description ----------
The features may change later, please refer to latest update.
DEMO:
This is DEMO of Standard version for trial purpose, having most the functions except alert preset conditions.
It is applicable to a list of trading instruments and specific time periods(30m-1D), which may change later. please refer to latest updates.
---List of tickers applicable for Demo version.
Currency Index:AXY,BXY,CXY,DXY,EXY,JXY,SXY,ZXY,
Stock Index:SPX,TSX,DAX,NI225,KOSPI,399001,SHCOMP,HSI,XJO,TAIEX,SX5E,
Crypto:BTCUSD
Commodity:BCOUSD,GOLD
STANDARD:
STANDARD version of 9 Seasons Rainbow Indicator is invite-only, with the following advanced features:
8 Ribbon Rainbow lets you discover trading opportunities hidden in the 1.4142 fold time dimension while monitoring market conditions spanning 11 times.
Advanced alert sets allows you set alerts for Overbought, Crazybought, OverSold, CrazySold on upper and lower time frames.
Broad time periods access allows you to watch the market on popular time dimensions from 15M - 1D,2D,3D,4D,5D,6D,1W.
More new features in updates.
PRO:
PRO version of 9 Seasons Rainbow Indicator is invite-only, with the following advanced features:
12 Ribbon Rainbow lets you discover trading opportunities hidden in the 1.4142 fold time dimension while monitoring market conditions spanning 45 times.
Advanced alert sets allows you set alerts for Overbought, Crazybought, OverSold, CrazySold on low, medium, and high time frames.
Option to input different trading instrument to compare with the current ticker.
Full time periods access allows you to watch the market on broadest time dimensions.
More new features in updates.
---------- Access to Indicators ----------
Please contact the author for access to PRO or Standard versions.
---------- About Loading Time ----------
It may take up to 2 minutes for your browser to load a new setting, depending on the your computer and network speed.
---------- List of the author's Indicators ----------
www.tradingview.com
---------- Disclaim ----------
By using or requesting access to this indicator, you acknowledge that you have read and accepted that this indicator is for study purposes only and it does NOT guarantee you will make money.
I am not financial adviser and I am NOT responsible for any profits or losses you may incur by using this indicator!
Users should make their own decisions, carefully assess risks and be responsible for investment and trading activities.
The latest updates override the previous description. Please check the updates.
9季彩虹指标 演示版
具备优秀的模式识别能力吗? 9季彩虹指标检验,提升您的模式识别能力。
市场充满生机。
9季彩虹指标在多个时间维度上显示任何交易品种的9个季节交替,帮助交易者和投资者了解价格流动。
不同时间维度的季节组合可以给出完美的交易信号,例如:在小时间框架和大时间框架上同时出现超买具有很高的卖空交易成功概率。
请安装指标:Demo,STANDARD 或者 PRO 版本. 应用指标到您的交易品种:证券,期货,外汇或者加密货币。找到属于您的盈利模式。
---------- 季节的定义 ----------
牛(绿色),可以演变到牛市回调,超买,熊 或者 中性
牛市回调(淡绿色):可以演变到牛或者熊
超买(黄色),可能刚刚定义了一个头部或者阻力区,可以发生在盘整期,可以演变到狂买或者熊
狂买(亮绿色):高波动性上涨,可以演变到熊,超买或者牛市回调
中性(白色): 没有方向的徘徊期,可以演变到牛或者熊
熊(红色),可以演变到熊市反弹,超卖,牛 或者 中性
熊市反弹(淡红色),可以演变到熊或者牛
超卖(蓝色),可能刚刚定义了一个底部或者支撑,可以发生在盘整期,可以演变到狂卖或者牛
狂卖(紫红色),高波动性下跌,可以演变到牛,超卖 或者熊市反弹
一些重要的季节交替
超买 -> 狂买:可能发生在向上突破时
狂买 -> 熊 或者 超买:可能发生在突破失败时
狂买 -> 牛市回调: 可能发生在上平台后
超卖 -> 狂卖:可能发生在向下突破时
狂卖 -> 牛 或者 超卖:可能发生在突破失败时
狂卖 -> 熊市回调: 可能发生在下平台后
---------- 色带彩虹所代表的时间维度 ----------
每条色带代表一个时间维度。
色带间隔1.4142倍(2的开方),如果第一维度是15分钟,第二维度是15*1.4142=21分钟,第三维度是15*2=30分钟,以此类推。
最上面的色带代表最小的时间维度,也就是目前图表的时间维度
最下面的色带代表最大的时间维度。
例子:
演示版: 30m-42m-60m(1H)-85m-120m(2H)-170m-240m(4H)-339m
标准版: 15m-21m-30m-42m-60m(1H)-85m-120m(2H)-170m
专业版: 15m-21m-30m-42m-60m(1H)-85m-120m(2H)-170m-240m(4H)-339m-480m(8H)-679m
---------- 不同版本功能描述 ----------
这些特征及功能可能会发生变化,以更新为准。
--演示版DEMO
演示版用于标准版的演示和试用,适用于特定的资产列表和时间维度(30M-1D),后续可能调整.
适用的品种列表
AXY,BXY,CXY,DXY,EXY,JXY,SXY,ZXY,
SPX,TSX,DAX,NI225,KOSPI,399001,SHCOMP,HSI,XJO,TAIEX,SX5E,
BTCUSD,BCOUSD,GOLD
---标准版STANDARD特征
8色带彩虹让您发现隐藏在1.4142时间维度的交易机会,同时监控时间跨度达十一倍的市场状态
高级警报功能:允许您在低,高时间层级上设置超买,狂买,超卖,狂卖的警报。
宽时间维度(15分钟到日线级别)让您从更宽阔的视角观察市场
更新中的更多新功能。
---专业版PRO高级特征
12色带彩虹让您发现隐藏在1.4142时间维度的交易机会,同时监控时间跨度达四十五倍的市场状态
高级警报功能:允许您在低,中,高时间帧上设置超买,狂买,超卖,狂卖的警报。
可以输入不同的交易品种用于指标,便于与当前交易品种进行比较。
全时间维度(分钟到日线级别)给您全视角观察市场
更新中的更多新功能。
---------- 获得使用权 ----------
联系指标开发者以取得标准版和专业版的使用权
---------- 开发者的指标列表 ----------
www.tradingview.com
---------- 加载时间 ----------
可能需要2分钟,取决于网络和电脑配置。
---------- 免责声明 ----------
在要求获得本指标使用权之前以及在使用本指标之前,用户认可已经完全了解和接受:本指标仅供教育和研究目的, 它不提供任何赢利的可能性。
本指标的开发者并非专业投资顾问,因此不对用户的任何赢亏负责。
用户应独立判断,审慎评估并自负投资和交易风险!
最近的更新会覆盖之前的说明。 请参阅更新来查看指标的新特征和功能。

SampleInvitePublish - V1
This strategy is designed for trading stocks and crypto currencies on the long side.
It uses three different timeframes to determine the most profitable entry prices (Day, 4 hour and chart interval).
The strategy employs ten different setups to accommodate both range trading and trend following markets.
The system contains sophisticated algorithms that scale to varies chart intervals.
Tailored to perform best between 4 hours to as low as 10 minutes.
The entire system consists of three tools: HullbusterScope, HullbusterBacktest and HullbusterSignal.
Hullbuster scope is used to obtain configuration information about the market instrument which will be applied to the HullbusterBacktest.
Commit an iterative approach to the backtest tool until the simulated results match your entry and exit expectations .
Apply the HullbusterSignal to the chart and use the same backtest configuration to setup actual trading alerts.

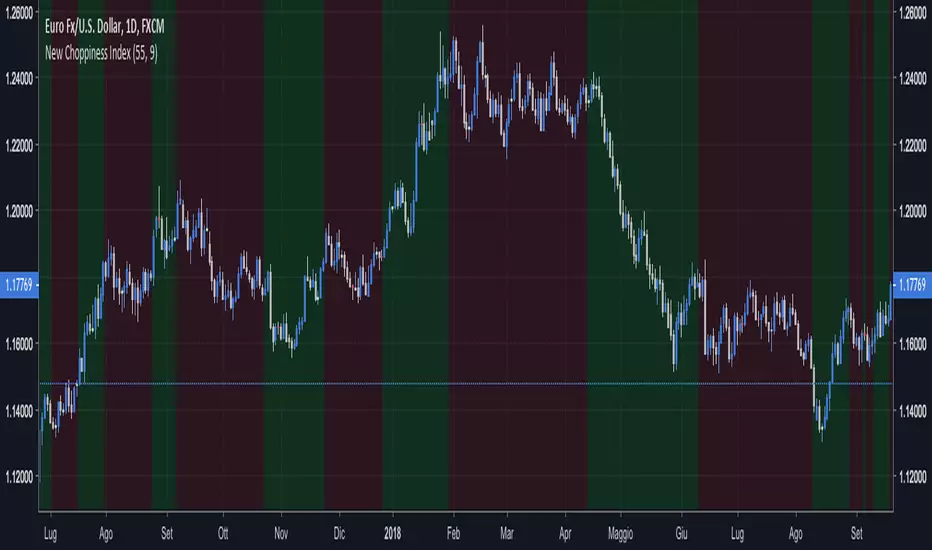
New Choppiness IndexThis script tries to identify trending regions and ranging choppy regions.
Green areas are trends; Red areas are consolidation areas.
If you are a trend follower trader you should focus on green areas;
If you are a harmonic pattern trader you should focus on red areas.
I did not play with the parameters extensively, but as a rule of thumb higher parameters
helps on long term trades.
This tool seems to work better for major currencies pairs, presumably due to the
high exchanged volumes that reduces weird fluctuations.
Good set of parameters are:
(55, 9) the default ones, doing impressively well in EURUSD Daily;
(8, 5) doing well in GBPCHF Daily, short trades to be set at lower timeframes.
Happy trading,
vitelot/yanez/Vts
January 2019
Hitting the like button is a free sign of gratitude.
% Range [NeoButane]A range based on a user chosen top and bottom. With that the:
Middle of range
+/- 0.25% / 0.5% / 1% away from middle of the range
+/- 0.5% / 1% away from range top and range bottom
are given.
A list of my premium indicators: medium.com
Below are some examples of how a range can be chosen:
Another way is choosing a higher timeframe candle that encapsulates most of the trading range.


High-Low RangeThis script just shows a histogram of the daily range. You can change the interval to view the high/low range of any period, but I use it just to see what the day's range is and how it compares to prior days. Simple and straightforward.
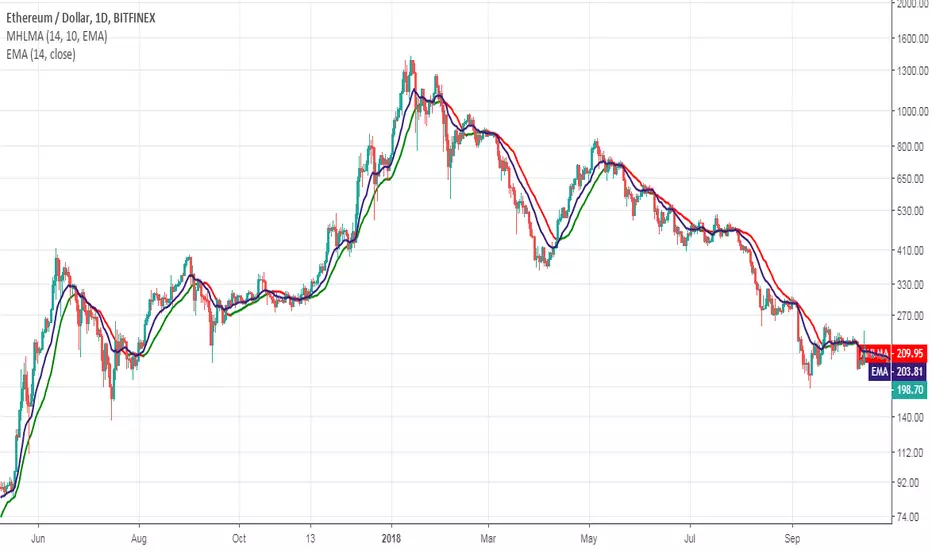
Middle-High-Low Moving AverageThis indicator was originally developed by Vitali Apirine (Stocks & Commodities , V.34:9 (August, 2016): "The Middle-High-Low Moving Average").
You can use it to create a crossover trading system in conjuction with EMA/SMA.
Good luck!
[Long/Short] Range Filter-ADXIt's a useful script for pairs where you can operate long and short.
It's a combination algorithm of the Range filter and the ADX.
The ADX helps to make the decision to enter to open long or short position.
LG --> Long
xL --> Close Long position
ST --> Short
xS --> close Short Position
Enjoy!!!

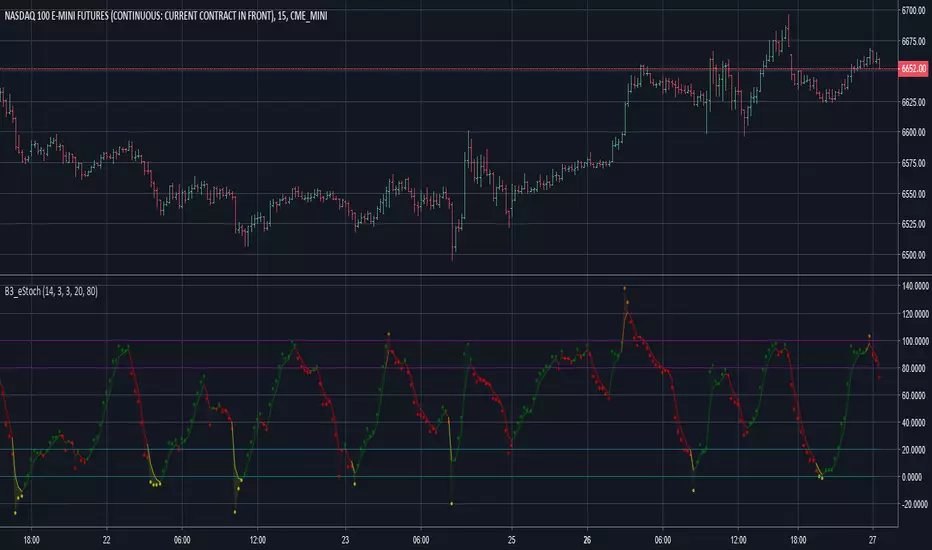
B3 Extended StochasticB3 Extended Stochastic ~ This is my personal take on the standard "Stochastic Full" study that most platforms natively carry. However, this is slightly more powerful. The simple difference is that in a normal stochastic indicator, 0 and 100 are the minimum and maximum values. Here there is no min/max, hence the title "Extended Stochastic." When extended beyond 0 or 100, this tells you if you're expanding range (breaking out), and often the stochastic turns that are beyond the 0 or 100 lines tend to be more juicy than normal stochastic overage turns. There is still the classic 20/80 over-lines, and they still carry their full validity in this script. Think of extended range as additional information and not a remaking of the indicator. You will find it quite successful in oscillation, but as always, oscillators struggle in long running trends.
~B3
Check out my Tview page for more scripts. :)
www.tradingview.com
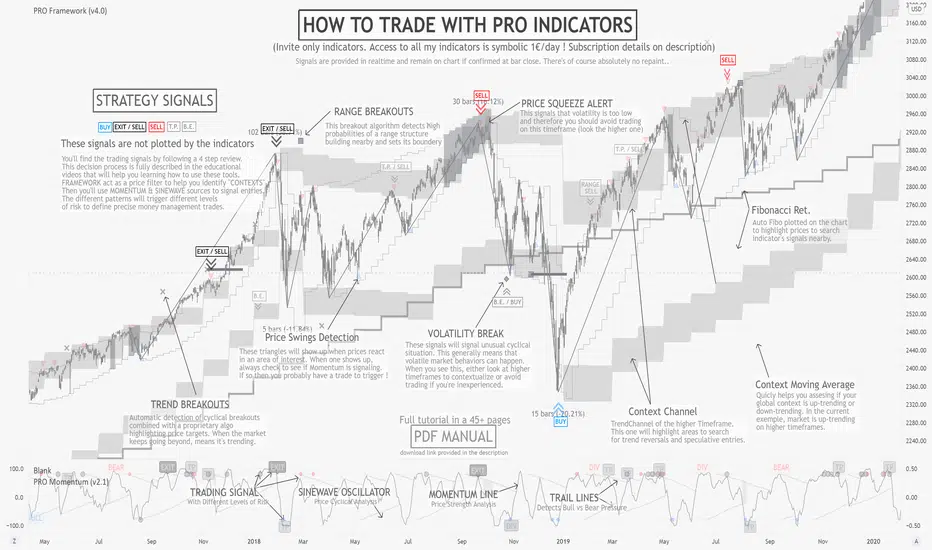
PRO FrameworkINVITE ONLY SCRIPT:
FEATURES:
As its name suggests, Framework is here to offer a non-subjective frame of reference to traders. Effectively filtering 90% of prices offering poor risk management opportunities. More importantly this is a multi-timeframe tool that will scan across three time frames all at once, offering a final synthesized rendering. Our goal was to provide a professional grade dynamic price analysis without bloating the chart with numerous plots. Nevertheless they are complex tools requiring extensive learning. To support students in their journey, there is a wide open online community of users in our Discord channel, providing peer-to-peer assistance to progress with the strategy as well as tutored courses.
OUTPUTS:
To share a brief description of the indicators functioning, we will scroll through the major set of outputs that are presented to the user. Please note that the indicator is meant to assist from Junior to Senior expertise, to achieve this we have set different base templates right into the indicators. To keep this description simple, we will present the outputs you’ll see with the beginner setup:
Context Channel: composed of two “ribbons” one above the price and one below. It represents the dynamic zones of supply and demand, where prices are likely to find support and resistance for the given chart timeframe. They are representing complex algorithmic versions of channels evolving over time, while adapting to both ranges and trend conditions. Allowing to visualize the current price channel which the price is trading within, but also review the history of past dynamics. Ultimately, studying both the recent and past context behavior tells us everything we need about the price structure.
Average Price: Corresponding to a simple 20 period moving average synchronized with the context channel reference timeframe. Looking at the channel’s position relative to this average will help us define the “context” of the market, thereby filtering the patterns we will be able to apply to this chart (range, trend, volatility).
Breakout Targets: represented by small plots on the chart (cross, square, diamond) they inform the trader that the market is attempting to move in a particular direction. Given the predetermined context in which that pattern triggers, this will help us in managing the risk.
Price Confirmations: corresponding to the small triangle plots on the chart, they are automatically calculated to determine areas where other traders might have taken actions. These triangles aren’t a trading signal per say, they will be the trigger for our trades with the PRO Strategy, but only when patterns are active (meaning we are in the right context, and have enough risk limitation elements to justify entry).
Auto-Fibonacci: As most of our patterns include certain retracement rules, we decided to include a built-in fibonacci plotting tool. The outputs will automatically update with new prices, allowing users to use it as a trigger for the TradingView alerts system.
Automated Context Detection: the actual real Intellectual property and added value of PRO Indicators resides in our semi-automated system, based on the complex algorithmic detection of potentially favorable contexts to apply the strategy on. This also means that you can set alerts, and let the cloud monitor the market and be notified when the conditions are deemed viable. As you progress to more Senior contexts and adjust the indicators’ template setup, more complex alerts will be detected.
GENERAL STRATEGY:
Overall, the PRO Strategy combines two “core” indicators, Framework and Momentum. Framework is plotted on the main chart section as an overlay, it is definitely the most important as it guides the user through the hard process of filtering prices and timeframes that are suitable for technical analysis. On the other hand, PRO Momentum is on a separate oscillator tab under the chart section, it will study the momentum and cyclical structure, also offering automated pattern detection. Ultimately, our strategy is based on collecting and processing non-subjective rules, emanating from the indicators outputs. Essentially, this means that the indicator actually takes care of producing all the necessary binary outputs, leaving you with the remaining task of combining them correctly following the strategy’s patterns.
RISK LIMITATION:
Even if we provide semi-automated detection of viable contexts, there is no “one-click” or "easy-win” solution, the user still needs to carefully review the elements. When applicable pattern rules are confirmed, the user will gather risk-limitation information (breakout targets, price confirmations, momentum and cyclical coordination) and decide whether or not to trade according to its own risk profile. If so, the position sizing, stop-loss positioning, risk management and profit targets will all be defined according to the same indicator’s outputs. This effectively suppresses most behavioral and personal biases the trader could introduce, creating a stable and statistical risk management structure aiming for a durable profitability.
[ALERTS] Range Filter"This is an experimental study designed to filter out minor price action for a clearer view of trends.
Inspired by the QQE's volatility filter, this filter applies the process directly to price rather than to a smoothed RSI .
First, a smooth average price range is calculated for the basis of the filter and multiplied by a specified amount.
Next, the filter is calculated by gating price movements that do not exceed the specified range.
Lastly the target ranges are plotted to display the prices that will trigger filter movement.
Custom bar colors are included. The color scheme is based on the filtered price trend."
Thanks to Donovan Wall...
Enjoy!

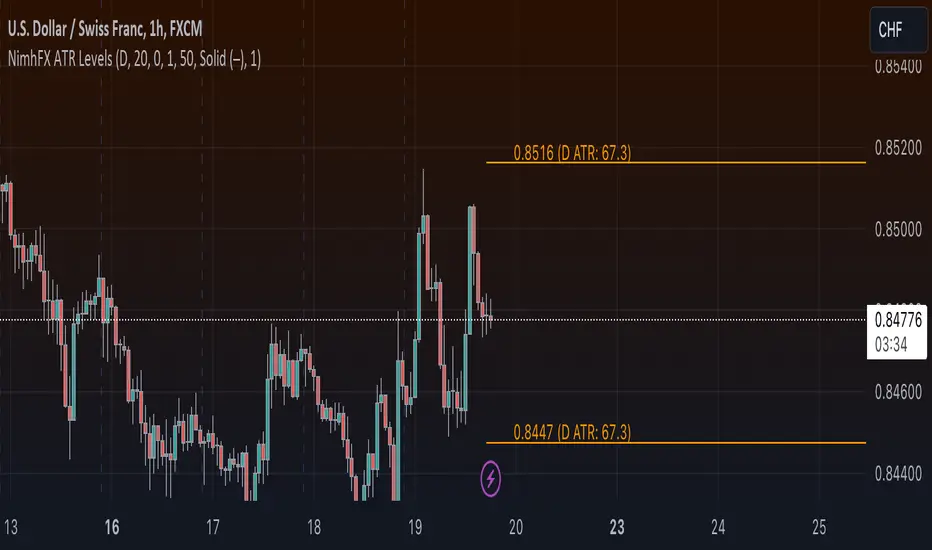
NimhFX Daily ATR High/Low Levels Creates an upper and lower level based on the ATR for your selected period. Calculation is based on the following;
Shift Variable works by allowing calculation from x-periods back.
Upper band = (Daily Low + ATR)
Lower Band = (Daily High - ATR)
Weekdays HeatmapA utility tool for getting interesting weekdays statistics.
Features
26 sources (standard prices, volumes, ranges)
Readable and optimized code
How to interpret
The darker the color, the stronger the weekday dominance
Supported sources/metrics
open
high
low
close
oo2 , (open + previous open) / 2
oh2 , (open + high) / 2
ol2 , (open + low) / 2
oc2 , (open + close) / 2
hh2 , (high + previous high) / 2
hl2 , median price
hc2 , (high + close) / 2
ll2 , (low + previous low) / 2
lc2 , (low + close) / 2
cc2 , (close + previous close) / 2
hlc3 , typical price
ohlc4
weighted close , (2 * close + high + low) / 4
true range
double true range , by Cynthia Kase
open/close range
high/low range
volume
tick volume
net volume
on balance volume
acc/dist , accumulation/distribution line
price volume trend
trade value , volume * close * pipvalue
How to get access
PM me for more details

ATR Entries & Stop Loss [Jigga]This is a simple script that displays multiples of ATR and shows you where the potential zones for longing and shorting are. The majority of people use ATR as a stop loss, so we can use it for our advantage and get in when they are stopped out. There is also a possibility to add a stop loss, so a trader can lose little when he is wrong and maximize profit when he is right. It works the best in ranging markets.
Do not forget to always use a proper stop loss and risk management.
Here you can see it in action:
BTC - BitMex - Range bound market
