RealTime Max LeverageEver wanted a script that could tell you what is the maximum reasonably safe leverage if you were to open a trade and hold it for a given number of candles? This is it!
Using rate of change based volatility and the maximum expected number of candles/periods you will hold your trade for, based on your risk profile this indicator will tell you what is the maximum reasonable leverage.
Stop losses / take profits or some other prudent exit strategy should not be avoided. The idea is effectively to prevent yourself from using leverage that is too risky for the current market conditions on whatever timeframe you are entering your trade based on.
If you have any suggestions on how to improve the indicator, please leave a comment below!
Riskmanagementstrategy

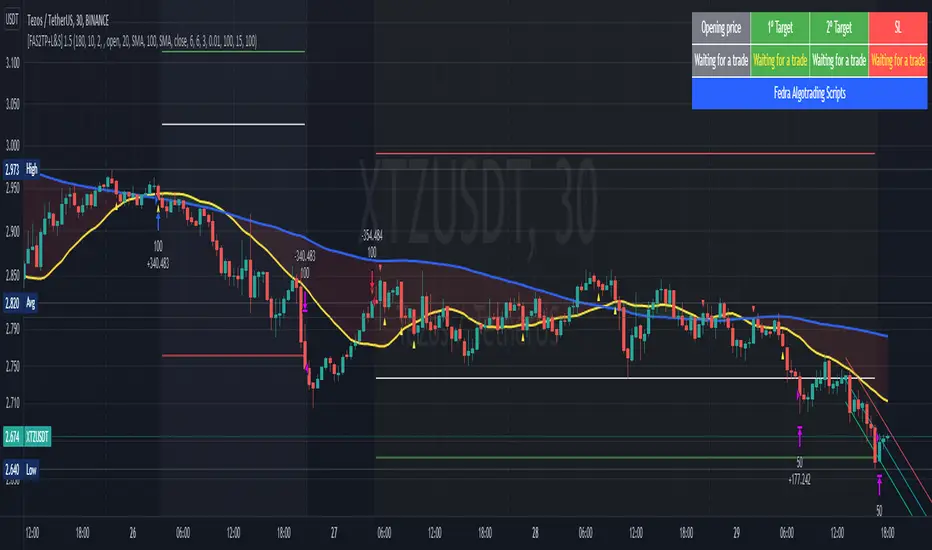
[Fedra Algotrading Strategy 2tp+L&S] Futures Long or ShortStrategy for crypto market, designed for automatic algorithmic trading with bots.
Can place long and short orders
Calculates your entries based on the breakout of the simple deviation of the linear regression of the last X periods.
Configures TP (green line) and SL (red line) percentages, the TP is a trailing TP.
Optionally, you can set a first TP (white line) that sells half of the position.
Advanced trend filter to not open trades against the market. SMA (yellow line), WMA (blue line) and secret sauce
Includes an advanced system to control the backtest period (choose how many days to backtest).
Risk management by volume of capital or amount of losing trades (kill switches that will exit the trade and stop the script)
The script includes default commissions of 0.2% per trade (configurable).
- Dinamic table with Price positions to plan your limit orders if you are trading manually
- Highly customizable and optimizable.
If you want to trade longs and shorts, it is advisable to create 2 different alerts. In most cases, the optimal parameters for longs are not the same as for shorts. In a forthcoming update I will enable separate configurations.
For better performance the script uses real time price information, for this reason Tradingview may warn you that there is "repainting", as the backtest information does not contain the information of each tick but only the open, close, high and low values of each candle.
To avoid this, you can disable the "calculate on every tick" option from the strategy settings panel.
SuperTrend Multiple Risk Management SystemThis is an improved SuperTrend strategy that makes use of multiple types of risk management options.
We have for example :
1. Take profit and stop loss levels based on support and resistence created with RSI and Pivot Lines(dynamic)
For example, if we have an oversold level and a pivot low , we can take that low point for support.(or resistence for short)
If instead we have an overbought level and a pivot high, we can take that high point for resistence.(orsupport for short)
2. Take profit and stop loss levels based on swing low and swing high points calculated with highest high and lowest low function(dynamic)
For example we take the lowest point in the last 100 candles. We calculate the distance from the current point to that one, and we apply this value as a take profit point. Same for stop loss
3. Take profit and stop loss levels based on % movements(fixed)
For example we have a tp or sl of 10%. If either of them make a movement of 10% from the entry point, they will get triggered.
4. Break even stop loss once the asset moves certain % in our direction.
For example we have a long breakeven of 5%. If the asset moves 5% in our direction, we move the stop loss on the entry point so if the trade pullback and crosses with this point it will exit from the trade.
Notes:
All the exits from the strategy are happening at the end of the candle close, since we are checking if inside the current candle we cross with either high or low of the candles parts the set prices from any of the above options.
At the same time we can combine multiple of them into one, and we can either exit based on which one was hit first, or use a quantity reduction of the trade and exit multiple times when we hit any of the levels.
This tool is for educational purpose only.
Its main purpose is to show the difference between having a risk management or without.
For example on this scenario of BTC USD 4h, I found out that the drawdawn was reduced by more than half when using different type of risk management, compared to not use one at all, while at the same time increasing the profits by a huge margin.

BTC Risk Metric - Estimates the risk of BTC price versus the USD
- To be used on the daily timeframe
- Works best on a BTC pair that has a lot of bars, e.g. The Bitcoin All Time History Index
- 0 is the lowest risk, 1 is the highest risk
- Historically, buying when the risk was low and selling when the risk was high would have yielded good ROI
- The risk bands are 0.1 in width and are highlighted on the plot
Typical Strategy:
- weighted DCA into the market when risk <0.5, do nothing between 0.5-0.6 and weighted DCA out of the market when risk >0.6
- x = buy amount per DCA interval
- y = 1/10th total BTC held by the user
- if 0 ≤ Risk < 0.1 then buy 5x
- if 0.1 ≤ Risk < 0.2 then buy 4x
- if 0.2 ≤ Risk < 0.3 then buy 3x
- if 0.3 ≤ Risk < 0.4 then buy 2x
- if 0.4 ≤ Risk < 0.5 then buy x
- if 0.5 ≤ Risk < 0.6 then do nothing
- if 0.6 ≤ Risk < 0.7 then sell y
- if 0.7 ≤ Risk < 0.8 then sell 2y
- if 0.8 ≤ Risk < 0.9 then sell 3y
- if 0.9 ≤ Risk ≤ 1.0 then sell 4y

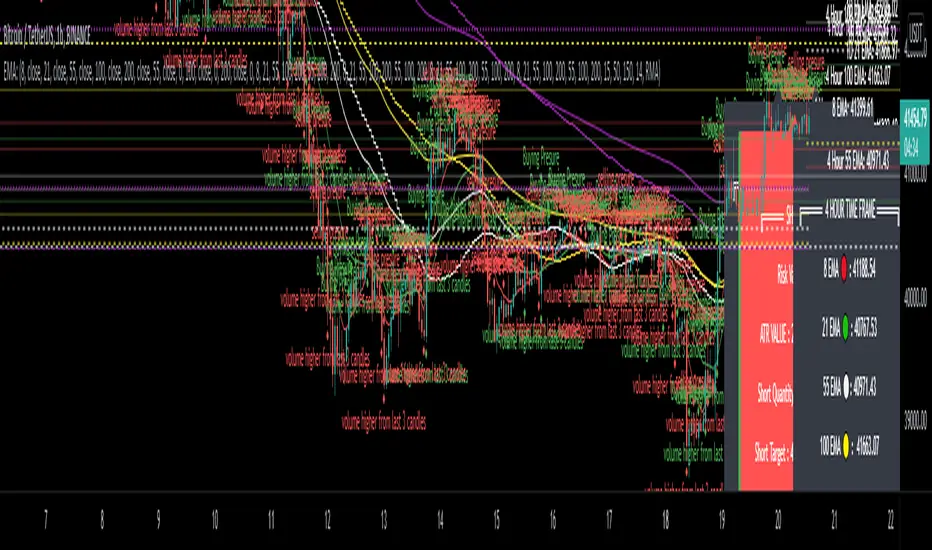
EMA - MA 21/55/100/200 with Horizontal Lines and LabelsThis indicator will help you to get dynamic support lines of EMA 21,55,100,200 and MA 55,100,200. You can get the Price of EMA And MA in Labels also.
SOLID LINES - 4 HOUR
DOTTED LINES - 1 DAY
DASHED LINE - 1 HOUR
Hope It will help you.
Trade with your own risk. I am not liable for any loss and profit based on this indicator.
Thank you.
Risk Management: Position Size & Risk RewardHere is a Risk Management Indicator that calculates stop loss and position sizing based on the volatility of the stock. Most traders use a basic 1 or 2% Risk Rule, where they will not risk more than 1 or 2% of their capital on any one trade. I went further and applied four levels of risk: 0.25%, 0.50%, 1% and 2%. How you apply these different levels of risk is what makes this indicator extremely useful. Here are some common ways to apply this script:
• If the stock is extremely volatile and has a better than 50% chance of hitting the stop loss, then risk only 0.25% of your capital on that trade.
• If a stock has low volatility and has less than 20% change of hitting the stop loss, then risk 2% of your capital on that trade.
• Risking anywhere between 0.25% and 2% is purely based on your intuition and assessment of the market.
• If you are on a losing streak and you want to cut back on your position sizing, then lowering the Risk % can help you weather the storm.
• If you are on a winning streak and your entries are experiencing a higher level of success, then gradually increase the Risk % to reap bigger profits.
• If you want to trade outside the noise of the market or take on more noise/risk, you can adjust the ATR Factor.
• … and whatever else you can imagine using it to benefit your trading.
The position size is calculated using the Capital and Risk % fields, which is the percentage of your total trading capital (a.k.a net liquidity or Capital at Risk). If you instead want to calculate the position size based on a specific amount of money, then enter the amount in the Custom Risk Amt input box. Any amount greater than 0 in the Custom Risk Amt field will override the values in the Capital and Risk % fields.
The stop loss is calculated by using the ATR. The default setting is the 14 RMA, but you can change the length and smoothing of the true range moving average to your liking. Selecting a different length and smoothing affects the stop loss and position size, so choose these values very carefully.
The ATR Factor is a multiplier of the ATR. The ATR Factor can be used to adjust the stop loss and move it outside of the market noise. For the more volatile stock, increase the factor to lower the stop loss and reduce the chance of getting stopped out. For stocks with less volatility , you can lower the factor to raise the stop loss and increase position size. Adjusting the ATR Factor can also be useful when you want the stop loss to be at or below key levels of support.
The Market Session is the hours the market is open. The Market Session only affects the Opening Range Breakout (ORB) option, so it’s important to change these values if you’re trading the ORB and you’re outside of Eastern Standard Time or you’re trading in a foreign exchange.
The ORB is a bonus to the script. When enabled, the indicator will only appear in the first green candle of the day (09:30:00 or 09:30 AM EST or the start time specified in Market Session). When using the ORB, the stop loss is based on the spread of the first candle at the Open. The spread is the difference between the High and Low of the green candle. On 1-day or higher timeframes, the indicator will be the spread of the last (or current) candle.
The output of the indicator is a label overlaying the chart:
1. ATR (14 RMA x2) – This indicated that the stop loss is determined by the ATR. The x2 is the ATR Factor. If ORB is selected, then the first line will show SPREAD, instead of ATR.
2. Capital – This is your total capital or capital at risk.
3. Risk X% of Capital – The amount you’re risking on a % of the Capital. If a Custom Risk Amt is entered, then Risk Amount will be shown in place of Capital and Risk % of Capital.
4. Entry – The current price.
5. Stop Loss – The stop loss price.
6. -1R – The stop loss price and the amount that will be lost of the stop loss is hit.
7. – These are the target prices, or levels where you will want to take profit.
This script is primarily meant for people who are new to active trading and who are looking for a sound risk management strategy based on market volatility . This script can also be used by the more experienced trader who is using a similar system, but also wants to see it applied as an indicator on TradingView. I’m looking forward to maintaining this script and making it better in future revisions. If you want to include or change anything you believe will be a good change or feature, then please contact me in TradingView.

Full strategy AllinOne with risk management MACD RSI PSAR ATR MAHey, I am glad to present you one of the strategies where I put a lot of time in it.
This strategy can be adapted to all type of timecharts like scalping, daytrading or swing.
The context is the next one :
First we have the ATR to calculate our TP/SL points. At the same time we have another rule once we enter(we enter based on % risk from total equity, in this example 1%, at the same time, lowest ammount for this example is 0.1 lots, but can be modified to 0.01), so we can exit both by tp/sl points, or by losing 1% of our equity or winning 1% of our total equity. It's dinamic.
The strategy is made from
Trend direction :
PSAR
First confirmation point :
Crossover between 10EMA and Bollinger bands middle point
Second confirmation
MACD histogram
Third confirmation
RSI overbought/oversold levels
For entries : we check trend with psar, then once ema cross bb middle point, we confirm together with rsi level for overbought/oversold and macd histogram ( > 0 or <0).
We exit, when we have opposite sign, like from buy to sell or sell to buy, or when we reach tp/sl points, or when we reach % basaed equity points.
It can be changed to be fixed lots, or fixed tp/sl , you just have to uncomment the size from entries, and tp/sl lines.
At the same time, it has the possibility if one desires, to trade only concrete forex session like european, asian and so on for intraday trading.
Hope you enjoy it.
Let me know how it goes.

Trend spider glueThis script works on all market types.
This script will show you when to long, short, exit (stop loss) and Take profit.
Signals take into account various elements such as momentum, volume , moving averages and long term trend analysis. Stop loss function is included to show you when a signal is invalidated.
Use this strategy strictly, patiently and with discipline to prevent unneeded losses, this will result in long term consistent profits.
This script has been set to work best on the intraday time frames, however it also works on the longer timeframes. Use the settings tab to dilute the indicators to ur own market.
Lastly, this indicator will not give signals if the market is not trending.
PM me here to get a free trial for the indicator !
HAPPY TRADING <3
Version 2 will be coming soon which will integerate more elements to allow for more accurate signals and faster stop losses !
disclaimer: although this indicator is taking many elements into account and is highly accurate the market is never certain, we are not responsible for any losses the script may result in as we are not financial advisors.

Two MM Cross (Signal version)Hi everyone
This is a dummy two MM cross script to be used for the Trade Manager
I'll publish a video explaining how to use the Trade Manager as I received many questions.
This was my fault for not being clear enough. A video will do great wonders here
Dave

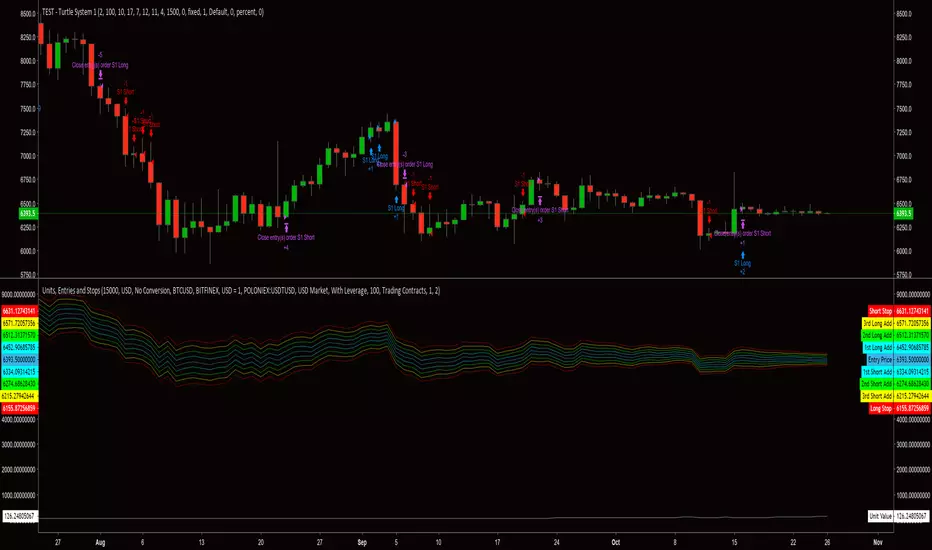
Order Size (Units) and Entry/Stop PricesThis is a risk management script derived from the Turtle trading system. I will define what is needed for each input and will also include a brief description about the intended implementation of the risk management strategy. The risk strategy can be used with any trading strategy. This script displays the order size as a unit. 1 unit is the intended size of an entry, first or adds. If trading contracts, Unit Value is presented in terms of number of contracts. If NOT, Unit Value is presented in terms of total cost for a unit in the currency of the market being traded.
::Inputs::
"Available Capital:" - This number should be the TOTAL amount of capital for use in trading account. DO NOT adjust for leverage. The default available capital is set at 15000.
"Account Currency:" - This should be the currency type for the amount entered into "Available Capital:".
"Does Account Currency Need To Be Converted?" - The currency type of "Available Capital:" must match the currency type of the market being traded. If the value of capital is not known for the market currency type, this option will perform the necessary calculation.
"Exchange used to derive BTC value" - This option is used to determine the exchange rate for currency conversions.
"Market Being Traded:" - This option reflects the trading pair of the asset being traded.
"Trading with leverage?" - This option will allow a user-specified constant value (i.e. leverage factor) to be used for calculating the account balance and number of units (i.e. order size). This is option is set to "No Leverage" by default, which will only allow the specified available capital to be used for balance and unit calculations.
"Amount of Leverage? (1-100)" - This number is the leverage factor being applied to the account per trade (e.g. 2.5, 5, 25, 50, 100). The default leverage factor is 100.
"Trading Contracts?" - This option will allow a user-specified value, for contracts, to be used when calculating unit value per order. This option is intended to be used when trading a derivative product (e.g. a contract.)
"Cost Per Contract" - This number should be equal to the value of the derivative, quoted in dollars. (e.g. Bitmex contracts are valued at $1, so the cost per contract = 1. Deribit offers contracts valued at $10, so the cost per contract =10.)
"Risk Percent" - This number should be the percent of capital you are willing to risk for each trade. (e.g. A $10,000 trading account using 2% risk would risk LOSING $20 on a trade.) Increasing or decreasing the risk amount will adjust stops and adds. This strategy would normally consider the total account equity when calculating the size of every new position. Currently, this indicator only calculates on the amount entered into the "Available Capital:" field. I plan to address this factor before implementing the script into the final complete trading strategy script. The default risk percent is set at 2.
Please remember, this indicator is technically in a testing phase. It makes up only a small piece of what will be a much more involved script.
***I am having some trouble with getting correct calculations when trading "BTC Market". I have yet to determine if the issue is due to the TradingView feeds or if the issue is in the actual code. I have, so far, calculated differences of 15-30% when comparing an asset value between it's trading pairs. I am always open to ideas and suggestions.***