ROI Levels IndicatorROI Levels Indicator 📈💰
Description: The "ROI Levels Indicator" helps you visualize key Return on Investment (ROI) levels directly on your chart, making it easier to track your profit milestones! 🚀 This tool allows you to enter your entry price, and it calculates levels from 100% up to 1000% ROI, each with a spread to represent potential support and resistance zones. The levels are visually represented by red rectangles to help identify zones where the market might react. This is a great way for traders to easily understand profit-taking points and psychological price levels!
Features:
🛠️ Custom Entry Price: Set your own entry price to start calculating ROI levels.
📊 Multiple ROI Levels: Levels from 100% to 1000%, with a customizable spread for visual clarity.
🔴 Visual Representation: Each level is marked with a full-screen-width rectangle and label, making it easy to track.
🚨 Entry Price Plot: A red dashed line marks your entry price for easy reference.
How to Use:
Enter Your Price: Use the "Entry Price" input field to specify the entry price of your trade.
Spread Adjustment: Adjust the spread percentage if you want more or less tolerance around each ROI level.
View the Levels: The script automatically plots 100% to 1000% ROI levels. Each level is represented by a red rectangle and labeled on the right side for quick identification.
Track Profit Zones: Use the plotted ROI levels to identify key profit-taking areas or potential zones of support and resistance.
Pro Tip: Use these levels as reference points to decide when to scale out of positions or manage risk effectively! 🎯
Happy trading, and may your ROI always be on the rise! 📈🔥
ROI

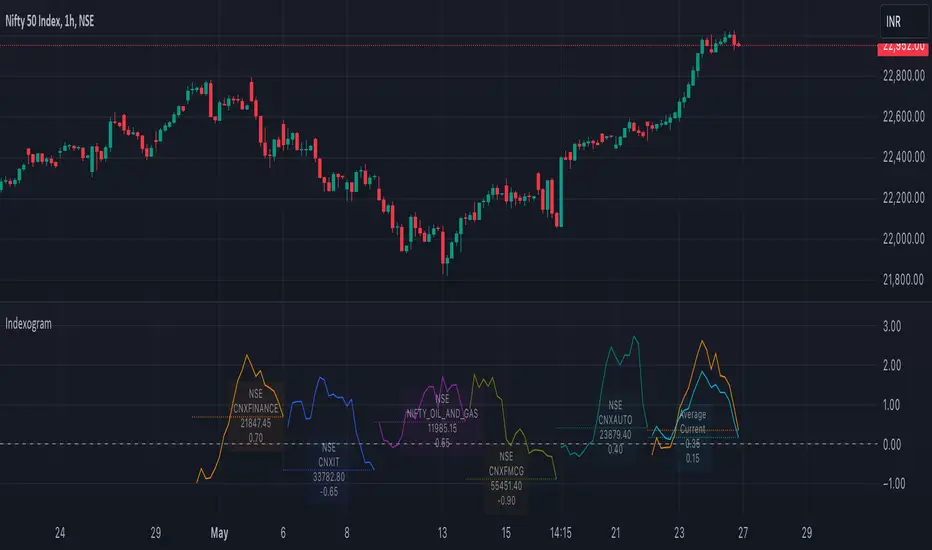
IndexogramIndexogram is a platform designed to help traders analyze the Commitment of Traders (COT) report data. It specifically focuses on the Rate Of Change (ROC) of the COT data, visualized using a unique polyline plotting technique.
Commitments of Traders % Rate Of Change (%ROC):
The COT %ROC indicates the momentum of trader positions over a specified period. This measure is crucial for understanding shifts in market sentiment and potential future price movements.
Unique Polyline Plotting Technique:
Unlike traditional line or bar charts, the polyline plotting technique used in Indexogram offers a more nuanced and detailed view of the %ROC data.
Multiple Ticker Monitoring:
Indexogram allows the setup of up to five different tickers. Traders can assign different weightages to these tickers, enabling a customized and weighted view of their %ROC data. This feature is beneficial for tracking a diversified portfolio or comparing different assets.
Average ROI Plot:
An additional feature is the Average ROI plot, which provides the average return on investment (ROI) of the five selected tickers. This plot helps traders quickly assess the overall performance of their monitored assets.
Strategy for Traders
Diversified Monitoring:
By setting up five different tickers with varying weightages, traders can diversify their monitoring efforts across different assets or markets. This diversification helps in reducing risk and identifying opportunities in different sectors or asset classes.
Weightage Customization:
Assign weightages based on market conditions or personal trading strategy. For example, if a trader believes that commodities are likely to outperform equities in the near term, they can assign a higher weightage to commodities-related tickers.
Analyzing %ROC Trends:
Use the polyline plots to identify significant %ROC trends. A rising %ROC might indicate increasing momentum and a potential buying opportunity, while a falling %ROC could signal decreasing momentum and a potential selling opportunity.
Average ROI Analysis:
Use the Average ROI plot to gauge the overall performance of the selected assets. If the average ROI is positive and trending upwards, it indicates a generally favorable market condition for the monitored assets.
Tactical Adjustments:
Regularly review and adjust the selected tickers and their weightages based on changing market conditions, news, and personal insights. This flexibility allows traders to adapt their strategy in response to new information.
Important Notes:
Indexogram is a tool to identify potential tradings, not a guaranteed predictor of future price movements.
x-Period ROI by USCG_VetThis Indicator shows the Return On Investment (ROI) between the current price vs the price from x Periods ago.

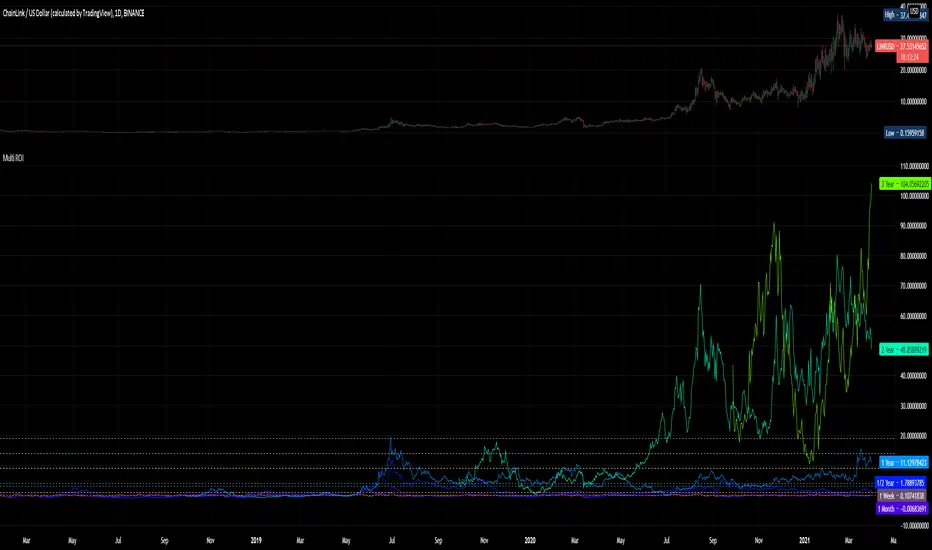
Multi ROIThis is really, really, really basic.
Its just 10 ROIs - Return On Investment- plots for the following periods:
1 week
1 month
1/2 year
1 year
2 year
3 year
4 year
5 year
6 year
7 year
It is meant for 1 day bars. Of course it will work anywhere and you can change the settings to fit your purposes but I thought these were the most useful periods.
Return on Investment (ROI)Return on Investment (ROI) is a performance measure used to evaluate the efficiency of an investment in a particular asset.
This tool provides a %-based ROI that can be calculated starting from a specific date or across the entire history of an instrument.
Don't forget to toss a coin to your witcher (see the requisites below)
