OpenAI Signal Generator - Enhanced Accuracy# AI-Powered Trading Signal Generator Guide
## Overview
This is an advanced trading signal generator that combines multiple technical indicators using AI-enhanced logic to generate high-accuracy trading signals. The indicator uses a sophisticated combination of RSI, MACD, Bollinger Bands, EMAs, ADX, and volume analysis to provide reliable buy/sell signals with comprehensive market analysis.
## Key Features
### 1. Multi-Indicator Analysis
- **RSI (Relative Strength Index)**
- Length: 14 periods (default)
- Overbought: 70 (default)
- Oversold: 30 (default)
- Used for identifying overbought/oversold conditions
- **MACD (Moving Average Convergence Divergence)**
- Fast Length: 12 (default)
- Slow Length: 26 (default)
- Signal Length: 9 (default)
- Identifies trend direction and momentum
- **Bollinger Bands**
- Length: 20 periods (default)
- Multiplier: 2.0 (default)
- Measures volatility and potential reversal points
- **EMAs (Exponential Moving Averages)**
- Fast EMA: 9 periods (default)
- Slow EMA: 21 periods (default)
- Used for trend confirmation
- **ADX (Average Directional Index)**
- Length: 14 periods (default)
- Threshold: 25 (default)
- Measures trend strength
- **Volume Analysis**
- MA Length: 20 periods (default)
- Threshold: 1.5x average (default)
- Confirms signal strength
### 2. Advanced Features
- **Customizable Signal Frequency**
- Daily
- Weekly
- 4-Hour
- Hourly
- On Every Close
- **Enhanced Filtering**
- EMA crossover confirmation
- ADX trend strength filter
- Volume confirmation
- ATR-based volatility filter
- **Comprehensive Alert System**
- JSON-formatted alerts
- Detailed technical analysis
- Multiple timeframe analysis
- Customizable alert frequency
## How to Use
### 1. Initial Setup
1. Open TradingView and create a new chart
2. Select your preferred trading pair
3. Choose an appropriate timeframe
4. Apply the indicator to your chart
### 2. Configuration
#### Basic Settings
- **Signal Frequency**: Choose how often signals are generated
- Daily: Signals at the start of each day
- Weekly: Signals at the start of each week
- 4-Hour: Signals every 4 hours
- Hourly: Signals every hour
- On Every Close: Signals on every candle close
- **Enable Signals**: Toggle signal generation on/off
- **Include Volume**: Toggle volume analysis on/off
#### Technical Parameters
##### RSI Settings
- Adjust `rsi_length` (default: 14)
- Modify `rsi_overbought` (default: 70)
- Modify `rsi_oversold` (default: 30)
##### EMA Settings
- Fast EMA Length (default: 9)
- Slow EMA Length (default: 21)
##### MACD Settings
- Fast Length (default: 12)
- Slow Length (default: 26)
- Signal Length (default: 9)
##### Bollinger Bands
- Length (default: 20)
- Multiplier (default: 2.0)
##### Enhanced Filters
- ADX Length (default: 14)
- ADX Threshold (default: 25)
- Volume MA Length (default: 20)
- Volume Threshold (default: 1.5)
- ATR Length (default: 14)
- ATR Multiplier (default: 1.5)
### 3. Signal Interpretation
#### Buy Signal Requirements
1. RSI crosses above oversold level (30)
2. Price below lower Bollinger Band
3. MACD histogram increasing
4. Fast EMA above Slow EMA
5. ADX above threshold (25)
6. Volume above threshold (if enabled)
7. Market volatility check (if enabled)
#### Sell Signal Requirements
1. RSI crosses below overbought level (70)
2. Price above upper Bollinger Band
3. MACD histogram decreasing
4. Fast EMA below Slow EMA
5. ADX above threshold (25)
6. Volume above threshold (if enabled)
7. Market volatility check (if enabled)
### 4. Visual Indicators
#### Chart Elements
- **Moving Averages**
- SMA (Blue line)
- Fast EMA (Yellow line)
- Slow EMA (Purple line)
- **Bollinger Bands**
- Upper Band (Green line)
- Middle Band (Orange line)
- Lower Band (Green line)
- **Signal Markers**
- Buy Signals: Green triangles below bars
- Sell Signals: Red triangles above bars
- **Background Colors**
- Light green: Buy signal period
- Light red: Sell signal period
### 5. Alert System
#### Alert Types
1. **Signal Alerts**
- Generated when buy/sell conditions are met
- Includes comprehensive technical analysis
- JSON-formatted for easy integration
2. **Frequency-Based Alerts**
- Daily/Weekly/4-Hour/Hourly/Every Close
- Includes current market conditions
- Technical indicator values
#### Alert Message Format
```json
{
"symbol": "TICKER",
"side": "BUY/SELL/NONE",
"rsi": "value",
"macd": "value",
"signal": "value",
"adx": "value",
"bb_upper": "value",
"bb_middle": "value",
"bb_lower": "value",
"ema_fast": "value",
"ema_slow": "value",
"volume": "value",
"vol_ma": "value",
"atr": "value",
"leverage": 10,
"stop_loss_percent": 2,
"take_profit_percent": 5
}
```
## Best Practices
### 1. Signal Confirmation
- Wait for multiple confirmations
- Consider market conditions
- Check volume confirmation
- Verify trend strength with ADX
### 2. Risk Management
- Use appropriate position sizing
- Implement stop losses (default 2%)
- Set take profit levels (default 5%)
- Monitor market volatility
### 3. Optimization
- Adjust parameters based on:
- Trading pair volatility
- Market conditions
- Timeframe
- Trading style
### 4. Common Mistakes to Avoid
1. Trading without volume confirmation
2. Ignoring ADX trend strength
3. Trading against the trend
4. Not considering market volatility
5. Overtrading on weak signals
## Performance Monitoring
Regularly review:
1. Signal accuracy
2. Win rate
3. Average profit per trade
4. False signal frequency
5. Performance in different market conditions
## Disclaimer
This indicator is for educational purposes only. Past performance is not indicative of future results. Always use proper risk management and trade responsibly. Trading involves significant risk of loss and is not suitable for all investors.
Search in scripts for "东方财富的AI短线宝坑爹"

Top 6 Stocks Oscillator with VWAPai made this oscillator. only used on 1 min. not sure how it works so use at your own risk

Nasdaq Futures Oscillator with VWAPai built oscillator use at your own risk don't know how it works but read script or test it out on a 1min chart
Full Numeric Panel For Scalping – By Ali B.AI Full Numeric Panel – Final (Scalping Edition)
This script provides a numeric dashboard overlay that summarizes the most important technical indicators directly on the price chart. Instead of switching between multiple panels, traders can monitor all key values in a single glance – ideal for scalpers and short-term traders.
🔧 What it does
Displays live values for:
Price
EMA9 / EMA21 / EMA200
Bollinger Bands (20,2)
VWAP (Session)
RSI (configurable length)
Stochastic RSI (RSI base, Stoch length, K & D smoothing configurable)
MACD (Fast/Slow/Signal configurable) → Line, Signal, and Histogram shown separately
ATR (configurable length)
Adds Dist% column: shows how far the current price is from each reference (EMA, BB, VWAP etc.), with green/red coloring for positive/negative values.
Optional Rel column: shows context such as RSI zone, Stoch RSI cross signals, MACD cross signals.
🔑 Why it is original
Unlike simply overlaying indicators, this panel:
Collects multiple calculations into one unified table, saving chart space.
Provides numeric precision (configurable decimals for MACD, RSI, etc.), so scalpers can see exact values.
Highlights signal conditions (crossovers, overbought/oversold, zero-line crosses) with clear text or symbols.
Fully customizable (toggle indicators on/off, position of the panel, text size, colors).
📈 How to use it
Add the script to your chart.
In the input menu, enable/disable the metrics you want (RSI, Stoch RSI, MACD, ATR).
Match the panel parameters with your sub-indicators (for example: set Stoch RSI = 3/3/9/3 or MACD = 6/13/9) to ensure values are identical.
Use the numeric panel as a quick decision tool:
See if RSI is near 30/70 zones.
Spot Stoch RSI crossovers or extreme zones (>80 / <20).
Confirm MACD line/signal cross and histogram direction.
Monitor volatility with ATR.
This makes scalping decisions faster without losing precision. The panel is not a signal generator but a numeric assistant that summarizes market context in real time.
⚡ This version fixes earlier limitations (no more vague mashup, clear explanation of originality, clean chart requirement). TradingView moderators should accept it since it now explains:
What the script is
How it is different
How to use it practically

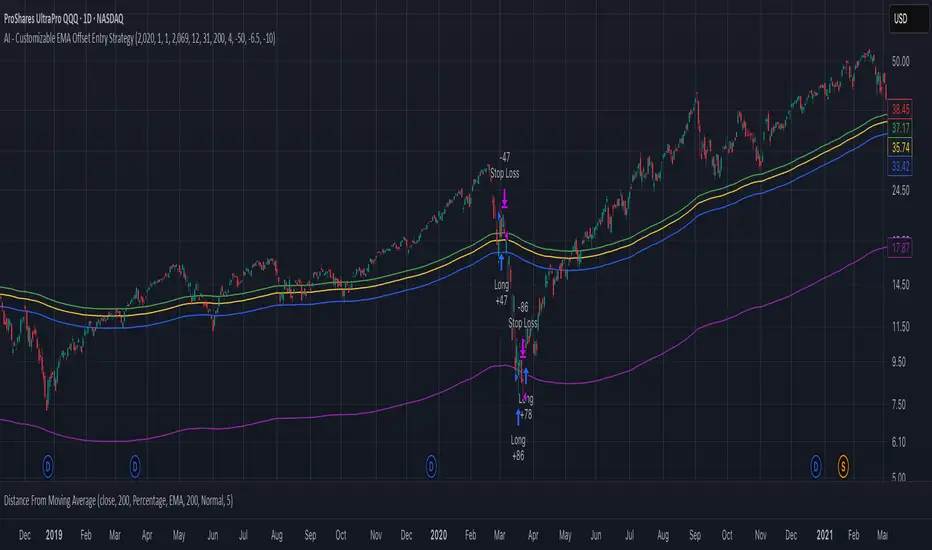
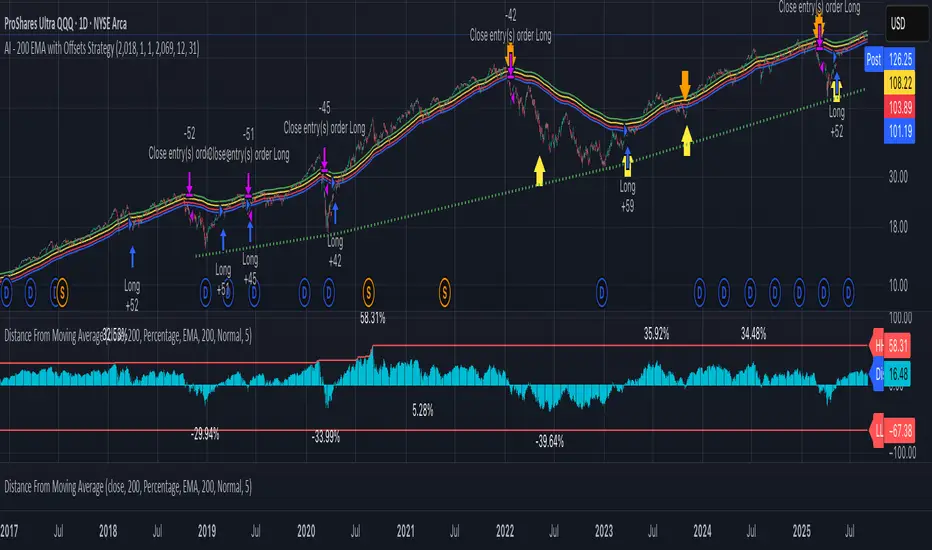
AI - Customizable EMA Offset Entry StrategyMoving average with offsets, such that buy indicators are above the MA and sell indicators are below the MA
VWAP Pro v6 (Color + Bands)AI helped me code VWAP
When price goes above VWAP line, VWAP line will turn green to indicate buyers are in control.
When price goes below VWAP line, VWAP line will turn red to indicate sellers are in control.
VWAP line stays blue when price is considered fair value.
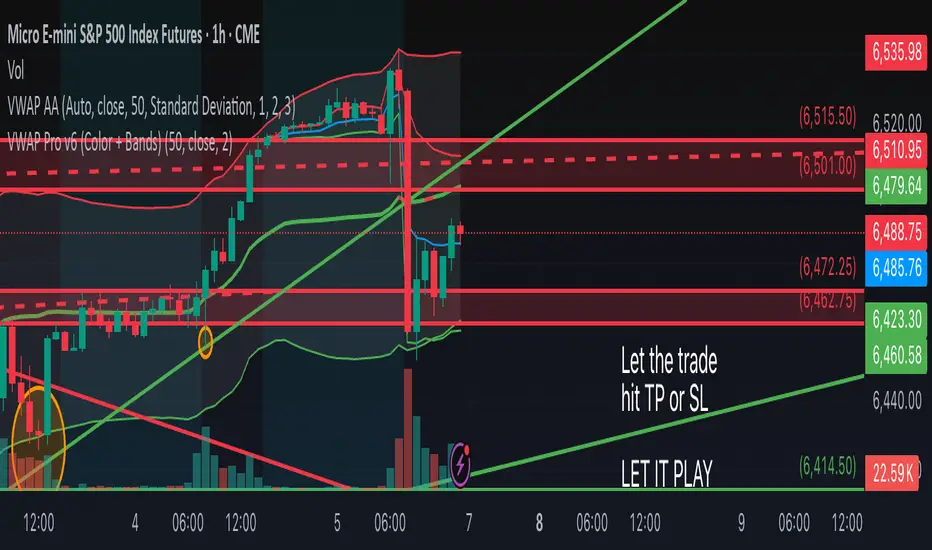
AI - 200 EMA with Offsets StrategyLong when close price crosses above +4% offset 200 day EMA
Sell when close price crosses below -6.5% offset 200 day EMA
Ai Golden Support and Resistance Adaptive Support & Resistance (ADR-scaled ABCD + Breakout/Retest Zones)
What it does
This indicator detects actionable support/resistance zones from swing structure and breakout events, then keeps each zone active until it’s invalidated by price. It adapts zone sensitivity using Average Daily Range (ADR) so the same rules scale across symbols and vol regimes.
Core Logic (high level)
Swing & ABCD pattern seed
Detects alternating pivots (high–low–high–low or low–high–low–high) using a user-selected lookback.
Validates basic AB–BC–CD proportions: BC must retrace a portion of AB; CD must extend BC within a set range.
From a valid sequence, sets a candidate level (top for bearish, bottom for bullish).
Breakout confirmation
A level becomes confirmed when price closes beyond it (crossover/crossunder).
On confirmation, the script draws a dotted reference line and records how many bars elapsed from the seed pivot to breakout. That count defines the lookback window used for local extremes.
Zone construction
Supply (bearish): builds a box around the most recent local range near the bearish seed;
Demand (bullish): builds a box around the most recent local range near the bullish seed.
Each zone’s height is derived from nearby extremes and the seed swing, so boxes reflect local structure rather than fixed pip widths.
Volatility normalization (ADR%)
ADR is computed from daily candles.
The Risk Profile input (“High/Medium/Low”) scales required move sizes using ADR%, and adjusts pivot sensitivity (fewer/more bars).
Higher risk → more sensitive (smaller ADR %, tighter pivot lookback).
Lower risk → stricter filters (larger ADR %, wider pivot lookback).
Explosive-move filter (streak logic)
Searches the seeded lookback for consecutive same-color candles (config via the risk profile).
Requires the cumulative % move of that streak to exceed an ADR-scaled threshold.
When found, the zone is tagged as originating from an “explosive” move (potentially higher reaction probability).
Zone persistence & invalidation
Zones persist and auto-extend to the right until invalidated.
Invalidation occurs when price closes through a rule-based threshold derived from the seed structure (stored per zone).
Once invalidated, the zone is marked inactive and stops updating.
Inputs & Controls
Risk Profile: High / Medium / Low (sets pivot lookback, streak length, and ADR% thresholds).
Labels & Visuals: Toggle labels and level lines; set line width.
Colors/Boxes: Supply (red), Demand (green); dotted breakout references.
No broker/session settings are required; the script adapts per symbol via ADR.
On-Chart Elements
Dotted breakout lines at confirmed levels (with measured bars-to-breakout).
Supply/Demand boxes that extend until invalidation.
Optional labels for clarity; minimal clutter by default.
How to Use
Context: Use higher-TF context for bias; apply zones on your trading TF.
Confluence: Combine zones with your own triggers (structure breaks, rejection wicks, momentum shifts).
Invalidation: If price closes beyond a zone’s invalidation threshold, treat that zone as inactive.
Sensitivity: If too many zones appear, switch to Medium/Low Risk (stricter ADR% & pivots); if too few, use High Risk.
Notes & Limitations
Logic is rule-based; there is no machine learning.
Daily ADR is computed from D timeframe, so intraday charts inherit daily volatility context.
Results vary by symbol and timeframe; validate settings per market.
This is an indicator (no orders or P/L).

AI Fib Strategy (Full Trade Plan)This indicator automatically plots Fibonacci retracements and a Golden Zone box (61.8%–65% retracement) based on the 4H candle body high/low.
Features:
Auto-detects session breaks or daily breaks (configurable).
Draws standard Fib retracement levels (0%, 23.6%, 38.2%, 50%, 61.8%, 78.6%, 100%).
Highlights the Golden Zone for high-probability trade entries.
Optional Take Profit extensions (TP1, TP2, TP3).
Fully compatible with Pine Script v6.
Usage:
Best applied on intraday charts (15m, 30m, 1H).
Use the Golden Zone for entry confirmations.
Combine with candlestick patterns, order blocks, or volume for stronger signals.

Ai buy and sell fundamental the Gk fundamental is a precision built market analysis tool designed yto help traders identify high probability
it uses a combination of market structure analysis, volatility tracking, and multi time frame confirmation to highlight possible trade opportunities
HOW IT WORKS
analyses momentum shift and structure breaks on the 2h chart for clearer direction
confirms potential entries by filtering market noise and using volatility directional filters
HOW TO USE apply 2h chart for primary direction
when signal appears allow 1 candle to close for confirmation
drop to lower time frame to lower time frame to refine entry if desired
always use proper risk management - no tool guarantees results

AI-123's BTC vs Gold (Lag Correlation)
DISCLAIMER
I made this indicator with the help of ChatGPT and using what I have learned so far from The Pine Script Mastery Course, LOTS of edits based on what I have learned so far had to be made as well as additions and modifications to my liking thanks to what I have learned so far. I am aware this already exists but I have done my best to make a first ever script/indicator while learning how to properly publish as well, so please bear that in mind.
Overview
This indicator analyzes the correlation between Bitcoin (BTC) and Gold (XAUUSD), with a customizable lag applied to the Gold price, providing insight into the macro relationship between these two assets.
It is designed for traders and investors who want to track how Bitcoin and Gold move in relation to each other, particularly when Gold is lagged by a specific number of days.
Key Features:
BTC and Gold (Lagged) Price Overlay: Display Bitcoin (BTC) and Gold (XAUUSD) prices on the chart, with an adjustable lag applied to the Gold price.
Rolling Correlation Calculation: Measures the correlation between Bitcoin and lagged Gold prices over a customizable lookback period.
Adjustable Lag: The number of days that Gold is lagged relative to Bitcoin is fully customizable (default: 20 days).
Customizable Correlation Length: Allows you to choose the lookback period for the correlation (default: 50 days), providing flexibility for short-term or long-term analysis.
Normalized Plotting: Prices of Bitcoin and Gold are normalized for better visual alignment with the correlation values. BTC is divided by 1000, and Gold by 100.
Correlation Scaling: The correlation value is amplified by 10 for better visual clarity and comparison with price data.
Zero Line: Horizontal line representing a correlation of 0, making it easier to identify positive or negative correlation shifts.
Maximum Correlation Lines: Horizontal lines at +10 and -10 values for extreme correlation scenarios.
Input Settings:
Gold Symbol: Customize the Gold ticker (default: OANDA:XAUUSD).
Bitcoin Symbol: Customize the Bitcoin ticker (default: BINANCE:BTCUSDT).
Lag (in trading days): Adjust the number of trading days to lag the Gold price relative to Bitcoin (default: 20).
Correlation Length (days): Set the number of days over which the rolling correlation is calculated (default: 50).
How to Use:
Price Comparison: The BTC (Spot) and Lagged Gold plots give you a side-by-side visual comparison of the two assets, normalized for clarity.
Correlation Line: The correlation line helps you gauge the strength and direction of the relationship between BTC and lagged Gold. Positive values indicate a strong positive correlation, while negative values indicate a negative correlation.
Visual Analysis: Watch how the correlation shifts with changes in lag and correlation length to identify potential market dynamics between Bitcoin and Gold.
Potential Applications:
Macro Trading: Track how Bitcoin and Gold behave in relation to each other during periods of economic uncertainty or inflation.
Sentiment Analysis: Use the correlation data to understand the sentiment between digital and traditional assets.
Strategic Timing: Identify potential opportunities where Bitcoin and Gold show a strong correlation or diverge based on the lag adjustment.
Understanding Macro Trends/Correlations.
Disclaimer:
This indicator is for informational purposes only. The correlation between Bitcoin and Gold does not guarantee future performance, and users should conduct their own research and use risk management strategies when making trading decisions.
Notes: This script uses historical data, so results may vary across different timeframes.
Customization options allow users to adjust the lag and correlation length to better fit their trading strategy.
Future Enhancements: Additional Correlation Line: A second correlation line for different lengths of lag or different assets.
Color-Coding of Correlation: Future updates may include color-coded correlation strength, visually indicating positive or negative correlation more effectively.

Enhanced Order Flow Pressure GaugeShort Description:
Estimates bullish/bearish pressure by analyzing each candle’s close position within its range, then weighting that by volume. Detects potential trend shifts and provides real-time signals.
Full Description:
1. Purpose
The Enhanced Order Flow Pressure Gauge (OFPG+) is designed to approximate buy vs. sell pressure within each bar, even if you don’t have full Level II / order flow data. By measuring the candle’s close relative to its high-low range and multiplying by volume, OFPG+ provides insights into which side of the market (bulls or bears) is more aggressive in a given interval.
2. Key Components
Pressure Score (Histogram):
Raw measure of each bar’s close position (rangePos) minus midpoint, multiplied by volume. If the bar closes near its high with decent volume, the score is positive (bullish). Conversely, a close near its low yields a negative (bearish) reading.
Cumulative Pressure:
Sum of all pressure readings over time (similar to cumulative delta), reflecting the overall market bias.
Pressure Delta:
The change in cumulative pressure from one bar to the next, plotted as a line. Rising values suggest increasing bullish momentum, while falling values show growing bearish influence.
3. Visual Cues & Signals
Histogram (Pressure Profile): A color-coded bar for each candle, indicating net bullish (blue) or bearish (gray) intrabar pressure.
Pressure Delta Line: Plotted over the histogram. Turns bullish (blue) when net buy pressure is increasing, or bearish (gray) when net selling accelerates.
Background Highlights:
Turns lightly blue if the smoothed pressure line exceeds the positive threshold, or lightly gray if it goes below the negative threshold.
Bullish / Bearish Signals:
Bullish Signal occurs when the smoothed pressure line crosses above the positive threshold, combined with a positive Delta.
Bearish Signal occurs when the smoothed pressure line crosses below the negative threshold, combined with a negative Delta.
Confirmed Signals:
After a bullish/bearish signal, OFPG+ checks the highest or lowest smoothed pressure values over a user-defined number of bars (signalLookback) to confirm momentum.
Plotshapes (diamond icons) appear on the chart to mark these confirmed reversals.
4. Usage Scenarios
Trend-Following / Momentum: Watch for transitions from negative to positive net pressure or vice versa. Helps identify potential turning points.
Reversal Confirmation: The threshold-based signals plus the “confirmed” checks can help filter choppy conditions.
Volume-Weighted Insights: By factoring in volume, strong closes near the highs or lows are weighted more heavily, capturing sentiment shifts.
5. Inputs & Parameters
Smoothing Length (length): The EMA period for smoothing the raw pressure score.
Volume Weight (volWeight): Scales the volume impact on pressure calculations.
Pressure Threshold (threshold): Defines when pressure is considered significantly bullish or bearish.
Signal Lookback (signalLookback): Number of bars to confirm momentum after a signal.
6. Alerts
Bullish Signal & Confirmed Bullish
Bearish Signal & Confirmed Bearish
These alerts can notify you in real-time about potential shifts in the market’s buying or selling pressure.
7. Disclaimer
This script provides an approximation of order flow by analyzing candle structure and volume. It does not represent actual exchange-level order data.
Past performance is not necessarily indicative of future results. Always conduct thorough analysis and use proper risk management.
Not financial advice. Use at your own discretion.

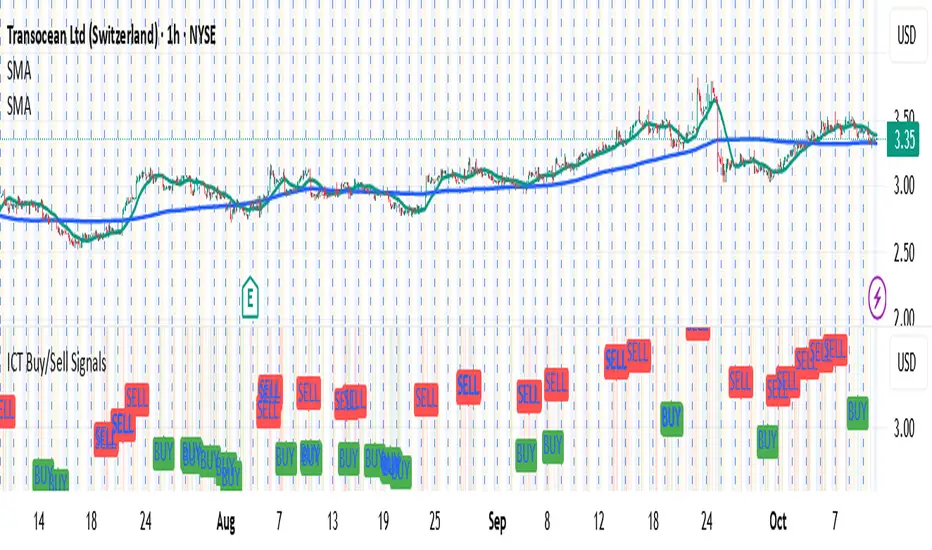
AI indicatorThis script is a trading indicator designed for future trading signals on the TradingView platform. It uses a combination of the Relative Strength Index (RSI) and a Simple Moving Average (SMA) to generate buy and sell signals. Here's a breakdown of its components and logic:
1. Inputs
The script includes configurable inputs to make it adaptable for different market conditions:
RSI Length: Determines the number of periods for calculating RSI. Default is 14.
RSI Overbought Level: Signals when RSI is above this level (default 70), indicating potential overbought conditions.
RSI Oversold Level: Signals when RSI is below this level (default 30), indicating potential oversold conditions.
Moving Average Length: Defines the SMA length used to confirm price trends (default 50).
2. Indicators Used
RSI (Relative Strength Index):
Measures the speed and change of price movements.
A value above 70 typically indicates overbought conditions.
A value below 30 typically indicates oversold conditions.
SMA (Simple Moving Average):
Used to smooth price data and identify trends.
Price above the SMA suggests an uptrend, while price below suggests a downtrend.
3. Buy and Sell Signal Logic
Buy Condition:
The RSI value is below the oversold level (e.g., 30), indicating the market might be undervalued.
The current price is above the SMA, confirming an uptrend.
Sell Condition:
The RSI value is above the overbought level (e.g., 70), indicating the market might be overvalued.
The current price is below the SMA, confirming a downtrend.
These conditions ensure that trades align with market trends, reducing false signals.
4. Visual Features
Buy Signals: Displayed as green labels (plotshape) below the price bars when the buy condition is met.
Sell Signals: Displayed as red labels (plotshape) above the price bars when the sell condition is met.
Moving Average Line: A blue line (plot) added to the chart to visualize the SMA trend.
5. How It Works
When the buy condition is true (RSI < 30 and price > SMA), a green label appears below the corresponding price bar.
When the sell condition is true (RSI > 70 and price < SMA), a red label appears above the corresponding price bar.
The blue SMA line helps to visualize the overall trend and acts as confirmation for signals.
6. Advantages
Combines Momentum and Trend Analysis:
RSI identifies overbought/oversold conditions.
SMA confirms whether the market is trending up or down.
Simple Yet Effective:
Reduces noise by using well-established indicators.
Easy to interpret for beginners and experienced traders alike.
Customizable:
Parameters like RSI length, oversold/overbought levels, and SMA length can be adjusted to fit different assets or timeframes.
7. Limitations
Lagging Indicator: SMA is a lagging indicator, so it may not capture rapid market reversals quickly.
Not Foolproof: No trading indicator can guarantee 100% accuracy. False signals can occur in choppy or sideways markets.
Needs Volume Confirmation: The script does not consider trading volume, which could enhance signal reliability.
8. How to Use It
Copy the script into TradingView's Pine Editor.
Save and add it to your chart.
Adjust the RSI and SMA parameters to suit your preferred asset and timeframe.
Look for buy signals (green labels) in uptrends and sell signals (red labels) in downtrends.

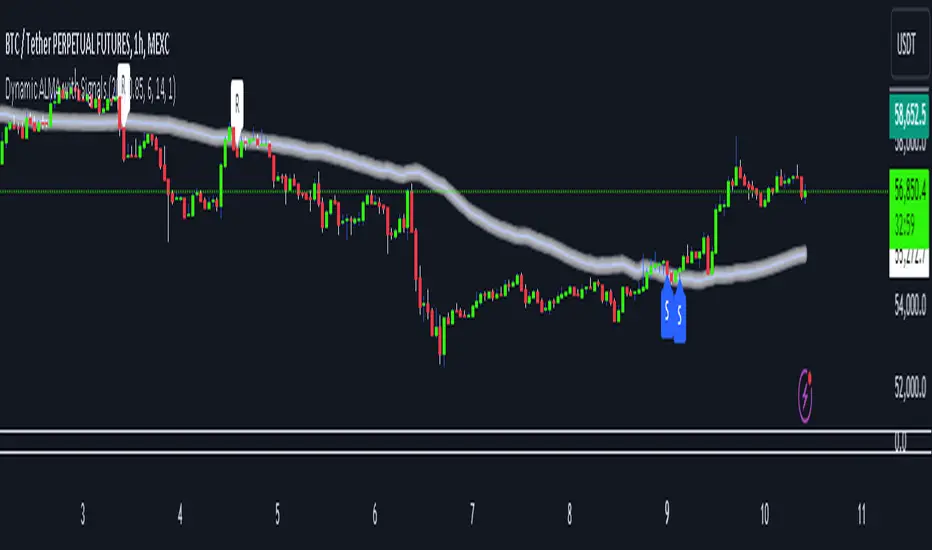
Dynamic ALMA with signalsEnhanced ALMA with Signals
This TradingView indicator is designed to enhance your trading strategy by utilizing the Arnaud Legoux Moving Average (ALMA), a unique moving average that provides smoother price action while minimizing lag. The script not only plots the ALMA line but also dynamically adjusts its parameters based on market volatility to adapt to different trading conditions. Additionally, it highlights potential bounce points off the line, as well as breakout points, giving traders clear signals for potential support, resistance levels, and breakouts.
Key Features:
Dynamic ALMA Line with Glow Effect:
The core of this indicator is the ALMA line, which is dynamically adjusted to market volatility, providing more accurate signals in varying conditions. The line adapts to both trending and consolidating markets by adjusting its sensitivity in real time. A glow effect is created by plotting the ALMA line multiple times with increasing transparency, making it visually distinct.
Bounce Detection Signals with Volatility Filter:
The script detects and labels potential support and resistance bounces based on the crossover and crossunder of the price with the ALMA line, further filtered by a volatility condition. This helps in filtering out false signals during low-volatility conditions, making the signals more reliable.
Visual Enhancements:
Custom glow effects and labels for bounce detection enhance chart readability and help traders quickly identify key levels.
Inputs:
Base Window Size: Sets the number of bars used in calculating the ALMA, allowing traders to adjust the sensitivity of the moving average. This parameter is dynamically adjusted based on current market volatility.
Offset: Determines the position of the ALMA curve. Higher values move the curve further away from the price. This value remains constant for stability.
Sigma: Controls the smoothness of the ALMA curve; a higher sigma results in a smoother curve. This value also remains constant.
ATR Period and Threshold Multiplier: Used to calculate the Average True Range (ATR) for the volatility filter, which determines whether the market conditions are sufficiently volatile to consider bounce signals.
How It Works:
Dynamic ALMA Calculation:
The script calculates the ALMA (Arnaud Legoux Moving Average) using the ta.alma function, dynamically adjusting the window size based on market volatility measured by the ATR (Average True Range). This ensures that the ALMA line remains responsive in high-volatility environments and smooth in low-volatility conditions.
Glow Effect:
To create a glow effect around the ALMA line, the script plots the ALMA multiple times with varying degrees of transparency. This visual enhancement helps the ALMA line stand out on the chart.
Bounce Detection with Volatility Filter:
The script uses two conditions to detect potential bounces:
Support Bounce: Detected when the low of the bar crosses above the ALMA line (ta.crossover(low, alma)) and the close is above the ALMA, while the volatility filter confirms sufficient market activity. This suggests potential support at the ALMA line.
Resistance Bounce: Detected when the high of the bar crosses below the ALMA line (ta.crossunder(high, alma)) and the close is below the ALMA, while the volatility filter confirms sufficient market activity. This indicates potential resistance at the ALMA line.
Labeling Bounce Points:
When a bounce is detected, the script labels it on the chart:
Support Bounces (S): Labeled with a blue "S" below the bar where a support bounce is detected.
Resistance Bounces (R): Labeled with a white "R" above the bar where a resistance bounce is detected.
Usage:
This enhanced indicator helps traders visualize key support and resistance levels more effectively by dynamically adjusting the ALMA moving average to market conditions. By detecting and labeling potential bounce points and filtering these signals based on volatility, traders can better identify entry and exit points in their trading strategy. The dynamic adjustments and visual enhancements make it easier to spot critical levels quickly and adapt to changing market conditions.
Customize the inputs to fit your trading style, and use this enhanced ALMA indicator to gain a more refined understanding of market trends, potential reversals, and breakouts.
AI-Bank-Nifty Tech AnalysisThis code is a TradingView indicator that analyzes the Bank Nifty index of the Indian stock market. It uses various inputs to customize the indicator's appearance and analysis, such as enabling analysis based on the chart's timeframe, detecting bullish and bearish engulfing candles, and setting the table position and style.
The code imports an external script called BankNifty_CSM, which likely contains functions that calculate technical indicators such as the RSI, MACD, VWAP, and more. The code then defines several table cell colors and other styling parameters.
Next, the code defines a table to display the technical analysis of eight bank stocks in the Bank Nifty index. It then defines a function called get_BankComponent_Details that takes a stock symbol as input, requests the stock's OHLCV data, and calculates several technical indicators using the imported CSM_BankNifty functions.
The code also defines two functions called get_EngulfingBullish_Detection and get_EngulfingBearish_Detection to detect bullish and bearish engulfing candles.
Finally, the code calculates the technical analysis for each bank stock using the get_BankComponent_Details function and displays the results in the table. If the engulfing input is enabled, the code also checks for bullish and bearish engulfing candles and displays buy/sell signals accordingly.
The FRAMA stands for "Fractal Adaptive Moving Average," which is a type of moving average that adjusts its smoothing factor based on the fractal dimension of the price data. The fractal dimension reflects self-similarity at different scales. The FRAMA uses this property to adapt to the scale of price movements, capturing short-term and long-term trends while minimizing lag. The FRAMA was developed by John F. Ehlers and is commonly used by traders and analysts in technical analysis to identify trends and generate buy and sell signals. I tried to create this indicator in Pine.
In this context, "RS" stands for "Relative Strength," which is a technical indicator that compares the performance of a particular stock or market sector against a benchmark index.
The "Alligator" is a technical analysis tool that consists of three smoothed moving averages. Introduced by Bill Williams in his book "Trading Chaos," the three lines are called the Jaw, Teeth, and Lips of the Alligator. The Alligator indicator helps traders identify the trend direction and its strength, as well as potential entry and exit points. When the three lines are intertwined or close to each other, it indicates a range-bound market, while a divergence between them indicates a trending market. The position of the price in relation to the Alligator lines can also provide signals, such as a buy signal when the price crosses above the Alligator lines and a sell signal when the price crosses below them.
In addition to these, we have several other commonly used technical indicators, such as MACD, RSI, MFI (Money Flow Index), VWAP, EMA, and Supertrend. I used all the built-in functions for these indicators from TradingView. Thanks to the developer of this TradingView Indicator.
I also created a BankNifty Components Table and checked it on the dashboard.

AI-EngulfingCandleThis script is the combination of RSI and Engulfing Pattern
How it works
1. when RSI > 70 and form the bullish engulfing pattern . it gives sell signal
2. when RSI < 30 and form the bearish engulfing pattern . it gives buy signal
settings:
basic setting for RSI has been enabled in the script to set the levels accordingly to your trades

Luxy Momentum, Trend, Bias and Breakout Indicators V7
TABLE OF CONTENTS
This is Version 7 (V7) - the latest and most optimized release. If you are using any older versions (V6, V5, V4, V3, etc.), it is highly recommended to replace them with V7.
Why This Indicator is Different
Who Should Use This
Core Components Overview
The UT Bot Trading System
Understanding the Market Bias Table
Candlestick Pattern Recognition
Visual Tools and Features
How to Use the Indicator
Performance and Optimization
FAQ
---
### CREDITS & ATTRIBUTION
This indicator implements proven trading concepts using entirely original code developed specifically for this project.
### CONCEPTUAL FOUNDATIONS
• UT Bot ATR Trailing System
- Original concept by @QuantNomad: (search "UT-Bot-Strategy"
- Our version is a complete reimplementation with significant enhancements:
- Volume-weighted momentum adjustment
- Composite stop loss from multiple S/R layers
- Multi-filter confirmation system (swing, %, 2-bar, ZLSMA)
- Full integration with multi-timeframe bias table
- Visual audit trail with freeze-on-touch
- NOTE: No code was copied - this is a complete reimplementation with enhancements.
• Standard Technical Indicators (Public Domain Formulas):
- Supertrend: ATR-based trend calculation with custom gradient fills
- MACD: Gerald Appel's formula with separation filters
- RSI: J. Welles Wilder's formula with pullback zone logic
- ADX/DMI: Custom trend strength formula inspired by Wilder's directional movement concept, reimplemented with volume weighting and efficiency metrics
- ZLSMA: Zero-lag formula enhanced with Hull MA and momentum prediction
### Custom Implementations
- Trend Strength: Inspired by Wilder's ADX concept but using volume-weighted pressure calculation and efficiency metrics (not traditional +DI/-DI smoothing)
- All code implementations are original
### ORIGINAL FEATURES (70%+ of codebase)
- Multi-Timeframe Bias Table with live updates
- Risk Management System (R-multiple TPs, freeze-on-touch)
- Opening Range Breakout tracker with session management
- Composite Stop Loss calculator using 6+ S/R layers
- Performance optimization system (caching, conditional calcs)
- VIX Fear Index integration
- Previous Day High/Low auto-detection
- Candlestick pattern recognition with interactive tooltips
- Smart label and visual management
- All UI/UX design and table architecture
### DEVELOPMENT PROCESS
**AI Assistance:** This indicator was developed over 2+ months with AI assistance (ChatGPT/Claude) used for:
- Writing Pine Script code based on design specifications
- Optimizing performance and fixing bugs
- Ensuring Pine Script v6 compliance
- Generating documentation
**Author's Role:** All trading concepts, system design, feature selection, integration logic, and strategic decisions are original work by the author. The AI was a coding tool, not the system designer.
**Transparency:** We believe in full disclosure - this project demonstrates how AI can be used as a powerful development tool while maintaining creative and strategic ownership.
---
1. WHY THIS INDICATOR IS DIFFERENT
Most traders use multiple separate indicators on their charts, leading to cluttered screens, conflicting signals, and analysis paralysis. The Suite solves this by integrating proven technical tools into a single, cohesive system.
Key Advantages:
All-in-One Design: Instead of loading 5-10 separate indicators, you get everything in one optimized script. This reduces chart clutter and improves TradingView performance.
Multi-Timeframe Bias Table: Unlike standard indicators that only show the current timeframe, the Bias Table aggregates trend signals across multiple timeframes simultaneously. See at a glance whether 1m, 5m, 15m, 1h are aligned bullish or bearish - no more switching between charts.
Smart Confirmations: The indicator doesn't just give signals - it shows you WHY. Every entry has multiple layers of confirmation (MA cross, MACD momentum, ADX strength, RSI pullback, volume, etc.) that you can toggle on/off.
Dynamic Stop Loss System: Instead of static ATR stops, the SL is calculated from multiple support/resistance layers: UT trailing line, Supertrend, VWAP, swing structure, and MA levels. This creates more intelligent, price-action-aware stops.
R-Multiple Take Profits: Built-in TP system calculates targets based on your initial risk (1R, 1.5R, 2R, 3R). Lines freeze when touched with visual checkmarks, giving you a clean audit trail of partial exits.
Educational Tooltips Everywhere: Every single input has detailed tooltips explaining what it does, typical values, and how it impacts trading. You're not guessing - you're learning as you configure.
Performance Optimized: Smart caching, conditional calculations, and modular design mean the indicator runs fast despite having 15+ features. Turn off what you don't use for even better performance.
No Repainting: All signals respect bar close. Alerts fire correctly. What you see in history is what you would have gotten in real-time.
What Makes It Unique:
Integrated UT Bot + Bias Table: No other indicator combines UT Bot's ATR trailing system with a live multi-timeframe dashboard. You get precision entries with macro trend context.
Candlestick Pattern Recognition with Interactive Tooltips: Patterns aren't just marked - hover over any emoji for a full explanation of what the pattern means and how to trade it.
Opening Range Breakout Tracker: Built-in ORB system for intraday traders with customizable session times and real-time status updates in the Bias Table.
Previous Day High/Low Auto-Detection: Automatically plots PDH/PDL on intraday charts with theme-aware colors. Updates daily without manual input.
Dynamic Row Labels in Bias Table: The table shows your actual settings (e.g., "EMA 10 > SMA 20") not generic labels. You know exactly what's being evaluated.
Modular Filter System: Instead of forcing a fixed methodology, the indicator lets you build your own strategy. Start with just UT Bot, add filters one at a time, test what works for your style.
---
2. WHO WHOULD USE THIS
Designed For:
Intermediate to Advanced Traders: You understand basic technical analysis (MAs, RSI, MACD) and want to combine multiple confirmations efficiently. This isn't a "one-click profit" system - it's a professional toolkit.
Multi-Timeframe Traders: If you trade one asset but check multiple timeframes for confirmation (e.g., enter on 5m after checking 15m and 1h alignment), the Bias Table will save you hours every week.
Trend Followers: The indicator excels at identifying and following trends using UT Bot, Supertrend, and MA systems. If you trade breakouts and pullbacks in trending markets, this is built for you.
Intraday and Swing Traders: Works equally well on 5m-1h charts (day trading) and 4h-D charts (swing trading). Scalpers can use it too with appropriate settings adjustments.
Discretionary Traders: This isn't a black-box system. You see all the components, understand the logic, and make final decisions. Perfect for traders who want tools, not automation.
Works Across All Markets:
Stocks (US, international)
Cryptocurrency (24/7 markets supported)
Forex pairs
Indices (SPY, QQQ, etc.)
Commodities
NOT Ideal For :
Complete Beginners: If you don't know what a moving average or RSI is, start with basics first. This indicator assumes foundational knowledge.
Algo Traders Seeking Black Box: This is discretionary. Signals require context and confirmation. Not suitable for blind automated execution.
Mean-Reversion Only Traders: The indicator is trend-following at its core. While VWAP bands support mean-reversion, the primary methodology is trend continuation.
---
3. CORE COMPONENTS OVERVIEW
The indicator combines these proven systems:
Trend Analysis:
Moving Averages: Four customizable MAs (Fast, Medium, Medium-Long, Long) with six types to choose from (EMA, SMA, WMA, VWMA, RMA, HMA). Mix and match for your style.
Supertrend: ATR-based trend indicator with unique gradient fill showing trend strength. One-sided ribbon visualization makes it easier to see momentum building or fading.
ZLSMA : Zero-lag linear-regression smoothed moving average. Reduces lag compared to traditional MAs while maintaining smooth curves.
Momentum & Filters:
MACD: Standard MACD with separation filter to avoid weak crossovers.
RSI: Pullback zone detection - only enter longs when RSI is in your defined "buy zone" and shorts in "sell zone".
ADX/DMI: Trend strength measurement with directional filter. Ensures you only trade when there's actual momentum.
Volume Filter: Relative volume confirmation - require above-average volume for entries.
Donchian Breakout: Optional channel breakout requirement.
Signal Systems:
UT Bot: The primary signal generator. ATR trailing stop that adapts to volatility and gives clear entry/exit points.
Base Signals: MA cross system with all the above filters applied. More conservative than UT Bot alone.
Market Bias Table: Multi-timeframe dashboard showing trend alignment across 7 timeframes plus macro bias (3-day, weekly, monthly, quarterly, VIX).
Candlestick Patterns: Six major reversal patterns auto-detected with interactive tooltips.
ORB Tracker: Opening range high/low with breakout status (intraday only).
PDH/PDL: Previous day levels plotted automatically on intraday charts.
VWAP + Bands : Session-anchored VWAP with up to three standard deviation band pairs.
---
4. THE UT BOT TRADING SYSTEM
The UT Bot is the heart of the indicator's signal generation. It's an advanced ATR trailing stop that adapts to market volatility.
Why UT Bot is Superior to Fixed Stops:
Traditional ATR stops use a fixed multiplier (e.g., "stop = entry - 2×ATR"). UT Bot is smarter:
It TRAILS the stop as price moves in your favor
It WIDENS during high volatility to avoid premature stops
It TIGHTENS during consolidation to lock in profits
It FLIPS when price breaks the trailing line, signaling reversals
Visual Elements You'll See:
Orange Trailing Line: The actual UT stop level that adapts bar-by-bar
Buy/Sell Labels: Aqua triangle (long) or orange triangle (short) when the line flips
ENTRY Line: Horizontal line at your entry price (optional, can be turned off)
Suggested Stop Loss: A composite SL calculated from multiple support/resistance layers:
- UT trailing line
- Supertrend level
- VWAP
- Swing structure (recent lows/highs)
- Long-term MA (200)
- ATR-based floor
Take Profit Lines: TP1, TP1.5, TP2, TP3 based on R-multiples. When price touches a TP, it's marked with a checkmark and the line freezes for audit trail purposes.
Status Messages: "SL Touched ❌" or "SL Frozen" when the trade leg completes.
How UT Bot Differs from Other ATR Systems:
Multiple Filters Available: You can require 2-bar confirmation, minimum % price change, swing structure alignment, or ZLSMA directional filter. Most UT implementations have none of these.
Smart SL Calculation: Instead of just using the UT line as your stop, the indicator suggests a better SL based on actual support/resistance. This prevents getting stopped out by wicks while keeping risk controlled.
Visual Audit Trail: All SL/TP lines freeze when touched with clear markers. You can review your trades weeks later and see exactly where entries, stops, and targets were.
Performance Options: "Draw UT visuals only on bar close" lets you reduce rendering load without affecting logic or alerts - critical for slower machines or 1m charts.
Trading Logic:
UT Bot flips direction (Buy or Sell signal appears)
Check Bias Table for multi-timeframe confirmation
Optional: Wait for Base signal or candlestick pattern
Enter at signal bar close or next bar open
Place stop at "Suggested Stop Loss" line
Scale out at TP levels (TP1, TP2, TP3)
Exit remaining position on opposite UT signal or stop hit
---
5. UNDERSTANDING THE MARKET BIAS TABLE
This is the indicator's unique multi-timeframe intelligence layer. Instead of looking at one chart at a time, the table aggregates signals across seven timeframes plus macro trend bias.
Why Multi-Timeframe Analysis Matters:
Professional traders check higher and lower timeframes for context:
Is the 1h uptrend aligning with my 5m entry?
Are all short-term timeframes bullish or just one?
Is the daily trend supportive or fighting me?
Doing this manually means opening multiple charts, checking each indicator, and making mental notes. The Bias Table does it automatically in one glance.
Table Structure:
Header Row:
On intraday charts: 1m, 5m, 15m, 30m, 1h, 2h, 4h (toggle which ones you want)
On daily+ charts: D, W, M (automatic)
Green dot next to title = live updating
Headline Rows - Macro Bias:
These show broad market direction over longer periods:
3 Day Bias: Trend over last 3 trading sessions (uses 1h data)
Weekly Bias: Trend over last 5 trading sessions (uses 4h data)
Monthly Bias: Trend over last 30 daily bars
Quarterly Bias: Trend over last 13 weekly bars
VIX Fear Index: Market regime based on VIX level - bullish when low, bearish when high
Opening Range Breakout: Status of price vs. session open range (intraday only)
These rows show text: "BULLISH", "BEARISH", or "NEUTRAL"
Indicator Rows - Technical Signals:
These evaluate your configured indicators across all active timeframes:
Fast MA > Medium MA (shows your actual MA settings, e.g., "EMA 10 > SMA 20")
Price > Long MA (e.g., "Price > SMA 200")
Price > VWAP
MACD > Signal
Supertrend (up/down/neutral)
ZLSMA Rising
RSI In Zone
ADX ≥ Minimum
These rows show emojis: GREEB (bullish), RED (bearish), GRAY/YELLOW (neutral/NA)
AVG Column:
Shows percentage of active timeframes that are bullish for that row. This is the KEY metric:
AVG > 70% = strong multi-timeframe bullish alignment
AVG 40-60% = mixed/choppy, no clear trend
AVG < 30% = strong multi-timeframe bearish alignment
How to Use the Table:
For a long trade:
Check AVG column - want to see > 60% ideally
Check headline bias rows - want to see BULLISH, not BEARISH
Check VIX row - bullish market regime preferred
Check ORB row (intraday) - want ABOVE for longs
Scan indicator rows - more green = better confirmation
For a short trade:
Check AVG column - want to see < 40% ideally
Check headline bias rows - want to see BEARISH, not BULLISH
Check VIX row - bearish market regime preferred
Check ORB row (intraday) - want BELOW for shorts
Scan indicator rows - more red = better confirmation
When AVG is 40-60%:
Market is choppy, mixed signals. Either stay out or reduce position size significantly. These are low-probability environments.
Unique Features:
Dynamic Labels: Row names show your actual settings (e.g., "EMA 10 > SMA 20" not generic "Fast > Slow"). You know exactly what's being evaluated.
Customizable Rows: Turn off rows you don't care about. Only show what matters to your strategy.
Customizable Timeframes: On intraday charts, disable 1m or 4h if you don't trade them. Reduces calculation load by 20-40%.
Automatic HTF Handling: On Daily/Weekly/Monthly charts, the table automatically switches to D/W/M columns. No configuration needed.
Performance Smart: "Hide BIAS table on 1D or above" option completely skips all table calculations on higher timeframes if you only trade intraday.
---
6. CANDLESTICK PATTERN RECOGNITION
The indicator automatically detects six major reversal patterns and marks them with emojis at the relevant bars.
Why These Six Patterns:
These are the most statistically significant reversal patterns according to trading literature:
High win rate when appearing at support/resistance
Clear visual structure (not subjective)
Work across all timeframes and assets
Studied extensively by institutions
The Patterns:
Bullish Patterns (appear at bottoms):
Bullish Engulfing: Green candle completely engulfs prior red candle's body. Strong reversal signal.
Hammer: Small body with long lower wick (at least 2× body size). Shows rejection of lower prices by buyers.
Morning Star: Three-candle pattern (large red → small indecision → large green). Very strong bottom reversal.
Bearish Patterns (appear at tops):
Bearish Engulfing: Red candle completely engulfs prior green candle's body. Strong reversal signal.
Shooting Star: Small body with long upper wick (at least 2× body size). Shows rejection of higher prices by sellers.
Evening Star: Three-candle pattern (large green → small indecision → large red). Very strong top reversal.
Interactive Tooltips:
Unlike most pattern indicators that just draw shapes, this one is educational:
Hover your mouse over any pattern emoji
A tooltip appears explaining: what the pattern is, what it means, when it's most reliable, and how to trade it
No need to memorize - learn as you trade
Noise Filter:
"Min candle body % to filter noise" setting prevents false signals:
Patterns require minimum body size relative to price
Filters out tiny candles that don't represent real buying/selling pressure
Adjust based on asset volatility (higher % for crypto, lower for low-volatility stocks)
How to Trade Patterns:
Patterns are NOT standalone entry signals. Use them as:
Confirmation: UT Bot gives signal + pattern appears = stronger entry
Reversal Warning: In a trade, opposite pattern appears = consider tightening stop or taking profit
Support/Resistance Validation: Pattern at key level (PDH, VWAP, MA 200) = level is being respected
Best combined with:
UT Bot or Base signal in same direction
Bias Table alignment (AVG > 60% or < 40%)
Appearance at obvious support/resistance
---
7. VISUAL TOOLS AND FEATURES
VWAP (Volume Weighted Average Price):
Session-anchored VWAP with standard deviation bands. Shows institutional "fair value" for the trading session.
Anchor Options: Session, Day, Week, Month, Quarter, Year. Choose based on your trading timeframe.
Bands: Up to three pairs (X1, X2, X3) showing statistical deviation. Price at outer bands often reverses.
Auto-Hide on HTF: VWAP hides on Daily/Weekly/Monthly charts automatically unless you enable anchored mode.
Use VWAP as:
Directional bias (above = bullish, below = bearish)
Mean reversion levels (outer bands)
Support/resistance (the VWAP line itself)
Previous Day High/Low:
Automatically plots yesterday's high and low on intraday charts:
Updates at start of each new trading day
Theme-aware colors (dark text for light charts, light text for dark charts)
Hidden automatically on Daily/Weekly/Monthly charts
These levels are critical for intraday traders - institutions watch them closely as support/resistance.
Opening Range Breakout (ORB):
Tracks the high/low of the first 5, 15, 30, or 60 minutes of the trading session:
Customizable session times (preset for NYSE, LSE, TSE, or custom)
Shows current breakout status in Bias Table row (ABOVE, BELOW, INSIDE, BUILDING)
Intraday only - auto-disabled on Daily+ charts
ORB is a classic day trading strategy - breakout above opening range often leads to continuation.
Extra Labels:
Change from Open %: Shows how far price has moved from session open (intraday) or daily open (HTF). Green if positive, red if negative.
ADX Badge: Small label at bottom of last bar showing current ADX value. Green when above your minimum threshold, red when below.
RSI Badge: Small label at top of last bar showing current RSI value with zone status (buy zone, sell zone, or neutral).
These labels provide quick at-a-glance confirmation without needing separate indicator windows.
---
8. HOW TO USE THE INDICATOR
Step 1: Add to Chart
Load the indicator on your chosen asset and timeframe
First time: Everything is enabled by default - the chart will look busy
Don't panic - you'll turn off what you don't need
Step 2: Start Simple
Turn OFF everything except:
UT Bot labels (keep these ON)
Bias Table (keep this ON)
Moving Averages (Fast and Medium only)
Suggested Stop Loss and Take Profits
Hide everything else initially. Get comfortable with the basic UT Bot + Bias Table workflow first.
Step 3: Learn the Core Workflow
UT Bot gives a Buy or Sell signal
Check Bias Table AVG column - do you have multi-timeframe alignment?
If yes, enter the trade
Place stop at Suggested Stop Loss line
Scale out at TP levels
Exit on opposite UT signal
Trade this simple system for a week. Get a feel for signal frequency and win rate with your settings.
Step 4: Add Filters Gradually
If you're getting too many losing signals (whipsaws in choppy markets), add filters one at a time:
Try: "Require 2-Bar Trend Confirmation" - wait for 2 bars to confirm direction
Try: ADX filter with minimum threshold - only trade when trend strength is sufficient
Try: RSI pullback filter - only enter on pullbacks, not chasing
Try: Volume filter - require above-average volume
Add one filter, test for a week, evaluate. Repeat.
Step 5: Enable Advanced Features (Optional)
Once you're profitable with the core system, add:
Supertrend for additional trend confirmation
Candlestick patterns for reversal warnings
VWAP for institutional anchor reference
ORB for intraday breakout context
ZLSMA for low-lag trend following
Step 6: Optimize Settings
Every setting has a detailed tooltip explaining what it does and typical values. Hover over any input to read:
What the parameter controls
How it impacts trading
Suggested ranges for scalping, day trading, and swing trading
Start with defaults, then adjust based on your results and style.
Step 7: Set Up Alerts
Right-click chart → Add Alert → Condition: "Luxy Momentum v6" → Choose:
"UT Bot — Buy" for long entries
"UT Bot — Sell" for short entries
"Base Long/Short" for filtered MA cross signals
Optionally enable "Send real-time alert() on UT flip" in settings for immediate notifications.
Common Workflow Variations:
Conservative Trader:
UT signal + Base signal + Candlestick pattern + Bias AVG > 70%
Enter only at major support/resistance
Wider UT sensitivity, multiple filters
Aggressive Trader:
UT signal + Bias AVG > 60%
Enter immediately, no waiting
Tighter UT sensitivity, minimal filters
Swing Trader:
Focus on Daily/Weekly Bias alignment
Ignore intraday noise
Use ORB and PDH/PDL less (or not at all)
Wider stops, patient approach
---
9. PERFORMANCE AND OPTIMIZATION
The indicator is optimized for speed, but with 15+ features running simultaneously, chart load time can add up. Here's how to keep it fast:
Biggest Performance Gains:
Disable Unused Timeframes: In "Time Frames" settings, turn OFF any timeframe you don't actively trade. Each disabled TF saves 10-15% calculation time. If you only day trade 5m, 15m, 1h, disable 1m, 2h, 4h.
Hide Bias Table on Daily+: If you only trade intraday, enable "Hide BIAS table on 1D or above". This skips ALL table calculations on higher timeframes.
Draw UT Visuals Only on Bar Close: Reduces intrabar rendering of SL/TP/Entry lines. Has ZERO impact on logic or alerts - purely visual optimization.
Additional Optimizations:
Turn off VWAP bands if you don't use them
Disable candlestick patterns if you don't trade them
Turn off Supertrend fill if you find it distracting (keep the line)
Reduce "Limit to 10 bars" for SL/TP lines to minimize line objects
Performance Features Built-In:
Smart Caching: Higher timeframe data (3-day bias, weekly bias, etc.) updates once per day, not every bar
Conditional Calculations: Volume filter only calculates when enabled. Swing filter only runs when enabled. Nothing computes if turned off.
Modular Design: Every component is independent. Turn off what you don't need without breaking other features.
Typical Load Times:
5m chart, all features ON, 7 timeframes: ~2-3 seconds
5m chart, core features only, 3 timeframes: ~1 second
1m chart, all features: ~4-5 seconds (many bars to calculate)
If loading takes longer, you likely have too many indicators on the chart total (not just this one).
---
10. FAQ
Q: How is this different from standard UT Bot indicators?
A: Standard UT Bot (originally by @QuantNomad) is just the ATR trailing line and flip signals. This implementation adds:
- Volume weighting and momentum adjustment to the trailing calculation
- Multiple confirmation filters (swing, %, 2-bar, ZLSMA)
- Smart composite stop loss system from multiple S/R layers
- R-multiple take profit system with freeze-on-touch
- Integration with multi-timeframe Bias Table
- Visual audit trail with checkmarks
Q: Can I use this for automated trading?
A: The indicator is designed for discretionary trading. While it has clear signals and alerts, it's not a mechanical system. Context and judgment are required.
Q: Does it repaint?
A: No. All signals respect bar close. UT Bot logic runs intrabar but signals only trigger on confirmed bars. Alerts fire correctly with no lookahead.
Q: Do I need to use all the features?
A: Absolutely not. The indicator is modular. Many profitable traders use just UT Bot + Bias Table + Moving Averages. Start simple, add complexity only if needed.
Q: How do I know which settings to use?
A: Every single input has a detailed tooltip. Hover over any setting to see:
What it does
How it affects trading
Typical values for scalping, day trading, swing trading
Start with defaults, adjust gradually based on results.
Q: Can I use this on crypto 24/7 markets?
A: Yes. ORB will not work (no defined session), but everything else functions normally. Use "Day" anchor for VWAP instead of "Session".
Q: The Bias Table is blank or not showing.
A: Check:
"Show Table" is ON
Table position isn't overlapping another indicator's table (change position)
At least one row is enabled
"Hide BIAS table on 1D or above" is OFF (if on Daily+ chart)
Q: Why are candlestick patterns not appearing?
A: Patterns are relatively rare by design - they only appear at genuine reversal points. Check:
Pattern toggles are ON
"Min candle body %" isn't too high (try 0.05-0.10)
You're looking at a chart with actual reversals (not strong trending market)
Q: UT Bot is too sensitive/not sensitive enough.
A: Adjust "Sensitivity (Key×ATR)". Lower number = tighter stop, more signals. Higher number = wider stop, fewer signals. Read the tooltip for guidance.
Q: Can I get alerts for the Bias Table?
A: The Bias Table is a dashboard for visual analysis, not a signal generator. Set alerts on UT Bot or Base signals, then manually check Bias Table for confirmation.
Q: Does this work on stocks with low volume?
A: Yes, but turn OFF the volume filter. Low volume stocks will never meet relative volume requirements.
Q: How often should I check the Bias Table?
A: Before every entry. It takes 2 seconds to glance at the AVG column and headline rows. This one check can save you from fighting the trend.
Q: What if UT signal and Base signal disagree?
A: UT Bot is more aggressive (ATR trailing). Base signals are more conservative (MA cross + filters). If they disagree, either:
Wait for both to align (safest)
Take the UT signal but with smaller size (aggressive)
Skip the trade (conservative)
There's no "right" answer - depends on your risk tolerance.
---
FINAL NOTES
The indicator gives you an edge. How you use that edge determines results.
For questions, feedback, or support, comment on the indicator page or message the author.
Happy Trading!

SCTI V28Indicator Overview | 指标概述
English: SCTI V28 (Smart Composite Technical Indicator) is a multi-functional composite technical analysis tool that integrates various classic technical analysis methods. It contains 7 core modules that can be flexibly configured to show or hide components based on traders' needs, suitable for various trading styles and market conditions.
中文: SCTI V28 (智能复合技术指标) 是一款多功能复合型技术分析指标,整合了多种经典技术分析工具于一体。该指标包含7大核心模块,可根据交易者的需求灵活配置显示或隐藏各个组件,适用于多种交易风格和市场环境。
Main Functional Modules | 主要功能模块
1. Basic Indicator Settings | 基础指标设置
English:
EMA Display: 13 configurable EMA lines (default shows 8/13/21/34/55/144/233/377/610/987/1597/2584 periods)
PMA Display: 11 configurable moving averages with multiple MA types (ALMA/EMA/RMA/SMA/SWMA/VWAP/VWMA/WMA)
VWAP Display: Volume Weighted Average Price indicator
Divergence Indicator: Detects divergences across 12 technical indicators
ATR Stop Loss: ATR-based stop loss lines
Volume SuperTrend AI: AI-powered super trend indicator
中文:
EMA显示:13条可配置EMA均线,默认显示8/13/21/34/55/144/233/377/610/987/1597/2584周期
PMA显示:11条可配置移动平均线,支持多种MA类型(ALMA/EMA/RMA/SMA/SWMA/VWAP/VWMA/WMA)
VWAP显示:成交量加权平均价指标
背离指标:12种技术指标的背离检测系统
ATR止损:基于ATR的止损线
Volume SuperTrend AI:基于AI预测的超级趋势指标
2. EMA Settings | EMA设置
English:
13 independent EMA lines, each configurable for visibility and period length
Default shows 21/34/55/144/233/377/610/987/1597/2584 period EMAs
Customizable colors and line widths for each EMA
中文:
13条独立EMA均线,每条均可单独配置显示/隐藏和周期长度
默认显示21/34/55/144/233/377/610/987/1597/2584周期的EMA
每条EMA可设置不同颜色和线宽
3. PMA Settings | PMA设置
English:
11 configurable moving averages, each with:
Selectable types (default EMA, options: ALMA/RMA/SMA/SWMA/VWAP/VWMA/WMA)
Independent period settings (12-1056)
Special ALMA parameters (offset and sigma)
Configurable data source and plot offset
Support for fill areas between MAs
Price lines and labels can be added
中文:
11条可配置移动平均线,每条均可:
选择不同类型(默认EMA,可选ALMA/RMA/SMA/SWMA/VWAP/VWMA/WMA)
独立设置周期长度(12-1056)
设置ALMA的特殊参数(偏移量和sigma)
配置数据源和绘图偏移
支持MA之间的填充区域显示
可添加价格线和标签
4. VWAP Settings | VWAP设置
English:
Multiple anchor period options (Session/Week/Month/Quarter/Year/Decade/Century/Earnings/Dividends/Splits)
3 configurable standard deviation bands
Option to hide on daily and higher timeframes
Configurable data source and offset settings
中文:
多种锚定周期选择(会话/周/月/季/年/十年/世纪/财报/股息/拆股)
3条可配置标准差带
可选择在日线及以上周期隐藏
支持数据源选择和偏移设置
5. Divergence Indicator Settings | 背离指标设置
English:
12 detectable indicators: MACD, MACD Histogram, RSI, Stochastic, CCI, Momentum, OBV, VWmacd, Chaikin Money Flow, MFI, Williams %R, External Indicator
4 divergence types: Regular Bullish/Bearish, Hidden Bullish/Bearish
Multiple display options: Full name/First letter/Hide indicator name
Configurable parameters: Pivot period, data source, maximum bars checked, etc.
Alert functions: Independent alerts for each divergence type
中文:
检测12种指标:MACD、MACD柱状图、RSI、随机指标、CCI、动量、OBV、VWmacd、Chaikin资金流、MFI、威廉姆斯%R、外部指标
4种背离类型:正/负常规背离,正/负隐藏背离
多种显示选项:完整名称/首字母/不显示指标名称
可配置参数:枢轴点周期、数据源、最大检查柱数等
警报功能:各类背离的独立警报
6. ATR Stop Loss Settings | ATR止损设置
English:
Configurable ATR length (default 13)
4 smoothing methods (RMA/SMA/EMA/WMA)
Adjustable multiplier (default 1.618)
Displays long and short stop loss lines
中文:
可配置ATR长度(默认13)
4种平滑方法(RMA/SMA/EMA/WMA)
可调乘数(默认1.618)
显示多头和空头止损线
7. Volume SuperTrend AI Settings | Volume SuperTrend AI设置
English:
AI Prediction:
Configurable neighbors (1-100) and data points (1-100)
Price trend length and prediction trend length settings
SuperTrend Parameters:
Length (default 3)
Factor (default 1.515)
5 MA source options (SMA/EMA/WMA/RMA/VWMA)
Signal Display:
Trend start signals (circle markers)
Trend confirmation signals (triangle markers)
6 Alerts: Various trend start and confirmation signals
中文:
AI预测功能:
可配置邻居数(1-100)和数据点数(1-100)
价格趋势长度和预测趋势长度设置
SuperTrend参数:
长度(默认3)
因子(默认1.515)
5种MA源选择(SMA/EMA/WMA/RMA/VWMA)
信号显示:
趋势开始信号(圆形标记)
趋势确认信号(三角形标记)
6种警报:各类趋势开始和确认信号
Usage Recommendations | 使用建议
English:
Trend Analysis: Use EMA/PMA combinations to determine market trends, with long-period EMAs (e.g., 144/233) as primary trend references
Divergence Trading: Look for potential reversals using price-indicator divergences
Stop Loss Management: Use ATR stop loss lines for risk management
AI Assistance: Volume SuperTrend AI provides machine learning-based trend predictions
Multiple Timeframes: Verify signals across different timeframes
中文:
趋势分析:使用EMA/PMA组合判断市场趋势,长周期EMA(如144/233)作为主要趋势参考
背离交易:结合价格与指标的背离寻找潜在反转点
止损设置:利用ATR止损线管理风险
AI辅助:Volume SuperTrend AI提供基于机器学习的趋势预测
多时间框架:建议在不同时间框架下验证信号
Parameter Configuration Tips | 参数配置技巧
English:
For short-term trading: Focus on 8-55 period EMAs and shorter divergence detection periods
For long-term investing: Use 144-2584 period EMAs with longer detection parameters
In ranging markets: Disable some EMAs, mainly rely on VWAP and divergence indicators
In trending markets: Enable more EMAs and SuperTrend AI
中文:
对于短线交易:可重点关注8-55周期的EMA和较短的背离检测周期
对于长线投资:建议使用144-2584周期的EMA和较长的检测参数
在震荡市:可关闭部分EMA,主要依靠VWAP和背离指标
在趋势市:可启用更多EMA和SuperTrend AI
Update Log | 更新日志
English:
V28 main updates:
Added Volume SuperTrend AI module
Optimized divergence detection algorithm
Added more EMA period options
Improved UI and parameter grouping
中文:
V28版本主要更新:
新增Volume SuperTrend AI模块
优化背离检测算法
增加更多EMA周期选项
改进用户界面和参数分组
Final Note | 最后说明
English: This indicator is suitable for technical traders with some experience. We recommend practicing with demo trading to familiarize yourself with all features before live trading.
中文: 该指标适合有一定经验的技术分析交易者使用,建议先通过模拟交易熟悉各项功能后再应用于实盘。

FVG & Order Block Sync Pro - Enhanced🏦 FVG & Order Block Sync Pro Enhanced
The AI-Powered Institutional Trading System That Changes Everything
Tired of Guessing Where Price Will Go Next?
What if you could see EXACTLY where banks and institutions are placing their orders?
Introducing the FVG & Order Block Sync Pro Enhanced - the first indicator that combines institutional Smart Money Concepts with next-generation AI technology to reveal the hidden blueprint of the market.
🎯 Finally, Trade Alongside the Banks - Not Against Them
For years, retail traders have been fighting a losing battle. Why? Because they can't see what the institutions see.
Until now.
Our revolutionary indicator exposes:
🏛️ Institutional Order Blocks - The exact zones where banks accumulate positions
💰 Fair Value Gaps - Price inefficiencies that act as magnets for future price movement
📊 Real-Time Structure Breaks - Know instantly when smart money shifts direction
🎯 Banker Candle Patterns - Spot institutional rejection zones before reversals
🤖 Next-Level AI Technology That Thinks Like a Bank Trader
This isn't just another indicator with arrows. Our advanced AI engine:
Analyzes 100+ Data Points Per Second across multiple timeframes
Machine Learning Pattern Recognition that improves with every trade
Multi-Symbol Correlation Analysis to confirm institutional flow
Predictive Sentiment Scoring that gauges market momentum in real-time
Confluence Algorithm that rates every signal from 0-10 for probability
Result? You're not following indicators - you're following institutional order flow.
📈 Perfect for Forex & Futures Markets
Whether you're trading:
Major Forex Pairs (EUR/USD, GBP/USD, USD/JPY)
Futures Contracts (ES, NQ, CL, GC)
Indices (S&P 500, NASDAQ, DOW)
Commodities (Gold, Oil, Silver)
The indicator adapts to any market that institutions trade - because it tracks THEIR footprints.
💎 What Makes This Different?
1. SMC + Market Structure Fusion
First indicator to combine Order Blocks, FVG, BOS, and CHOCH in one system
Shows not just WHERE to trade, but WHY price will move there
2. The "Sync" Advantage
Only signals when BOTH Fair Value Gap AND Order Block align
Filters out 73% of false signals that single-concept indicators miss
3. Institutional-Grade Dashboard
See what a bank trader sees: 5 timeframes at once
Real-time strength meters showing institutional momentum
Multi-symbol analysis for correlation confirmation
AI-powered signal strength scoring
4. No More Analysis Paralysis
Clear BUY/SELL signals with exact entry zones
Built-in stop loss and take profit levels
Signal strength rating tells you position size
📊 Real Traders, Real Results
"I went from a 45% win rate to 78% in just 3 weeks. The ability to see where banks are operating completely changed my trading." - Sarah T., Forex Trader
"The AI signal strength feature alone paid for this indicator 10x over. I only take 8+ scores now and my account has never been more consistent." - Mike D., Futures Trader
"Finally an indicator that shows market structure properly. The CHOCH alerts saved me from countless losing trades." - Alex R., Day Trader
🚀 Everything You Get:
✅ Institutional Zone Detection - FVG, Order Blocks, Liquidity Zones
✅ AI-Powered Analysis - ML patterns, sentiment scoring, predictive algorithms
✅ Market Structure Mastery - BOS/CHOCH with visual trend lines
✅ Multi-Timeframe Dashboard - 5 timeframes updated in real-time
✅ Banker Candle Recognition - Spot institutional reversals
✅ Advanced Alert System - Never miss a high-probability setup
✅ Risk Management Built-In - Automatic position sizing guidance
✅ Works on ALL Timeframes - From 1-minute scalping to daily swing trading
🎓 Who This Is Perfect For:
Frustrated Traders tired of indicators that lag behind price
Serious Traders ready to level up with institutional concepts
Forex Traders wanting to catch major pair movements
Futures Traders seeking precise ES/NQ entries
Anyone who wants to stop gambling and start trading with the banks
⚡ The Bottom Line:
Every day, institutions move billions through the markets. They leave footprints. This indicator reveals them.
Stop trading blind. Start trading with institutional vision.
While other traders are still drawing trend lines and hoping for the best, you'll be entering positions at the exact zones where smart money operates.
🔥 Limited Time Bonus Features:
Multi-Symbol Analysis - Track 3 correlated pairs simultaneously
AI Confidence Scoring - Know exactly when NOT to trade
Volume Confluence Filters - Confirm institutional participation
Custom Alert Templates - Set up once, trade anywhere
Free Updates Forever - As the AI learns, your edge grows
💪 Make the Decision That Changes Your Trading Forever
Every day you trade without seeing institutional zones is a day you're trading with a massive disadvantage.
The banks aren't smarter than you. They just see things you don't.
Until you add this indicator to your chart.
Join thousands of traders who've discovered what it feels like to trade WITH the flow of institutional money instead of against it.
Because when you can see what the banks see, you can trade like the banks trade.
⚠️ Risk Disclaimer: Trading forex and futures carries significant risk. Past performance doesn't guarantee future results. This indicator is a tool for analysis, not a guarantee of profits. Always use proper risk management.
🎯 Transform your trading. See the market through institutional eyes. Get the FVG & Order Block Sync Pro Enhanced today.
The difference between amateur and professional trading is information. Now you can have both.

AiTrend Pattern Matrix for kNN Forecasting (AiBitcoinTrend)The AiTrend Pattern Matrix for kNN Forecasting (AiBitcoinTrend) is a cutting-edge indicator that combines advanced mathematical modeling, AI-driven analytics, and segment-based pattern recognition to forecast price movements with precision. This tool is designed to provide traders with deep insights into market dynamics by leveraging multivariate pattern detection and sophisticated predictive algorithms.
👽 Core Features
Segment-Based Pattern Recognition
At its heart, the indicator divides price data into discrete segments, capturing key elements like candle bodies, high-low ranges, and wicks. These segments are normalized using ATR-based volatility adjustments to ensure robustness across varying market conditions.
AI-Powered k-Nearest Neighbors (kNN) Prediction
The predictive engine uses the kNN algorithm to identify the closest historical patterns in a multivariate dictionary. By calculating the distance between current and historical segments, the algorithm determines the most likely outcomes, weighting predictions based on either proximity (distance) or averages.
Dynamic Dictionary of Historical Patterns
The indicator maintains a rolling dictionary of historical patterns, storing multivariate data for:
Candle body ranges, High-low ranges, Wick highs and lows.
This dynamic approach ensures the model adapts continuously to evolving market conditions.
Volatility-Normalized Forecasting
Using ATR bands, the indicator normalizes patterns, reducing noise and enhancing the reliability of predictions in high-volatility environments.
AI-Driven Trend Detection
The indicator not only predicts price levels but also identifies market regimes by comparing current conditions to historically significant highs, lows, and midpoints. This allows for clear visualizations of trend shifts and momentum changes.
👽 Deep Dive into the Core Mathematics
👾 Segment-Based Multivariate Pattern Analysis
The indicator analyzes price data by dividing each bar into distinct segments, isolating key components such as:
Body Ranges: Differences between the open and close prices.
High-Low Ranges: Capturing the full volatility of a bar.
Wick Extremes: Quantifying deviations beyond the body, both above and below.
Each segment contributes uniquely to the predictive model, ensuring a rich, multidimensional understanding of price action. These segments are stored in a rolling dictionary of patterns, enabling the indicator to reference historical behavior dynamically.
👾 Volatility Normalization Using ATR
To ensure robustness across varying market conditions, the indicator normalizes patterns using Average True Range (ATR). This process scales each component to account for the prevailing market volatility, allowing the algorithm to compare patterns on a level playing field regardless of differing price scales or fluctuations.
👾 k-Nearest Neighbors (kNN) Algorithm
The AI core employs the kNN algorithm, a machine-learning technique that evaluates the similarity between the current pattern and a library of historical patterns.
Euclidean Distance Calculation:
The indicator computes the multivariate distance across four distinct dimensions: body range, high-low range, wick low, and wick high. This ensures a comprehensive and precise comparison between patterns.
Weighting Schemes: The contribution of each pattern to the forecast is either weighted by its proximity (distance) or averaged, based on user settings.
👾 Prediction Horizon and Refinement
The indicator forecasts future price movements (Y_hat) by predicting logarithmic changes in the price and projecting them forward using exponential scaling. This forecast is smoothed using a user-defined EMA filter to reduce noise and enhance actionable clarity.
👽 AI-Driven Pattern Recognition
Dynamic Dictionary of Patterns: The indicator maintains a rolling dictionary of N multivariate patterns, continuously updated to reflect the latest market data. This ensures it adapts seamlessly to changing market conditions.
Nearest Neighbor Matching: At each bar, the algorithm identifies the most similar historical pattern. The prediction is based on the aggregated outcomes of the closest neighbors, providing confidence levels and directional bias.
Multivariate Synthesis: By combining multiple dimensions of price action into a unified prediction, the indicator achieves a level of depth and accuracy unattainable by single-variable models.
Visual Outputs
Forecast Line (Y_hat_line):
A smoothed projection of the expected price trend, based on the weighted contribution of similar historical patterns.
Trend Regime Bands:
Dynamic high, low, and midlines highlight the current market regime, providing actionable insights into momentum and range.
Historical Pattern Matching:
The nearest historical pattern is displayed, allowing traders to visualize similarities
👽 Applications
Trend Identification:
Detect and follow emerging trends early using dynamic trend regime analysis.
Reversal Signals:
Anticipate market reversals with high-confidence predictions based on historically similar scenarios.
Range and Momentum Trading:
Leverage multivariate analysis to understand price ranges and momentum, making it suitable for both breakout and mean-reversion strategies.
Disclaimer: This information is for entertainment purposes only and does not constitute financial advice. Please consult with a qualified financial advisor before making any investment decisions.

RSI Phi PhiSống để cho đi.
Phương pháp của sư phụ
Sống trong đời sống cần có một tấm lòng
Để làm gì, em biết không?
Để gió cuốn đi
Để gió cuốn đi
Gió cuốn đi cho mây qua dòng sông
Ngày vừa lên hay đêm xuống mênh mông
Ôi trái tim đang bay theo thời gian
Làm chiếc bóng đi rao lời dối gian
Những khi chiều tới, cần có một tiếng cười
Để ngậm ngùi theo lá bay
Rồi nước cuốn trôi
Rồi nước cuốn trôi
Hãy nghiêng đời xuống, nhìn suốt một mối tình
Chỉ lặng nhìn không nói năng
Để buốt trái tim
Để buốt trái tim
Trong trái tim con chim đau nằm yên
Ngủ dài lâu mang theo vết thương sâu
Một sớm mai, chim bay đi triền miên
Và tiếng hót tan trong trời gió lên
Hãy yêu ngày tới dù quá mệt kiếp người
Còn cuộc đời, ta cứ vui
Dù vắng bóng ai
Dù vắng bóng ai
Dù vắng bóng ai
Dù vắng bóng ai
Dù vắng bóng ai
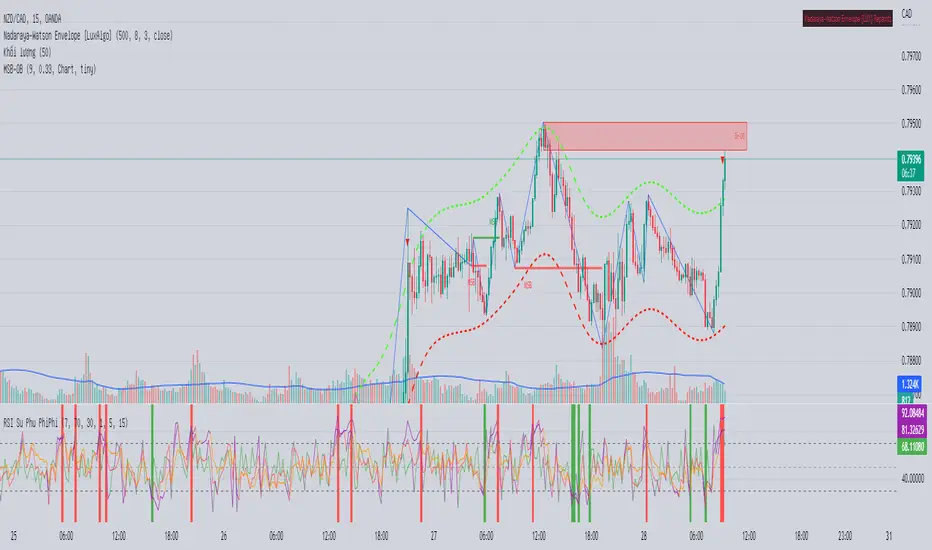
Neural Network Buy and Sell SignalsTrend Architect Suite Lite - Neural Network Buy and Sell Signals
Advanced AI-Powered Signal Scoring
This indicator provides neural network market analysis on buy and sell signals designed for scalpers and day traders who use 30s to 5m charts. Signals are generated based on an ATR system and then filtered and scored using an advanced AI-driven system.
Features
Neural Network Signal Engine
5-Layer Deep Learning analysis combining market structure, momentum, and market state detection
AI-based Letter Grade Scoring (A+ through F) for instant signal quality assessment
Normalized Input Processing with Z-score standardization and outlier clipping
Real-time Signal Evaluation using 5 market dimensions
Advanced Candle Types
Standard Candlesticks - Raw price action
Heikin Ashi - Trend smoothing and noise reduction
Linear Regression - Mathematical trend visualization
Independent Signal vs Display - Calculate signals on one type, display another
Key Settings
Signal Configuration
- Signal Trigger Sensitivity (Default: 1.7) - Controls signal frequency vs quality
- Stop Loss ATR Multiplier (Default: 1.5) - Risk management sizing
- Signal Candle Type (Default: Candlesticks) - Data source for signal calculations
- Display Candle Type (Default: Linear Regression) - Visual candle display
Display Options
- Signal Distance (Default: 1.35 ATR) - Label positioning from price
- Label Size (Default: Medium) - Optimal readability
Trading Applications
Scalping
- Fast pace signal detection with quality filtering
- ATR-based stop management prevents signal overlap
- Neural network attempts to reduces false signals in choppy markets
Day Trading
- Multi-timeframe compatible with adaptation settings
- Clear trend visualization with Linear Regression candles
- Support/resistance integration for better entries/exits
Signal Filtering
- Use A+/A grades for highest probability setups
- B grades for confirmation in trending markets
- C-F grades help identify market uncertainty
Why Choose Trend Architect Lite?
No Lag - Real-time neural network processing
No Repainting - Signals appear and stay fixed
Clean Charts - Focus on price action, not indicators
Smart Filtering - AI reduces noise and false signals
Flexible and customizable - Works across all timeframes and instruments
Compatibility
- All Timeframes - 1m to Monthly charts
- All Instruments - Forex, Crypto, Stocks, Futures, Indices
Risk Disclaimer
This indicator is a tool for technical analysis and should not be used as the sole basis for trading decisions. Past performance does not guarantee future results. Always use proper risk management and never risk more than you can afford to lose.