ATR Circle PlotTitle: ATR Circle Plot
Short Title: ATR Circle Plot
Description:
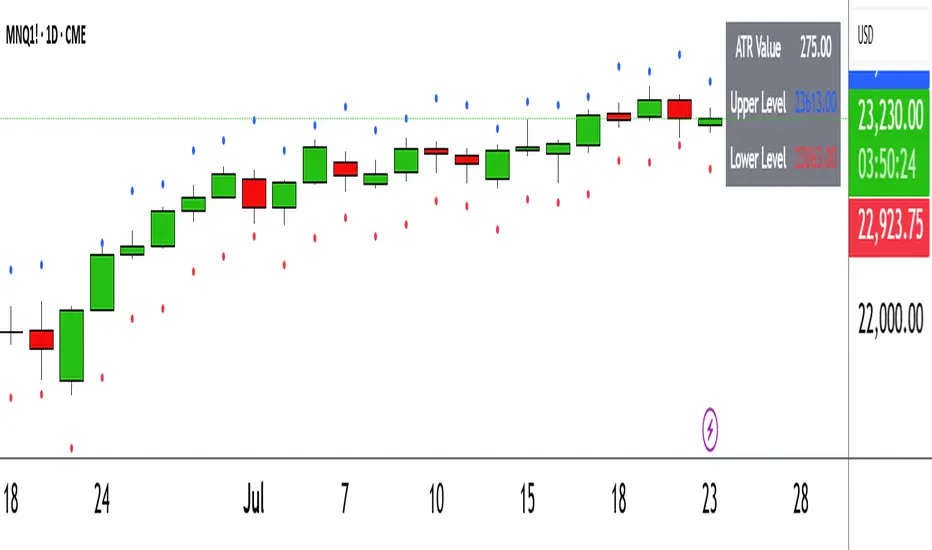
ATR Circle Plot is a dynamic overlay indicator that visualizes volatility-based levels around the open price of each bar, using the Average True Range (ATR). It plots two customizable levels—Upper and Lower ATR—calculated by multiplying the ATR by a user-defined factor (default: 1.0) and adding/subtracting it from the open price. These levels are displayed as colored circles on the chart, ideal for identifying potential breakout or stop-loss zones. A movable table summarizes the ATR value, Upper Level, and Lower Level with tick precision, and a new toggleable label feature displays these values directly on the chart for quick reference.
Perfect for traders in volatile markets like forex, futures, or stocks, this indicator helps set risk parameters or spot key price levels. Users can adjust the ATR timeframe, length, multiplier, table position, and circle colors to suit their strategy. The optional chart labels enhance usability by overlaying ATR metrics at the latest price levels, reducing the need to check the table during fast-moving markets.
Key Features:
Plots Upper and Lower ATR levels as colored circles around the open price.
Toggleable table (top/bottom, left/right) showing ATR and level values in ticks.
Optional chart labels for ATR, Upper, and Lower levels, toggleable via input.
Customizable ATR length, multiplier, timeframe, and colors for flexibility.
Lightweight and compatible with any chart timeframe.
How to Use:
Add the indicator to your chart and adjust the ATR length, multiplier, and timeframe as needed. Enable/disable the table or labels based on your preference. Use the Upper and Lower ATR levels as dynamic support/resistance or stop-loss guides. For example, place stops beyond the Upper/Lower levels or target breakouts when price crosses them. Combine with trend or momentum indicators for a robust setup.
Note: Leave the ATR Timeframe input empty to use the chart’s timeframe, or specify a higher timeframe (e.g., “D” for daily) for broader volatility context. Ensure your chart’s tick size aligns with the asset for accurate table values.
Tags: ATR, volatility, support resistance, stop loss, table, labels, breakout
Category: Volatility
Search in scripts for "文华财经tick价格"
Canuck Trading Trader StrategyCanuck Trading Trader Strategy
Overview
The Canuck Trading Trader Strategy is a high-performance, trend-following trading system designed for NASDAQ:TSLA on a 15-minute timeframe. Optimized for precision and profitability, this strategy leverages short-term price trends to capture consistent gains while maintaining robust risk management. Ideal for traders seeking an automated, data-driven approach to trading Tesla’s volatile market, it delivers strong returns with controlled drawdowns.
Key Features
Trend-Based Entries: Identifies short-term trends using a 2-candle lookback period and a minimum trend strength of 0.2%, ensuring responsive trade signals.
Risk Management: Includes a configurable 3.0% stop-loss to cap losses and a 2.0% take-profit to lock in gains, balancing risk and reward.
High Precision: Utilizes bar magnification for accurate backtesting, reflecting realistic trade execution with 1-tick slippage and 0.1 commission.
Clean Interface: No on-chart indicators, providing a distraction-free trading experience focused on performance.
Flexible Sizing: Allocates 10% of equity per trade with support for up to 2 simultaneous positions (pyramiding).
Performance Highlights
Backtested from March 1, 2024, to June 20, 2025, on NASDAQ:TSLA (15-minute timeframe) with $1,000,000 initial capital:
Net Profit: $2,279,888.08 (227.99%)
Win Rate: 52.94% (3,039 winning trades out of 5,741)
Profit Factor: 3.495
Max Drawdown: 2.20%
Average Winning Trade: $1,050.91 (0.55%)
Average Losing Trade: $338.20 (0.18%)
Sharpe Ratio: 2.468
Note: Past performance is not indicative of future results. Always validate with your own backtesting and forward testing.
Usage Instructions
Setup:
Apply the strategy to a NASDAQ:TSLA 15-minute chart.
Ensure your TradingView account supports bar magnification for accurate results.
Configuration:
Lookback Candles: Default is 2 (recommended).
Min Trend Strength: Set to 0.2% for optimal trade frequency.
Stop Loss: Default 3.0% to cap losses.
Take Profit: Default 2.0% to secure gains.
Order Size: 10% of equity per trade.
Pyramiding: Allows up to 2 orders.
Commission: Set to 0.1.
Slippage: Set to 1 tick.
Enable "Recalculate After Order is Filled" and "Recalculate on Every Tick" in backtest settings.
Backtesting:
Run backtests over March 1, 2024, to June 20, 2025, to verify performance.
Adjust stop-loss (e.g., 2.5%) or take-profit (e.g., 1–3%) to suit your risk tolerance.
Live Trading:
Use with a compatible broker or TradingView alerts for automated execution.
Monitor execution for slippage or latency, especially given the high trade frequency (5,741 trades).
Validate in a demo account before deploying with real capital.
Risk Disclosure
Trading involves significant risk and may result in losses exceeding your initial capital. The Canuck Trading Trader Strategy is provided for educational and informational purposes only. Users are responsible for their own trading decisions and should conduct thorough testing before using in live markets. The strategy’s high trade frequency requires reliable execution infrastructure to minimize slippage and latency.

[Mustang Algo] Channel Strategy# Mustang Algo Channel Strategy - Universal Market Sentiment Oscillator
## 🎯 ORIGINAL CONCEPT
This strategy employs a unique market sentiment oscillator that works on ALL financial assets. It uses Bitcoin supply dynamics combined with stablecoin market capitalization as a macro sentiment indicator to generate universal timing signals across stocks, forex, commodities, indices, and cryptocurrencies.
## 🌐 UNIVERSAL APPLICATION
- **Any Asset Class:** Stocks, Forex, Commodities, Indices, Crypto, Bonds
- **Market-Wide Timing:** BTC/Stablecoin ratio serves as a global risk sentiment gauge
- **Cross-Market Signals:** Trade any instrument using macro liquidity conditions
- **Ecosystem Approach:** One oscillator for all financial markets
## 🧮 METHODOLOGY
**Core Calculation:** BTC Supply / (Combined Stablecoin Market Cap / BTC Price)
- **Data Sources:** DAI + USDT + USDC market capitalizations
- **Signal Generation:** RSI(14) applied to the ratio, double-smoothed with WMA
- **Timing Logic:** Crossover signals filtered by overbought/oversold zones
- **Multi-Timeframe:** Configurable timeframe analysis (default: Daily)
## 📈 TRADING STRATEGY
**LONG Entries:** Bullish crossover when market sentiment is oversold (<48)
**SHORT Entries:** Bearish crossover when market sentiment is overbought (>55)
**Universal Timing:** These macro signals apply to trading any financial instrument
## ⚙️ FLEXIBLE RISK MANAGEMENT
**Three SL/TP Calculation Modes:**
- **Percentage Mode:** Traditional % based (4% SL, 12% TP default)
- **Ticks Mode:** Precise tick-based calculation (50/150 ticks default)
- **Pips Mode:** Forex-style pip calculation (50/150 pips default)
**Realistic Parameters:**
- Commission: 0.1% (adjustable for different asset classes)
- Slippage: 2 ticks
- Position sizing: 10% of equity (conservative)
- No pyramiding (single position management)
## 📊 KEY ADVANTAGES
✅ **Universal Application:** One strategy for all asset classes
✅ **Macro Foundation:** Based on global liquidity and risk sentiment
✅ **False Signal Filtering:** Overbought/oversold zones reduce noise
✅ **Flexible Risk Management:** Multiple SL/TP calculation methods
✅ **No Lookahead Bias:** Clean backtesting with realistic results
✅ **Cross-Market Correlation:** Captures broad market risk cycles
## 🎛️ CONFIGURATION GUIDE
1. **Asset Selection:** Apply to stocks, forex, commodities, indices, crypto
2. **Timeframe Setup:** Daily recommended for swing trading
3. **Sentiment Bounds:** Adjust 48/55 levels based on market volatility
4. **Risk Management:** Choose appropriate SL/TP mode for your asset class
5. **Direction Filter:** Select Long Only, Short Only, or Both
## 📋 BACKTESTING STANDARDS
**Compliant with TradingView Guidelines:**
- ✅ Realistic commission structure (0.1% default)
- ✅ Appropriate slippage modeling (2 ticks)
- ✅ Conservative position sizing (10% equity)
- ✅ Sustainable risk ratios (1:3 SL/TP)
- ✅ No lookahead bias (proper historical simulation)
- ✅ Sufficient sample size potential (100+ trades possible)
## 🔬 ORIGINAL RESEARCH
This strategy introduces a revolutionary approach to financial markets by treating the BTC/Stablecoin ratio as a global risk sentiment gauge. Unlike traditional indicators that analyze individual asset price action, this oscillator captures macro liquidity flows that affect ALL financial markets - from stocks to forex to commodities.
## 🎯 MARKET APPLICATIONS
**Stocks & Indices:** Risk-on/risk-off sentiment timing
**Forex:** Global liquidity flow analysis for major pairs
**Commodities:** Risk appetite for inflation hedges
**Bonds:** Flight-to-safety vs. risk-seeking behavior
**Crypto:** Native application with direct correlation
## ⚠️ RISK DISCLOSURE
- Designed for intermediate to long-term trading across all timeframes
- Market sentiment can remain extreme longer than expected
- Always use appropriate position sizing for your specific asset class
- Adjust commission and slippage settings for different markets
- Past performance does not guarantee future results
## 🚀 INNOVATION SUMMARY
**What makes this strategy unique:**
- First to use BTC/Stablecoin ratio as universal market sentiment indicator
- Applies macro-economic principles to technical analysis across all assets
- Single oscillator provides timing signals for entire financial ecosystem
- Bridges traditional finance with digital asset insights
- Combines fundamental liquidity analysis with technical precision

REVELATIONS (VoVix - PoC) REVELATIONS (VoVix - POC): True Regime Detection Before the Move
Let’s not sugarcoat it: Most strategies on TradingView are recycled—RSI, MACD, OBV, CCI, Stochastics. They all lag. No matter how many overlays you stack, every one of these “standard” indicators fires after the move is underway. The retail crowd almost always gets in late. That’s never been enough for my team, for DAFE, or for anyone who’s traded enough to know the real edge vanishes by the time the masses react.
How is this different?
REVELATIONS (VoVix - POC) was engineered from raw principle, structured to detect pre-move regime change—before standard technicals even light up. We built, tested, and refined VoVix to answer one hard question:
What if you could see the spike before the trend?
Here’s what sets this system apart, line-by-line:
o True volatility-of-volatility mathematics: It’s not just "ATR of ATR" or noise smoothing. VoVix uses normalized, multi-timeframe v-vol spikes, instantly detecting orderbook stress and "outlier" market events—before the chart shows them as trends.
o Purist regime clustering: Every trade is enabled only during coordinated, multi-filter regime stress. No more signals in meaningless chop.
o Nonlinear entry logic: No trade is ever sent just for a “good enough” condition. Every entry fires only if every requirement is aligned—local extremes, super-spike threshold, regime index, higher timeframe, all must trigger in sync.
o Adaptive position size: Your contracts scale up with event strength. Tiny size during nominal moves, max leverage during true regime breaks—never guesswork, never static exposure.
o All exits governed by regime decay logic: Trades are closed not just on price targets but at the precise moment the market regime exhausts—the hardest part of systemic trading, now solved.
How this destroys the lag:
Standard indicators (RSI, MACD, OBV, CCI, and even most “momentum” overlays) simply tell you what already happened. VoVix triggers as price structure transitions—anyone running these generic scripts will trade behind the move while VoVix gets in as stress emerges. Real alpha comes from anticipation, not confirmation.
The visuals only show what matters:
Top right, you get a live, live quant dashboard—regime index, current position size, real-time performance (Sharpe, Sortino, win rate, and wins). Bottom right: a VoVix "engine bar" that adapts live with regime stress. Everything you see is a direct function of logic driving this edge—no cosmetics, no fake momentum.
Inputs/Signals—explained carefully for clarity:
o ATR Fast Length & ATR Slow Length:
These are the heart of VoVix’s regime sensing. Fast ATR reacts to sharp volatility; Slow ATR is stability baseline. Lower Fast = reacts to every twitch; higher Slow = requires more persistent, “real” regime shifts.
Tip: If you want more signals or faster markets, lower ATR Fast. To eliminate noise, raise ATR Slow.
o ATR StdDev Window: Smoothing for volatility-of-volatility normalization. Lower = more jumpy, higher = only the cleanest spikes trigger.
Tip: Shorten for “jumpy” assets, raise for indices/futures.
o Base Spike Threshold: Think of this as your “minimum event strength.” If the current move isn’t volatile enough (normalized), no signal.
Tip: Higher = only biggest moves matter. Lower for more signals but more potential noise.
o Super Spike Multiplier: The “are you sure?” test—entry only when the current spike is this multiple above local average.
Tip: Raise for ultra-selective/swing-trading; lower for more active style.
Regime & MultiTF:
o Regime Window (Bars):
How many bars to scan for regime cluster “events.” Short for turbo markets, long for big swings/trends only.
o Regime Event Count: Only trade when this many spikes occur within the Regime Window—filters for real stress, not isolated ticks.
Tip: Raise to only ever trade during true breakouts/crashes.
o Local Window for Extremes:
How many bars to check that a spike is a local max.
Tip: Raise to demand only true, “clearest” local regime events; lower for early triggers.
o HTF Confirm:
Higher timeframe regime confirmation (like 45m on an intraday chart). Ensures any event you act on is visible in the broader context.
Tip: Use higher timeframes for only major moves; lower for scalping or fast regimes.
Adaptive Sizing:
o Max Contracts (Adaptive): The largest size your system will ever scale to, even on extreme event.
Tip: Lower for small accounts/conservative risk; raise on big accounts or when you're willing to go big only on outlier events.
o Min Contracts (Adaptive): The “toe-in-the-water.” Smallest possible trade.
Tip: Set as low as your broker/exchange allows for safety, or higher if you want to always have meaningful skin in the game.
Trade Management:
o Stop %: Tightness of your stop-loss relative to entry. Lower for tighter/safer, higher for more breathing room at cost of greater drawdown.
o Take Profit %: How much you'll hold out for on a win. Lower = more scalps. Higher = only run with the best.
o Decay Exit Sensitivity Buffer: Regime index must dip this far below the trading threshold before you exit for “regime decay.”
Tip: 0 = exit as soon as stress fails, higher = exits only on stronger confirmation regime is over.
o Bars Decay Must Persist to Exit: How long must decay be present before system closes—set higher to avoid quick fades and whipsaws.
Backtest Settings
Initial capital: $10,000
Commission: Conservative, realistic roundtrip cost:
15–20 per contract (including slippage per side) I set this to $25
Slippage: 3 ticks per trade
Symbol: CME_MINI:NQ1!
Timeframe: 1 min (but works on all timeframes)
Order size: Adaptive, 1–3 contracts
No pyramiding, no hidden DCA
Why these settings?
These settings are intentionally strict and realistic, reflecting the true costs and risks of live trading. The 10,000 account size is accessible for most retail traders. 25/contract including 3 ticks of slippage are on the high side for NQ, ensuring the strategy is not curve-fit to perfect fills. If it works here, it will work in real conditions.
Tip: Set to 1 for instant regime exit; raise for extra confirmation (less whipsaw risk, exits held longer).
________________________________________
Bottom line: Tune the sensitivity, selectivity, and risk of REVELATIONS by these inputs. Raise thresholds and windows for only the best, most powerful signals (institutional style); lower for activity (scalpers, fast cryptos, signals in constant motion). Sizing is always adaptive—never static or martingale. Exits are always based on both price and regime health. Every input is there for your control, not to sell “complexity.” Use with discipline, and make it your own.
This strategy is not just a technical achievement: It’s a statement about trading smarter, not just more.
* I went back through the code to make sure no the strategy would not suffer from repainting, forward looking, or any frowned upon loopholes.
Disclaimer:
Trading is risky and carries the risk of substantial loss. Do not use funds you aren’t prepared to lose. This is for research and informational purposes only, not financial advice. Backtest, paper trade, and know your risk before going live. Past performance is not a guarantee of future results.
Expect more: We’ll keep pushing the standard, keep evolving the bar until “quant” actually means something in the public code space.
Use with clarity, use with discipline, and always trade your edge.
— Dskyz , for DAFE Trading Systems

Anomaly Counter-Trend StrategyA mean-reversion style strategy that automatically spots unusually large price moves over a configurable lookback period and takes the opposite side, with full risk-management, commission and slippage modeling—built in Pine Script® v6.
🔎 Overview
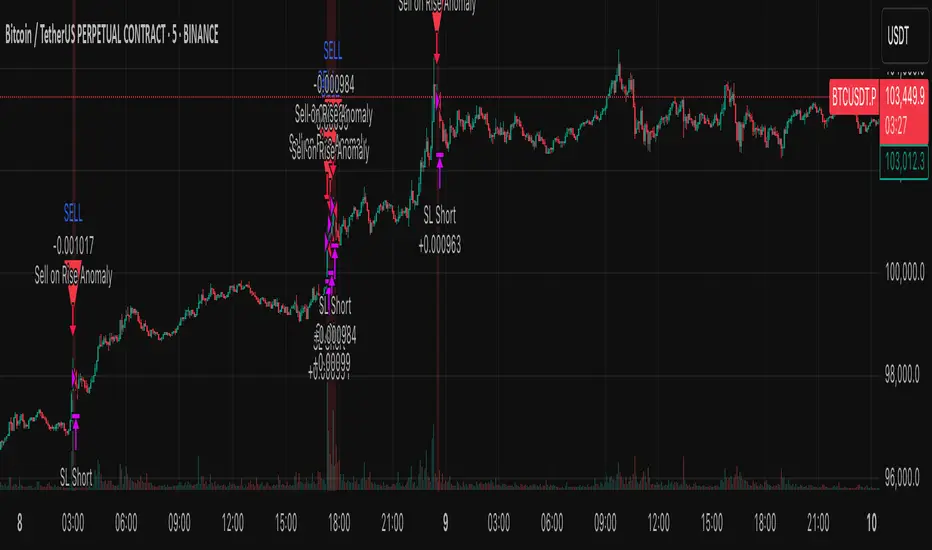
ACTS monitors the percent-change over the past N minutes and, when that move exceeds your chosen threshold, enters a counter-trend position (short on a strong rise; long on a sharp fall). It’s ideal for markets that often “overshoot” and snap back, and can be applied on any symbol or timeframe.
⚙️ Key Features
Anomaly Detection: Detect abnormal price swings based on a user-defined % change over a lookback period.
Counter-Trend Entries: Auto-enter short on rise anomalies, long on fall anomalies (with seamless flat↔reverse transitions).
Risk Management: Configurable stop-loss and take-profit in ticks per trade.
Realistic Modeling: Simulates commissions (0.05 % default), slippage (2 ticks), and percent-of-equity sizing.
Immediate Bar-Close Execution: Orders processed on bar close for faster fills.
Visual Aids: Optional on-chart BUY/SELL triangles and background highlights during anomaly periods.
⚙️ Inputs
Input Default Description
Percentage Threshold (%) 2.00 Min % move over lookback to trigger an anomaly.
Lookback Period (Minutes) 15 Number of minutes over which to measure change.
Stop Loss (Ticks) 100 Distance from entry for stop-loss exit.
Take Profit (Ticks) 200 Distance from entry for take-profit exit.
Plot Trade Signal Shapes (on/off) true Show BUY/SELL triangles on chart.
Highlight Anomaly Background true Shade background during anomaly bars.
📊 How to Use
Add to Chart: Apply the script to any ticker & timeframe.
Tune: Adjust your percentage threshold and lookback to match each instrument’s volatility.
Review Backtest: Check built-in strategy performance (drawdown, Sharpe, etc.) under the Strategy Tester tab.
Go Live: Once optimized, link to alerts or your trade execution system.
⚠️ Disclaimer
This script is provided “as-is” for educational purposes and backtesting only. Past performance does not guarantee future results. Always backtest thoroughly, manage your own risk, and consider market conditions before live trading.
Enjoy experimenting—and may your counter-trend entries catch the next big snapback!
TTM Squeeze Momentum MTF [Cometreon]TTM Squeeze Momentum MTF combines the core logic of both the Squeeze Momentum by LazyBear and the TTM Squeeze by John Carter into a single, unified indicator. It offers a complete system to analyze the phase, direction, and strength of market movements.
Unlike the original versions, this indicator allows you to choose how to calculate the trend, select from 15 different types of moving averages, customize every parameter, and adapt the visual style to your trading preferences.
If you are looking for a powerful, flexible and highly configurable tool, this is the perfect choice for you.
🔷 New Features and Improvements
🟩 Unified System: Trend Detection + Visual Style
You can decide which logic to use for the trend via the "Show TTM Squeeze Trend" input:
✅ Enabled → Trend calculated using TTM Squeeze
❌ Disabled → Trend based on Squeeze Momentum
You can also customize the visual style of the indicator:
✅ Enable "Show Histogram" for a visual mode using Histogram, Area, or Column
❌ Disable it to display the classic LazyBear-style line
Everything updates automatically and dynamically based on your selection.
🟩 Full Customization
Every base parameter of the original indicator is now fully configurable: lengths, sources, moving average types, and more.
You can finally adapt the squeeze logic to your strategy — not the other way around.
🟩 Multi-MA Engine
Choose from 15 different Moving Averages for each part of the calculation:
SMA (Simple Moving Average)
EMA (Exponential Moving Average)
WMA (Weighted Moving Average)
RMA (Smoothed Moving Average)
HMA (Hull Moving Average)
JMA (Jurik Moving Average)
DEMA (Double Exponential Moving Average)
TEMA (Triple Exponential Moving Average)
LSMA (Least Squares Moving Average)
VWMA (Volume-Weighted Moving Average)
SMMA (Smoothed Moving Average)
KAMA (Kaufman’s Adaptive Moving Average)
ALMA (Arnaud Legoux Moving Average)
FRAMA (Fractal Adaptive Moving Average)
VIDYA (Variable Index Dynamic Average)
🟩 Dynamic Signal Line
Apply a moving average to the momentum for real-time cross signals, with full control over its length and type.
🟩 Multi-Timeframe & Multi-Ticker Support
You're no longer limited to the chart's current timeframe or ticker. Apply the squeeze to any symbol or timeframe without repainting.
🔷 Technical Details and Customizable Inputs
This indicator offers a fully modular structure with configurable parameters for every component:
1️⃣ Squeeze Momentum Settings – Choose the source, length, and type of moving average used to calculate the base momentum.
2️⃣ Trend Mode Selector – Toggle "Show TTM Squeeze Trend" to select the trend logic displayed on the chart:
✅ Enabled – Shows the trend based on TTM Squeeze (Bollinger Bands inside/outside Keltner Channel)
❌ Disabled – Displays the trend based on Squeeze Momentum logic
🔁 The moving average type for the Keltner Channel is handled automatically, so you don't need to select it manually, even if the custom input is disabled.
3️⃣ Signal Line – Toggle the Signal Line on the Squeeze Momentum. Select its length and MA type to generate visual cross signals.
4️⃣ Bollinger Bands – Configure the length, multiplier, source, and MA type used in the bands.
5️⃣ Keltner Channel – Adjust the length, multiplier, source, and MA type. You can also enable or disable the True Range option.
6️⃣ Advanced MA Parameters – Customize the parameters for advanced MAs (JMA, ALMA, FRAMA, VIDYA), including Phase, Power, Offset, Sigma, and Shift values.
7️⃣ Ticker & Input Source – Select the ticker and manage inputs for alternative chart types like Renko, Kagi, Line Break, and Point & Figure.
8️⃣ Style Settings – Choose how the squeeze is displayed:
Enable "Show Histogram" for Histogram, Area, or Column style
Disable it to show the classic LazyBear-style line
Use Reverse Color to invert line colors
Toggle Show Label to highlight Signal Line cross signals
Customize trend colors to suit your preferences
9️⃣ Multi-Timeframe Options - Timeframe – Use the squeeze on higher timeframes for stronger confirmation
🔟 Wait for Timeframe Closes -
✅ Enabled – Prevents multiple signals within the same candle
❌ Disabled – Displays the indicator smoothly without delay
🔧 Default Settings Reference
To replicate the default settings of the original indicators as they appear when first applied to the chart, use the following configurations:
🟩 TTM Squeeze (John Carter Style)
Squeeze
Length: 20
MA Type: SMA
Show TTM Squeeze Trend: Enabled
Bollinger Bands
Length: 20
Multiplier: 2.0
MA Type: SMA
Keltner Channel
Length: 20
Multiplier: 1.0
Use True Range: ON
MA Type: EMA
Style
Show Histogram: Enabled
Reverse Color: Enabled
🟩 Squeeze Momentum (LazyBear Style)
Squeeze
Length: 10
MA Type: SMA
Show TTM Squeeze Trend: Disabled
Bollinger Bands
Length: 20
Multiplier: 1.5
MA Type: SMA
Keltner Channel
Length: 10
Multiplier: 1.5
Use True Range: ON
MA Type: SMA
Style
Show Histogram: Disabled
Reverse Color: Disabled
⚠️ These values are intended as a starting point. The Cometreon indicator lets you fully customize every input to fit your trading style.
🔷 How to Use Squeeze Momentum Pro
🔍 Identifying Trends
Squeeze Momentum Pro supports two different methods for identifying the trend visually, each based on a distinct logic:
Squeeze Momentum Trend (LazyBear-style):
Displays 3 states based on the position of the Bollinger Bands relative to the Keltner Channel:
🔵 Blue = No Squeeze (BB outside KC and KC outside BB)
⚪️ White = Squeeze Active (BB fully inside KC)
⚫️ Gray = Neutral state (none of the above)
TTM Squeeze Trend (John Carter-style):
Calculates the difference in width between the Bollinger Bands and the Keltner Channel:
🟩 Green = BB width is greater than KC → potential expansion phase
🟥 Red = BB are tighter than KC → possible compression or pre-breakout
📈 Interpreting Signals
Depending on the active configuration, the indicator can provide various signals, including:
Trend color → Reflects the current compression/expansion state (based on selected mode)
Momentum value (above or below 0) → May indicate directional pressure
Signal Line cross → Can highlight momentum shifts
Color change in the momentum → May suggest a potential trend reversal
🛠 Integration with Other Tools
Squeeze Momentum Pro works well alongside other indicators to strengthen market context:
✅ Volume Profile / OBV – Helps confirm accumulation or distribution during squeezes
✅ RSI – Useful to detect divergence between momentum and price
✅ Moving Averages – Ideal for defining primary trend direction and filtering signals
☄️ If you find this indicator useful, leave a Boost to support its development!
Every piece of feedback helps improve the tool and deliver an even better trading experience.
🔥 Share your ideas or feature requests in the comments!

Premarket High/Low Breakout AlertsPremarket High/Low Breakout Alerts
Description: This custom TradingView indicator helps you track premarket breakouts and breakdowns for a list of selected stocks. The indicator monitors the premarket session and sends an alert every time the stock's price breaks above the premarket high or below the premarket low.
Key Features:
Track Multiple Stocks: Easily monitor multiple stocks (e.g., AAPL, TSLA, NVDA, etc.) and get alerts when they break premarket levels.
Premarket Session Monitoring: The indicator checks for price movements during the premarket session (4:00 AM to 9:30 AM EST).
Customizable Ticker List: Modify the list of tickers directly from the TradingView settings to suit your daily trading needs.
Breakout and Breakdown Alerts: Receive instant alerts for both breakout (above premarket high) and breakdown (below premarket low) conditions.
Plot Premarket Levels: The premarket high and low levels are plotted on the chart for easy reference.
How to Use:
Add this indicator to your chart.
Go to the indicator settings and input your desired stock tickers (e.g., AAPL, TSLA, MSFT).
The indicator will automatically track the premarket levels and send alerts when those levels are broken.
Customize the tickers daily if needed.
Ideal For:
Day Traders who want to track premarket movements.
Swing Traders looking for strong breakouts from premarket levels.
Scalpers who need quick alerts to catch price action early.

Daily Close Levels with ATR and Custom OffsetsDescription:
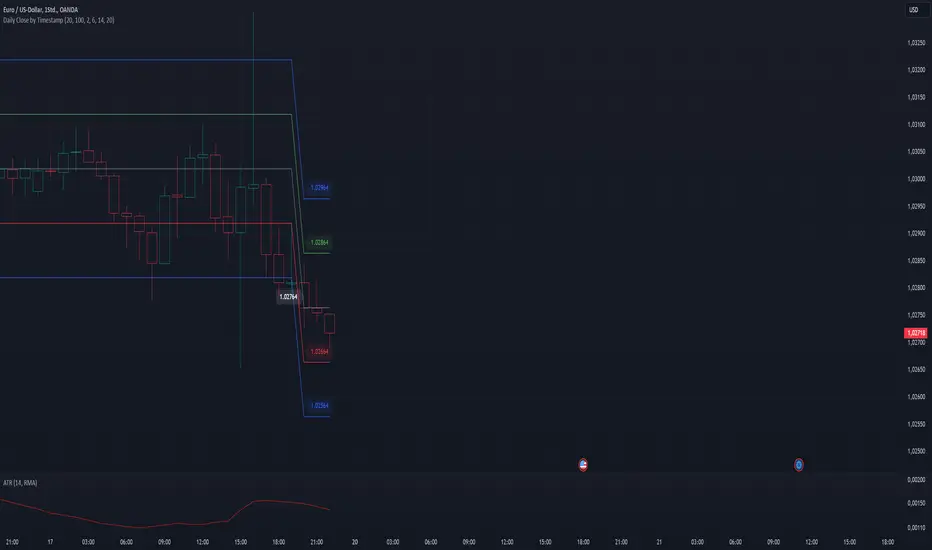
This Pine Script visualizes daily close levels, calculates key price zones based on custom offsets and ATR (Average True Range), and is an essential tool for traders analyzing support and resistance zones.
Features
Close Value Line: Displays the daily close value as a line on the chart.
ATR Values: Shows the ATR value in both price and tick format.
Custom Offsets:
Calculates positive and negative price levels based on a user-defined tick offset.
Supports multipliers for extended zones (e.g., 2x offset).
Labels:
Displays the close value and ATR on the chart.
Annotates calculated price levels directly on the corresponding lines.
Time Control: Calculates levels at a user-defined hour (e.g., 20:00).
Customizable Parameters:
Close Time (Hour): Choose the specific hour for analyzing the close price.
Custom Line Offset: Define the price offset in ticks.
ATR Length: Adjust the ATR calculation length.
Timezone Offset: Supports time adjustments for different time zones.
Enable/Disable Labels and Values: Toggle the display of labels and values on the chart.
BTC-SPX Momentum Gauge + EMA SignalHere's an explanation of the market dynamics and signal benefits of this script:
Momentum and Sentiment Indicator:
The script uses the momentum of the S&P 500 to change the chart's background color, providing a quick visual cue of market sentiment. Green indicates potential bullish momentum in the broader market, while red suggests bearish momentum. This can help traders gauge overall market direction at a glance.
Bitcoin Trend Analysis:
By plotting the scaled TEMA of Bitcoin (BTC), traders can see how Bitcoin's trend correlates or diverges from the current asset being analyzed. Since Bitcoin is often viewed as a hedge against traditional financial systems or inflation, its trend can signal broader economic shifts or investor sentiment towards alternative investments.
Dual Trend Confirmation:
The script offers two trend lines: one for Bitcoin and one for the current ticker. When these lines move in tandem, it might indicate a strong market trend across both traditional and crypto markets. Divergence between these lines can highlight potential market anomalies or opportunities for arbitrage or hedging.
Smoothness vs. Reactivity:
The use of TEMA for Bitcoin provides a smoother signal than a simple moving average, reducing lag while still reacting to price changes. This can be particularly useful for identifying longer-term trends in Bitcoin's volatile market. The 20-period EMA for the current ticker, on the other hand, gives a quicker response to price changes in the asset you're directly trading.
Cross-Asset Correlation:
By overlaying Bitcoin's trend on another asset's chart, traders can analyze how these markets might influence each other. For instance, if Bitcoin is in an uptrend while a traditional asset is declining, it might suggest capital rotation into cryptocurrencies.
Trading Signals:
Crossovers or divergences between the TEMA of Bitcoin and the EMA of the current ticker could be used as signals for entry or exit points. For example, if the BTC TEMA crosses above the current ticker's EMA, it might suggest a shift towards crypto assets.
Risk Management:
The visual cues from the background color and moving averages can aid in risk management. For example, trading in the direction of the momentum indicated by the background color might be seen as going with the market flow, potentially reducing risk.
Macro-Economic Insights:
The relationship between Bitcoin and traditional markets can offer insights into macroeconomic conditions, particularly related to inflation, monetary policy, and investor sentiment towards fiat currencies.
Headwind and tailwind:
Currently BTC correlated trade instruments experience headwind or tailwind from the broader market. This indicator lets the user see it to help their trade decision process.
Additional Statement:
As the market realizes the dangers of the fiat that its construct is built upon and evolves and migrates into stable money, incorruptible by inflation, this indicator will reveal the external influence of that corruptible and the internal influence of the incorruptible; having diminishing returns as the rise of stable money overtakes the treasuries of the fiat construct.

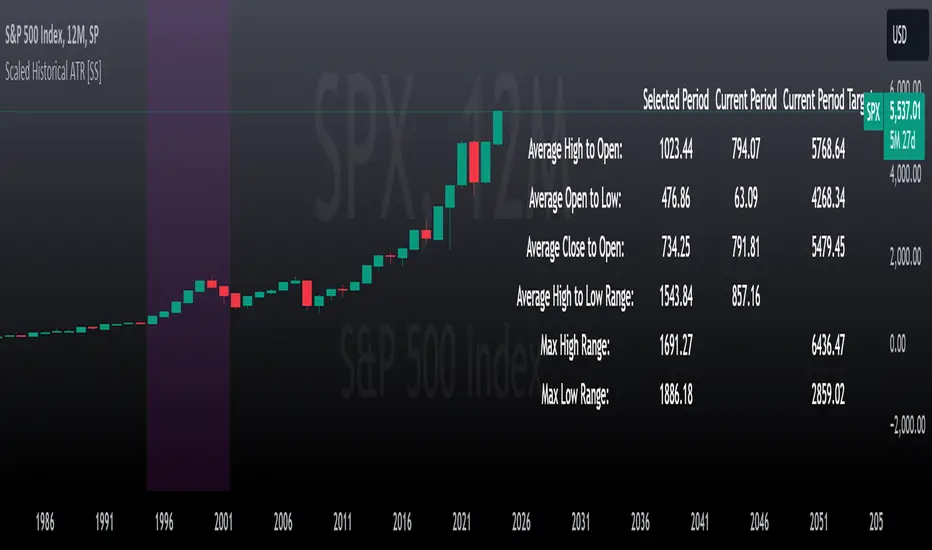
Scaled Historical ATR [SS]Hello again everyone,
This is the Scaled ATR Range indicator. This was done in response to an article/analysis I posted regarding the expected high and range on SPX. I would encourage you to read it here:
Essentially, I took SPX data, scaled it to correct for inflation, then calculated the ATR for Bullish years to get our average range to expect and our close range to expected.
I accomplished this analysis using Excel; however, I figured Pinescript would handle this type of task more elegantly, and I was correct!
This indicator is the result.
What it does:
This indicator permits the analyst to select a historic period in time. The indicator will then scale the period into returns and convert the range to a corrected range based on the current position of the ticker. How it does this is by converting the returns of the historic period selected, then multiplying the returns by the current period open, to ensure that the range amounts are corrected for inflation and natural growth of a ticker.
I say analyst because this indicator is intended to be used by both professional and recreational analysts, to give them an easy way to:
a) Scale historic data and correct it based on the current rate; and
b) Offer insight into a ticker’s ATR and behaviour during bullish and bearish periods.
Prior to this indicator, the only way to do this would be manually or the use of statistical software.
How to use?
The indicator’s use is quite simple. Once launched, the indicator will ask the user to input a timeframe period that the user is interested in assessing. In the main chart above, I chose SPX between 1995 and 2001.
The user can further filter down the data using the settings menu. In the settings menu, there is an option to filter by “All”, “Bullish Periods” or “Bearish Periods”.
Filtering by “All”
Filtering by “All” will include all candles selected within the timeframe. This includes both bearish and bullish candles. It will give you the averaged out range for the entire period of time, including both bearish and bullish instances.
Filtering by “Bullish”
Filtering by “Bullish” will omit any red candles from the analysis. It will only return the ATR ranges for green, bullish candles.
Filtering by “Bearish”
Inverse to filtering by Bullish, if you filter by Bearish, it will only include the red, bearish candles in the analysis.
My suggestion? If you are trying to determine t he likely outcome of a bullish year, filter by Bullish instances. If you want the likely outcome of a bearish year, filter by Bearish.
Other features of the Indicator:
The indicator will display the current period statistics. In the main chart above, you can see that the current ranges for this year are displayed. This allows you to do a side by side comparison of the current period vs. the historic period you are looking at. This can alert you to further upside, further downside and the anticipated close range. It can also alert you to whether or not we are following a similar trajectory as the historical periods you are looking at.
As well, the indicator will list target prices for the current period based on the historical periods you are looking at. This helps to put things into perspective.
Concluding Remarks
And that is the indicator in a nutshell! I encourage you to read the article I linked above to see how you may use it in an analysis. This would be the best example of a real world application of this indicator!
Otherwise, I hope you enjoy and, as always, safe trades!
ETFFinderLibLibrary "ETFFinderLib"
TODO: add library description here
etf_search_ticker(ticker)
searches the entire ETF library by ticker and identifies which ETFs hold a specific tickers.
Parameters:
ticker (string)
Returns: returns 2 arrays, holding_array (string array) and compo_array(float array)
etf_search_sectors(sector)
searches the entire ETF library by sector and pulls by desired sector
Parameters:
sector (string)
Returns: returns 2 arrays, sector_array (string array) and composition array (float array)

Put to Call Ratio CorrelationHello!
Excited to share this with the community!
This is actually a very simple indicator but actually usurpingly helpful, especially for those who trade indices such as SPX, IWM, QQQ, etc.
Before I get into the indicator itself, let me explain to you its development.
I have been interested in the use of option data to detect sentiment and potential reversals in the market. However, I found option data on its own is full of noise. Its very difficult if not impossible for a trader to make their own subjective assessment about how option data is reflecting market sentiment.
Generally speaking, put to call ratios generally range between 0.8 to 1.1 on average. Unless there is a dramatic pump in calls or puts causing an aggressive spike up to over this range, or fall below this range, its really difficult to make the subjective assessment about what is happening.
So what I thought about trying to do was, instead of looking directly at put to call ratio, why not see what happens when you perform a correlation analysis of the PTC ratio to the underlying stock.
So I tried this in pinescript, pulling for Tradingview's ticker PCC (Total Equity Put to Call Ratio) and using the ta.correlation function against whichever ticker I was looking at.
I played around with this idea a bit, pulled the data into excel and from this I found something interesting. When there is a very significant negative or positive correlation between PTC ratio and price movement, we see a reversal impending. In fact, a significant negative or positive correlation (defined as a R value of 0.8 or higher or -0.8 or lower) corresponded to a stock reversal about 92% of the time when data was pulled on a 5 minute timeframe on SPY.
But wait, what is a correlation?
If you are not already familiar, a correlation is simply a statistical relationship. It is defined with a Pearson R correlation value which ranges from 0 (no correlation) to 1 (significant positive correlation) and 0 to -1 (significant negative correlation).
So what does positive vs negative mean?
A significant positive correlation means the correlation is moving the same as the underlying. In the case of this indicator, if there is a significant positive correlation could mean the stock price is climbing at the same time as the PTC ratio.
Inversely, it could mean the stock price is falling as well as the PTC ratio.
A significant negative correlation means the correlation is moving in the opposite direction. So in this case, if the stock price is climbing and the PTC ratio is falling proportionately, we would see a significant negative correlation.
So how does this work in real life?
To answer this, let's get into the actual indicator!
In the image above, you will see the arrow pointing to an area of significant POSITIVE correlation.
The indicator will paint the bars on the actual chart purple (customizable of course) to signify this is an area of significant correlation.
So, in the above example this means that the PTC ratio is increase proportionately to the increase in the stock price in the SAME direction (Puts are going up proportionately to the stock price). Thus, we can make the assumption that the underlying sentiment is overwhelmingly BEARISH. Why? Because option trading activity is significantly proportionate to stock movement, meaning that there is consensus among the options being traded and the movement of the market itself.
And in the above example we will see, the stock does indeed end up selling:
In this case, IWM fell roughly 1 point from where there was bearish consensus in the market.
Let's use this same trading day and same example to show the inverse:
You will see a little bit later, a significant NEGATIVE correlation developed.
In this case identified, the stock wise RISING and the PTC ratio was FALLING.
This means that Puts were not being bought up as much as calls and the sentiment had shifted to bullish .
And from that point, IWM ended up going up an additional 0.75 points from where there was a significant INVERSE correlation.
So you can see that it is helpful for identifying reversals. But what is also can be used for is identifying areas of LOW conviction. Meaning, areas where there really is no relationship between option activity and stock movement. Let's take spy on the 1 hour timeframe for this example:
You can see in the above example there really is no consensus in the option trading activity with the overarching sentiment. The price action is choppy and so too is option trading activity. Option traders are not pushing too far in one direction or the other. We can also see the lack of conviction in the option trading activity by looking at the correlation SMA (the white line).
When a ticker is experiencing volatile and good movement up and down, the SMA will generally trade to the top of the correlation range (roughly + 1.0) and then make a move down to the bottom (roughly - 1.0), see the example below:
When the SMA is not moving much and accumulating around the centerline, it generally means a lot of indecision.
Additional Indicator Information:
As I have said, the indicator is very simple. It pulls the data from the ticker PCC and runs a correlation assessment against whichever ticker you are on.
PCC pulls averaged data from all equities within the market and is not limited to a single equity. As such, its helpful to use this with indices such as SPY, IWM and QQQ, but I have had success with using it on individual tickers such as NVDA and AMD.
The correlation length is defaulted to 14. You can modify it if you wish, but I do recommend leaving it at this as the default and the testing I have done with this have all been on the 14 correlation length.
You can chose to smooth the SMA over whichever length of period you wish as well.
When the indicator is approaching a significant negative or positive relationship, you will see the indicator flash red in the upper or lower band to signify the relationship. As well, the chart will change the bar colour to purple:
Everything else is pretty straight forward.
Let me know your questions/comments or suggestions around the indicator and its applications.
As always, no indicator is meant to provide a single, reliable strategy to your trading regimen and no indicator or group of indicators should be relied on solely. Be sure to do your own analysis and assessments of the stock prior to taking any trades.
Safe trades everyone!

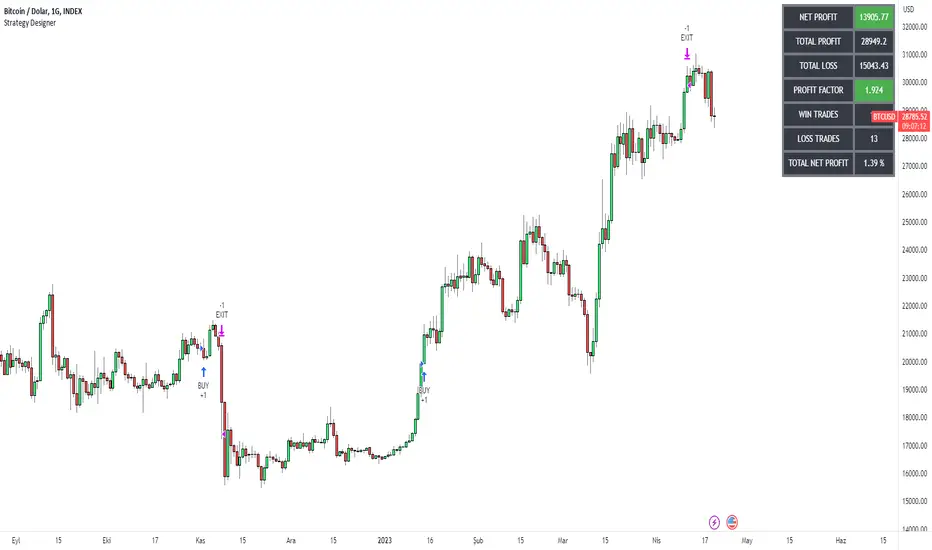
Strategy DesignerHello traders.
Thanks to the tool I have published, everyone who knows or does not know coding will be able to create strategies and see the results instantly on the screen. Yes it looks very nice :)
What does this script do?
Thanks to this tool, even if you don't know any coding, you will be able to create your own strategies. You can add and remove indicators.
Entrance
The first thing you need to do is to set a strategy in your mind.
Then you need to adjust the settings of the indicators installed in the system. Please set the indicators first, because later they are forgotten.
The screen for entering the parameters of the indicators will be as follows.
After entering the parameters there is an important part . In this section, we can adjust the strategy settings.
First we choose between which dates we want the strategy to run. We then choose whether we want the strategy results to be displayed in a table or not.
We choose how the Terms should be linked together. For example, if you have a condition that is expected to produce more than one receive signal, select whether these conditions are connected to each other with and or with the connector.
In this way, you can determine whether all or any of the rules in your strategy should apply.
Next, we choose whether our strategy will work in the spot market or in a bidirectional market. Yes, you can design a strategy for both spot and bidirectional trades :)
At the bottom of the above image, we see a screen where we can adjust the stop level and tp level. As a standard, adjustments are made according to the percentage level you enter. However, if you remove the tick next to the percent sign, the previous stop level and the next profit level are determined as much as the value you entered.
At the bottom is the trailing stop. When you open the trailing stop, the trailing stop becomes active in your strategy.
Very important, when the trailing stop and the stop are active at the same time, the trailing stop value is valid.
It's time to design our strategy. Each chapter that begins with an exclamation point is a separate fiction.
If you do not mark the Active button, that condition will not be included in the calculation.
Direction = It is the direction for which the fiction in this region is valid.
We came to the indicator setting screen. Here, there is a screen where we can select two different indicators on the right and left.
We choose the first indicator starting with 1.
Then we choose from the middle region how we want these two indicators to interact.
We choose our second indicator from the place starting with 2.
If you want an indicator to interact with any value, tick the box where it says Value and fill in the value in the blank. When Value is ticked, the second indicator does not work.
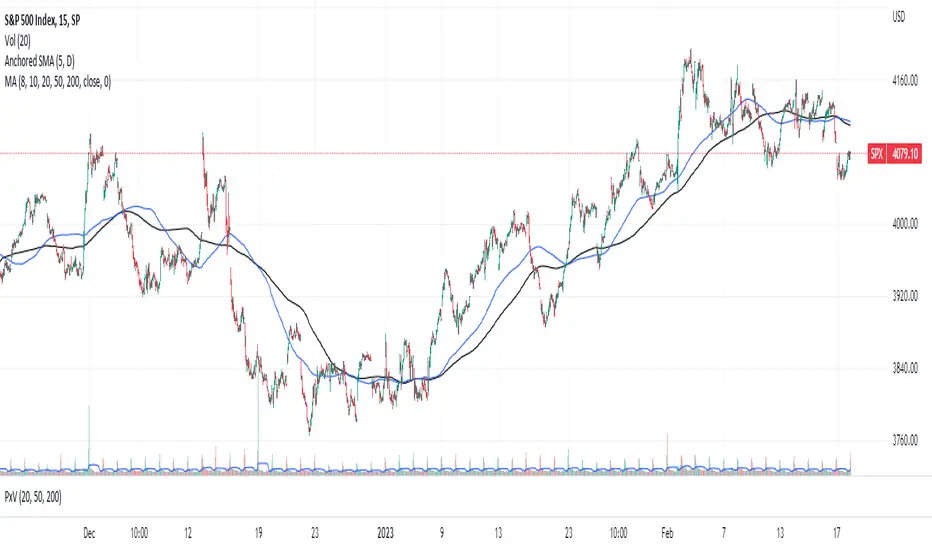
Anchored SMAThis is not your usual single moving average (SMA) indicator. It is an anchored SMA indicator. The anchored SMA does what other SMAs cannot--it stays at an anchored timeframe and presents that SMA relative to the timeframe you are in. For example, standard SMA indicators adjust to the timeframe you are viewing in your chart. So if you set it to a 20 day SMA while in the 1 Day timeframe, when you switch to the 5 minute timeframe, your 20 day SMA now becomes a 100 minute SMA indicator--that is it is only calculating the SMA for 20 ticks at 5 minutes each rather than holding the 20 day indicator at the higher timeframe. However, with the anchored SMA, the indicator would have held at the 20 day SMA while you were in the 5 minute timeframe.
The default setting is for the anchored SMA is the five day SMA. This can be adjusted in the settings to be any amount of ticks in any timeframe you choose from 1 minute to 1 week. The indicator does not hold accurately at timeframes outside of this range. The accompanying chart is the SPX in the 15 minute timeframe with the default anchored SMA settings in blue and the standard 200 tick SMA in black. Now, you could manually adjust the ticks to 130 SMA to fit the same blue line, but why do so when the anchored SMA does it for you?
This brings us to a very important note--this indicator is set to standard market hours at 6.5 hours per day. This means this indicator would not give the same results in markets with different hours, such as futures, FOREX, or Crypto markets. This only holds for equity markets. However, that is not to say it cannot be used in these other markets, it's that it wouldn't be the same result. Anyway, enjoy!
Position Tool█ OVERVIEW
This script is an interactive measurement tool that can be used to evaluate or keep track of trades. Like the long and short position drawing tools, it calculates a risk reward ratio and a risk-adjusted position size from the entry, stop and take profit levels, but it also does much more:
• It can be used to configure long or short trades.
• All monetary values can be expressed in any number of currencies.
• The value of tick/pip movement (which varies with the position's size) is displayed in the currency you have selected.
• The CAGR ( Compound Annual Growth Rate ) for the trade can be displayed.
• It does live tracking of the position.
• You can configure alerts on entries and exits.
█ HOW TO USE IT
Load the indicator on an active chart (see here if you don't know how).
When you first load this script on a chart, you will enter an interactive selection mode where the script asks you to pick three points in price and time on your chart by clicking on the chart. Directions will appear in a blue box at the bottom of the screen with each click of the mouse. The first selection is the entry point for the trade you are considering, which takes into account both the time and level you choose, the next are the take profit and stop levels. Once you have selected all three points, the script will draw trade zones and labels containing the trade metrics. The script determines if the trade is a long or short from the position of the take profit and stop loss levels in relation to the entry price. If the take profit level is above the entry price, the stop must be below and vice versa, otherwise an error occurs.
You can change levels by dragging the handles that appear when you select the indicator, or by entering new values in the script's settings. The only way to re-enter interactive mode is to re-add the indicator to your chart.
Once you place the position tool on a chart, it will appear at the same levels on all symbols you use. If your scale is not set to "Scale price chart only", the position tool's levels will be taken into account when scaling the chart, which can cause the symbol's bars to be compressed. If your scale is set to "Scale price chart only", the position tool will still be there, but it will not impact the scale of the chart's bars, so you won't see it if it sits outside the symbol's price scale.
If you select the position tool on your chart and delete it, this will also delete the indicator from the chart. You will need to re-add it if you want to draw another position tool. You can add multiple instances of the indicator if you need a position tool on more than one of your charts.
█ FEATURES
Display
The position tool displays the following information for entries:
• The entry's price level with an '@' sign before it.
• Open or Closed P&L : For an open trade, the "Open P&L" displays the difference in money value between the entry level and the chart's current price.
For a closed trade, the "Closed P&L" displays the realized P&L on the trade.
• Quantity : The trade size, which takes into account the risk tolerance you set in the script's settings.
• RR : The reward to risk ratio expresses the relationship of the distance between the entry and the take profit level vs the entry and the stop level.
Example: A $100 stop with a $100 target will have a ratio of 1:1, whereas a $200 target with the same stop will have a 2:1 ratio.
• Per tick/pip : Represents the money value of a tick or pip movement.
• CAGR : The Compound Annual Growth Rate will be displayed on the main order label on trades that exceed one day in duration.
This value is calculated the same way as in our CAGR Custom Range indicator.
If the trade duration is less than one day, the metric will not be present in the display.
The stop and take profit levels display:
• Their price level with an '@' sign before it.
• Their distance from the entry in money value, percentage and ticks/pips.
• The projected end money value of the position if the level is reached. These values are calculated based on the trade size and the currency.
Currency adjustments
This indicator modifies the trade label's colors and values based on the final Profit and Loss (P&L), which considers the dynamic exchange rate between base and conversion currencies in its calculations when the conversion currency is a specified value other than the default. Depending on the cross rate between the base and account currencies, this process can yield a negative P&L on an otherwise successful simulated trade.
For instance, if your account is in currency XYZ, you might buy 10 Apple shares at $150 each, with the XYZ to USD exchange rate being 2:1. This purchase would cost you 3000 units of XYZ. Suppose that later on, the shares appreciate to $170 each, and you decide to sell. One might expect this trade to result in profit. However, if the exchange rate has now equalized to 1:1, the return on selling the shares, calculated in XYZ, would only be 1700 units, resulting in a loss of 1300 units XYZ.
The indicator will mark the P&L and the target labels in red in such cases, regardless of whether the market price reached the profit target, as the trade produced a net loss due to reduced funds after currency conversion. Conversely, an otherwise unsuccessful position can result in a net profit in the account currency due to conversion rate fluctuations. The final losses or gains appear in the label metrics, and the corresponding color coding reflects the trade's success or failure.
Settings
The settings in the "Trade sizing" section are used to calculate the position size and the monetary value of trades. Two types of risk can be chosen from the menu; a percentage based risk calculation, or a fixed money value. The risk is used to calculate the quantity of units to purchase to achieve that level of risk exposure. Example: An account size of $1000 and 10% risk will have a projected end amount of $900 if the stop loss is hit. The quantity is a product of this relationship; a projected number of units to allow for the equivalent of $100 of risk exposure over the change in price from the entry to the stop value.
The "Trade levels" allow you to manually set the entry, take profit and stop levels of an existing position tool on your chart.
You can control the appearance of the tool and the values it displays in the settings following these first two sections.
Alerts
Three alerts that will trigger when you configure an alert on this indicator. The first will send an alert when the entry price is breached by price action if that price has not already been breached in the previous price history. This is dependant on the entry location you select when placing the indicator on the chart. The other two alerts will trigger when either the stop loss or the take profit level is breached to signal that a trade exit has occurred.
█ NOTES FOR Pine Script™ CODERS
• Interactive inputs are implemented for input.time() and input.price() . These specialized input functions allow users to interact with a script.
You can create one interactive input for both time and price values by using the same `inline` argument in a pair of input.time() and input.price() function calls.
• We use the `cagr()` function from our ta library.
• The script uses the runtime.error() function to throw an error if the stop and limit prices are not placed on opposing sides of the entry price.
• We use the `currency` parameter in a request.security() call to convert currencies.
Look first. Then leap.

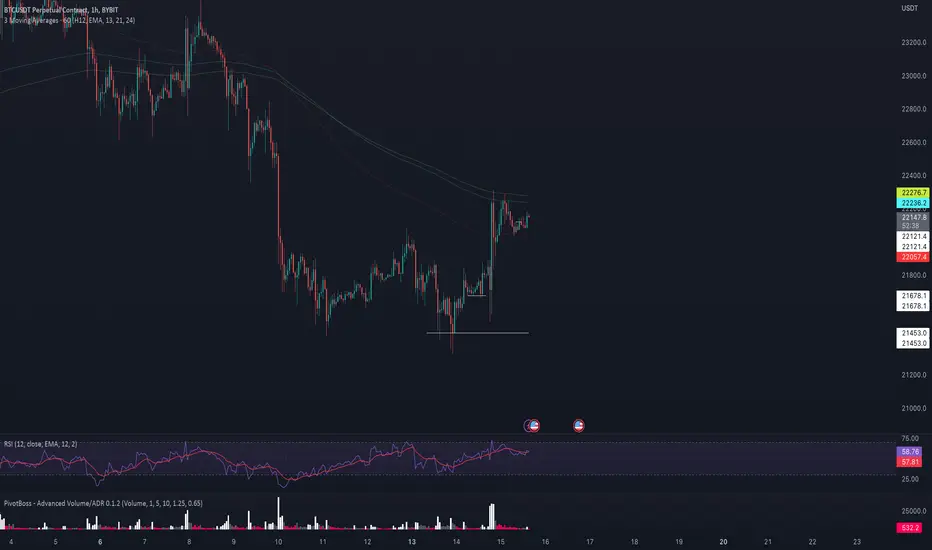
[MAD] CMF 5x MTF BTCthis is a revised classic CMF indicator, with some additional features
Features:
4 different Exchanges:Tickers (clouds).
your current exchanges:ticker (white)
an averaged cmf over all 5 tickers (black)
a selectable time frame for all tickers
3 buy and 3 sell lines (visual H-lines only)
autocentering over ghosts
color scheme is for a dark theme, change in settings if needed.
how to use:
act the crossins
when one or two cmfs move steeply into an h-line, when moving back to the middle they have their signal and do their own risk management.
sometimes really crazy things happen in small time frames (whalegames) that you can use as a tradestop and sit it out.
generally try to go with a bigger trend that give less but better results

MACD Indicator for 5 Min ScalpThis Indicator merges the 1 min MACD with BollingerBands to dedect a bigger than avarage tick on the Macd for the 5 min Scalping Strategy
You can change the length of the bollinger bands for the upper and lower channel individually so that you can get better signals
if a tick is bigger than avarage it will be colored, else it would be gray
this is the same indicator i used to get entrys in my 5 min scalping statagy, but i wouldnt just go in a trade when there is a bigger than usual tick. You have to look at other things to

Bjorgum Double Tap█ OVERVIEW
Double Tap is a pattern recognition script aimed at detecting Double Tops and Double Bottoms. Double Tap can be applied to the broker emulator to observe historical results, run as a trading bot for live trade alerts in real time with entry signals, take profit, and stop orders, or to simply detect patterns.
█ CONCEPTS
How Is A Pattern Defined?
Doubles are technical formations that are both reversal patterns and breakout patterns. These formations typically have a distinctive “M” or a “W” shape with price action breaking beyond the neckline formed by the center of the pattern. They can be recognized when a pivot fails to break when tested for a second time and the retracement that follows breaks beyond the key level opposite. This can trap entrants that were playing in the direction of the prior trend. Entries are made on the breakout with a target projected beyond the neckline equal to the height of the pattern.
Pattern Recognition
Patterns are recognized through the use of zig-zag; a method of filtering price action by connecting swing highs and lows in an alternating fashion to establish trend, support and resistance, or derive shapes from price action. The script looks for the highest or lowest point in a given number of bars and updates a list with the values as they form. If the levels are exceeded, the values are updated. If the direction changes and a new significant point is made, a new point is added to the list and the process starts again. Meanwhile, we scan the list of values looking for the distinctive shape to form as previously described.
█ STRATEGY RESULTS
Back Testing
Historical back testing is the most common method to test a strategy due in part to the general ease of gathering quick results. The underlying theory is that any strategy that worked well in the past is likely to work well in the future, and conversely, any strategy that performed poorly in the past is likely to perform poorly in the future. It is easy to poke holes in this theory, however, as for one to accept it as gospel, one would have to assume that future results will match what has come to pass. The randomness of markets may see to it otherwise, so it is important to scrutinize results. Some commonly used methods are to compare to other markets or benchmarks, perform statistical analysis on the results over many iterations and on differing datasets, walk-forward testing, out-of-sample analysis, or a variety of other techniques. There are many ways to interpret the results, so it is important to do research and gain knowledge in the field prior to taking meaningful conclusions from them.
👉 In short, it would be naive to place trust in one good backtest and expect positive results to continue. For this reason, results have been omitted from this publication.
Repainting
Repainting is simply the difference in behaviour of a strategy in real time vs the results calculated on the historical dataset. The strategy, by default, will wait for confirmed signals and is thus designed to not repaint. Waiting for bar close for entires aligns results in the real time data feed to those calculated on historical bars, which contain far less data. By doing this we align the behaviour of the strategy on the 2 data types, which brings significance to the calculated results. To override this behaviour and introduce repainting one can select "Recalculate on every tick" from the properties tab. It is important to note that by doing this alerts may not align with results seen in the strategy tester when the chart is reloaded, and thus to do so is to forgo backtesting and restricts a strategy to forward testing only.
👉 It is possible to use this script as an indicator as opposed to a full strategy by disabling "Use Strategy" in the "Inputs" tab. Basic alerts for detection will be sent when patterns are detected as opposed to complex order syntax. For alerts mid-bar enable "Recalculate on every tick" , and for confirmed signals ensure it is disabled.
█ EXIT ORDERS
Limit and Stop Orders
By default, the strategy will place a stop loss at the invalidation point of the pattern. This point is beyond the pattern high in the case of Double Tops, or beneath the pattern low in the case of Double Bottoms. The target or take profit point is an equal-legs measurement, or 100% of the pattern height in the direction of the pattern bias. Both the stop and the limit level can be adjusted from the user menu as a percentage of the pattern height.
Trailing Stops
Optional from the menu is the implementation of an ATR based trailing stop. The trailing stop is designed to begin when the target projection is reached. From there, the script looks back a user-defined number of bars for the highest or lowest point +/- the ATR value. For tighter stops the user can look back a lesser number of bars, or decrease the ATR multiple. When using either Alertatron or Trading Connector, each change in the trail value will trigger an alert to update the stop order on the exchange to reflect the new trail price. This reduces latency and slippage that can occur when relying on alerts only as real exchange orders fill faster and remain in place in the event of a disruption in communication between your strategy and the exchange, which ensures a higher level of safety.
👉 It is important to note that in the case the trailing stop is enabled, limit orders are excluded from the exit criteria. Rather, the point in time that the limit value is exceeded is the point that the trail begins. As such, this method will exit by stop loss only.
█ ALERTS
Five Built-in 3rd Party Destinations
The following are five options for delivering alerts from Double Tap to live trade execution via third party API solutions or chat bots to share your trades on social media. These destinations can be selected from the input menu and alert syntax will automatically configure in alerts appropriately to manage trades.
Custom JSON
JSON, or JavaScript Object Notation, is a readable format for structuring data. It is used primarily to transmit data between a server and a web application. In regards to this script, this may be a custom intermediary web application designed to catch alerts and interface with an exchange API. The JSON message is a trade map for an application to read equipped with where its been, where its going, targets, stops, quantity; a full diagnostic of the current state and its previous state. A web application could be configured to follow the messages sent in this format and conduct trades in sync with alerts running on the TV server.
Below is an example of a rendered JSON alert:
{
"passphrase": "1234",
"time": "2022-05-01T17:50:05Z",
"ticker": "ETHUSDTPERP",
"plot": {
"stop_price": 2600.15,
"limit_price": 3100.45
},
"strategy": {
"position_size": 0.1,
"order_action": "buy",
"market_position": "long",
"market_position_size": 0,
"prev_market_position": "flat",
"prev_market_position_size": 0
}
}
Trading Connector
Trading Connector is a third party fully autonomous Chrome extension designed to catch alert webhooks from TradingView and interface with MT4/MT5 to execute live trades from your machine. Alerts to Trading Connector are simple; just select the destination from the input drop down menu, set your ticker in the "TC Ticker" box in the "Alert Strings" section and enter your URL in the alert window when configuring your alert.
Alertatron
Alertatron is an automated algo platform for cryptocurrency trading that is designed to automate your trading strategies. Although the platform is currently restricted to crypto, it offers a versatile interface with high flexibility syntax for complex market orders and conditions. To direct alerts to Alertatron, select the platform from the 3rd party drop down, configure your API key in the ”Alertatron Key” box and add your URL in the alert message box when making alerts.
3 Commas
3 Commas is an easy and quick to use click-and-go third party crypto API solution. Alerts are simple without overly complex syntax. Messages are simply pasted into alerts and executed as alerts are triggered. There are 4 boxes at the bottom of the "Inputs" tab where the appropriate messages to be placed. These messages can be copied from 3 Commas after the bots are set up and pasted directly into the settings menu. Remember to select 3 Commas as a destination from the third party drop down and place the appropriate URL in the alert message window.
Discord
Some may wish to share their trades with their friends in a Discord chat via webhook chat bot. Messages are configured to notify of the pattern type with targets and stop values. A bot can be configured through the integration menu in a Discord chat to which you have appropriate access. Select Discord from the 3rd party drop down menu and place your chat bot URL in the alert message window when configuring alerts.
👉 For further information regarding alert setup, refer to the platform specific instructions given by the chosen third party provider.
█ IMPORTANT NOTES
Setting Alerts
For alert messages to be properly delivered on order fills it is necessary to place the following placeholder in the alert message box when creating an alert.
{{strategy.order.alert_message}}
This placeholder will auto-populate the alert message with the appropriate syntax that is designated for the 3rd party selected in the user menu.
Order Sizing and Commissions
The values that are sent in alert messages are populated from live metrics calculated by the strategy. This means that the actual values in the "Properties" tab are used and must be set by the user. The initial capital, order size, commission, etc. are all used in the calculations, so it is important to set these prior to executing live trades. Be sure to set the commission to the values used by the exchange as well.
👉 It is important to understand that the calculations on the account size take place from the beginning of the price history of the strategy. This means that if historical results have inflated or depleted the account size from the beginning of trade history until now, the values sent in alerts will reflect the calculated size based on the inputs in the "Properties" tab. To start fresh, the user must set the date in the "Inputs" tab to the current date as to remove trades from the trade history. Failure to follow this instruction can result in an unexpected order size being sent in the alert.
█ FOR PINECODERS
• With the recent introduction of matrices in Pine, the script utilizes a matrix to track pivot points with the bars they occurred on, while tracking if that pivot has been traded against to prevent duplicate detections after a trade is exited.
• Alert messages are populated with placeholders ; capability that previously was only possible in alertcondition() , but has recently been extended to `strategy.*()` functions for use in the `alert_message` argument. This allows delivery of live trade values to populate in strategy alert messages.
• New arguments have been added to strategy.exit() , which allow differentiated messages to be sent based on whether the exit occurred at the stop or the limit. The new arguments used in this script are `alert_profit` and `alert_loss` to send messages to Discord

Risk Management & Position Size DashboardRisk Management and Position Size Calculator
This indicator is designed to assist traders by instantly providing the necessary information to execute orders based on defined risk parameters. This is not an indicator that tells you WHEN to buy or sell, but HOW MUCH to buy or sell based on your risk appetite. The indicator is compatible with any strategy and any instrument
The indicator uses some great pinescript features, allowing you to drag and drop your levels directly on the chart for instant feedback from the risk management dashboard. Huge timesaver.
Instructions:
1. The first time you add the indicator to your chart, you will be asked to identify your Entry, Stop and Target levels by clicking on them directly on the chart. You can at any point adjust these levels directly on the chart, or you can manually enter them in settings
2. Setup your risk profile in the indicator settings:
(a) Current Capital: Enter the current value of your trading account
(b) Max Risk Per Trade: Enter the maximum % of your Capital you want to risk per trade
(c) Max Leverage: Enter the maximum leverage you want applied to your account. This comes in handy when you trade on very low timeframes where position sizes can become very large. No matter what you enter here, position size will never exceed Max Risk Per Trade
(d) Stop Ticks: Number of ticks to use above/below the identified high/low for stops
(e) Use Current Price as Entry (Market Orders): By default, the system will use the entry level you have selected for limit orders. If you want to use the system to display data based on current price for market orders, select “Use Current Price as Entry (Market Orders)”
3. Based on your stop and target levels, the system will automatically display the dashboard for Longs (bottom of screen) or Shorts (top of screen). The levels will also be displayed to the right of the current price bar
4. Display Free Trade Level: toggle this on to display the level you should exit 50% of your position to make the trade risk free
5. Dashboard / Text size and level colours and positions are customisable
The Dashboard displays the following information at all times:
1. Entry
2. Stop
3. Trade Risk (%): Percentage price difference between Entry and Stop
4. Max Risk ($): Currency value of loss if the trade is stopped out
5. Size: Position Size to execute your trade based on your risk profile/appetite
6. Size($): Position Size in currency value
7. P&L($): Potential profit to your Capital in currency value
8. P&L(%): Potential profit to your Capital in %
9. R:R: Risk to Reward Ratio
10. % to Target: Percent price needs to move to achieve your target
Hope this helps you with your trading. I built this as I was tired of wasting time opening up spreadsheets or calculators to execute trades - especially on lower timeframes. Making the code open source so if you do make improvements to this I'd love to hear from you. Also open to suggestions.
Happy Trading!
Countdown Interval TimerCountdown Interval Timer calculates the time remaining (in seconds) until bar close and 5 custom intervals (minutes).
Given the execution model of Pine Script is ticked-based, alerts based on this indicator will only trigger if there is a tick at the right time.
Specifically, a tick would be required between the event target (close of bar time, end of minute/s interval), less the Trigger Threshold (default = 5 seconds before).
Alert instructions:
1. Create new alert
2. Select Condition options as:
a) This indicator & desired plot (Ti_Cl, Ti_01, Ti_02, Ti_03, Ti_04 or Ti_05)
b) 'Crossing Down'
c) This indicator & 'Trigger'
3. Set Options to 'Once Per Minute'
Note that if you change the input values of this indicator you will need to recreate the alert as it will not pick up the changes.
For example if you change 'Time interval 01' from 1 to 3, the alert will remain at 1

logLibrary "log"
Logging library for easily displaying debug, info, warn, error and critical messages.
No real need to explain why you might want to use this library! I'm sure you've all experienced the frustration of trying to understand the data state of your scripts... so, enjoy! More on it's way...
(Don't forget to check the helpers in the script and the useful tips below)
Some Useful Tips
By default the log console persists between bars (for history) and bars and ticks (for realtime).
Sometimes it is useful to clear the log after each candle or tick (assuming we are using the above helpers):
```
log_print(clear = true) // starts afresh on every bar and tick (excludes historical bars but good realtime tick analysis)
log_print(clear = barstate.isnew) // clears the log at the start of each bar (again, excludes historical but good realtime candle analysis)
```
It is also useful to be able to selectively understand the state of data at specific points or times within a script:
```
if log.once()
debug('useful variable', my_var) // this log only gets written once, upon first execution of this statement
if log.only(5)
debug3(a, b, c) // these variables are only logged the first five times this statement is executed
log_print(clear = false) // clear must be false and you should not write other logs on every bar, or the above will be lost
```
Final tip. If you want to view ONLY log entries of a particular level, then negate the constant:
```
log_print(level = -LOG_DEBUG)
```
Detailed Interface
once() Restrict execution to only happen once. Usage: if assert.once()\n happens_once()
Returns: bool, true on first execution within scope, false subsequently
only(repeat) Restrict execution to happen a set number of times. Usage: if assert.only(5)\n happens_five_times()
Parameters:
repeat : int, the number of times to return true
Returns: bool, true for the set number of times within scope, false subsequently
init() Initialises the log array
Returns: string , tuple based array to contain all pending log entries (__LOG)
clear(msgs) Clears the log array
Parameters:
msgs : string , the current collection of unfiltered and unprocessed logs (__LOG)
trace(msgs, msg) Writes a trace message to the log console
Parameters:
msgs : string , the current collection of unfiltered and unprocessed logs (__LOG)
msg : string, the trace message to write to the log
debug(msgs, msg) Writes a debug message to the log console
Parameters:
msgs : string , the current collection of unfiltered and unprocessed logs (__LOG)
msg : string, the debug message to write to the log
info(msgs, msg) Writes an info message to the log console
Parameters:
msgs : string , the current collection of unfiltered and unprocessed logs (__LOG)
msg : string, the info message to write to the log
warn(msgs, msg) Writes a warning message to the log console
Parameters:
msgs : string , the current collection of unfiltered and unprocessed logs (__LOG)
msg : string, the warn message to write to the log
error(msgs, msg) Writes an error message to the log console
Parameters:
msgs : string , the current collection of unfiltered and unprocessed logs (__LOG)
msg : string, the error message to write to the log
fatal(msgs, msg) Writes a critical message to the log console
Parameters:
msgs : string , the current collection of unfiltered and unprocessed logs (__LOG)
msg : string, the fatal message to write to the log
log(msgs, level, msg) Write a log message to the log console with a custom level
Parameters:
msgs : string , the current collection of unfiltered and unprocessed logs (__LOG)
level : ing, the logging level to assign to the message
msg : string, the log message to write to the log
severity(msgs) Checks the unprocessed log messages and returns the highest present level
Parameters:
msgs : string , the current collection of unfiltered and unprocessed logs (__LOG)
Returns: int, the highest level found within the unfiltered logs
print(msgs, level, clear, rows, text_size, position) Prints all log messages to the screen
Parameters:
msgs : string , the current collection of unfiltered and unprocessed logs (__LOG)
level : int, the minimum required log level of each message to be displayed
clear : bool, clear the printed log console after each render (useful with realtime when set to barstate.isconfirmed)
rows : int, the number of rows to display in the log console
text_size : string, the text size of the log console (global size vars)
position : string, the position of the log console (global position vars)
unittest_log(case) Log module unit tests, for inclusion in parent script test suite. Usage: log.unittest_log(__ASSERTS)
Parameters:
case : string , the current test case and array of previous unit tests (__ASSERTS)
unittest(verbose) Run the log module unit tests as a stand alone. Usage: log.unittest()
Parameters:
verbose : bool, optionally disable the full report to only display failures

Tape [LucF]█ OVERVIEW
This script prints an ersatz of a trading console's "tape" section to the right of your chart. It displays the time, price and volume of each update of the chart's feed. It also calculates volume delta for the bar. As it calculates from realtime information, it will not display information on historical bars.
█ FEATURES
Calculations
Each new line in the tape displays the last price/volume update from the TradingView feed that's building your chart. These updates do not necessarily correspond to ticks from the originating broker/exchange's matching engine. Multiple broker/exchange ticks are often aggregated in one chart update.
The script first determines if price has moved up or down since the last update. The polarity of the price change, in turn, determines the polarity of the volume for that specific update. If price does not move between consecutive updates, then the last known polarity is used. Using this method, we can calculate a running volume delta accumulation for the bar, which becomes the bar's final volume delta value when the bar closes (you can inspect values of elapsed realtime bars in the Data Window or the indicator's values). Note that these values will all reset if the script re-executes because of a change in inputs or a chart refresh.
While this method of calculating volume delta is not perfect, it is currently the most precise way of calculating volume delta available on TradingView at the moment. Calculating more precise results would require scripts to have access to bid/ask levels from any chart timeframe. Charts at seconds timeframes do use exchange/broker ticks when the feeds you are using allow for it, and this indicator will run on them, but tick data is not yet available from higher timeframes, for now. Also note that the method used in this script is far superior to the intrabar inspection technique used on historical bars in my other "Delta Volume" indicators. This is because volume delta here is calculated from many more realtime updates than the available intrabars in history.
Inputs
You can use the script's inputs to configure:
• The number of lines displayed in the tape.
• If new lines appear at the top or bottom.
• If you want to hide lines with low volume.
• The precision of volume values.
• The size of the text and the colors used to highlight either the tape's text or background.
• The position where you want the tape on your chart.
• Conditions triggering three different markers.
Display
Deltas are shown at the bottom of the tape. They are reset on each bar. Time delta displays the time elapsed since the beginning of the bar, on intraday timeframes only. Contrary to the price change display by TradingView at the top left of charts, which is calculated from the close of the previous bar, the price delta in the tape is calculated from the bar's open, because that's the information used in the calculation of volume delta. The time will become orange when volume delta's polarity diverges from that of the bar. The volume delta value represents the current, cumulative value for the bar. Its color reflects its polarity.
When new realtime bars appear on the chart, a ↻ symbol will appear before the volume value in tape lines.
Markers
There are three types of markers you can choose to display:
• Marker 1 on volume bumps. A bump is defined as two consecutive and increasing/decreasing plus/minus delta volume values,
when no divergence between the polarity of delta volume and the bar occurs on the second bar.
• Marker 2 on volume delta for the bar exceeding a limit of your choice when there is no divergence between the polarity of delta volume and the bar. These trigger at the bar's close.
• Marker 3 on tape lines with volume exceeding a threshold. These trigger in realtime. Be sure to set a threshold high enough so that it doesn't generate too many alerts.
These markers will only display briefly under the bar, but another marker appears next to the relevant line in the tape.
The marker conditions are used to trigger alerts configured on the script. Alert messages will mention the marker(s) that triggered the specific alert event, along with the relevant volume value that triggered the marker. If more than one marker triggers a single alert, they will overprint under the bar, which can make it difficult to distinguish them.
For more detailed on-chart analysis of realtime volume delta, see my Delta Volume Realtime Action .
█ NOTES FOR CODERS
This script showcases two new Pine features:
• Tables, which allow Pine programmers to display tabular information in fixed locations of the chart. The tape uses this feature.
See the Pine User Manual's page on Tables for more information.
• varip -type variables which we can use to save values between realtime updates.
See the " Using `varip` variables " publication by PineCoders for more information.

Combing in MACD and MTFHi all, I'm trying to wedge in the MACD into a multiple timeframe. Scope is to create:
1) an alert when the MACD across all timeframes is positive,
2) an alert when the MACD across all timeframes is negative, and
3) one when neither of them is applicable.
Would anyone be so kind to give it some thoughts, please?
//@version=2
strategy(" Easy MTF Strategy", overlay=false)
TF_1_time = input("3", "Timeframe 1")
TF_2_time = input("5", "Timeframe 2")
TF_3_time = input("15", "Timeframe 3")
TF_4_time = input("30", "Timeframe 4")
fastLen = input(title="Fast Length", type=integer, defval=12)
slowLen = input(title="Slow Length", type=integer, defval=26)
sigLen = input(title="Signal Length", type=integer, defval=9)
= macd(close, fastLen, slowLen, sigLen)
width = 5
upcolor = green
downcolor = red
neutralcolor = blue
linestyle = line
TF_1 = security(tickerid, TF_1_time, open) < security(tickerid, TF_1_time, close) ? true:false
TF_1_color = TF_1 ? upcolor:downcolor
TF_2 = security(tickerid, TF_2_time, open) < security(tickerid, TF_2_time, close) ? true:false
TF_2_color = TF_2 ? upcolor:downcolor
TF_3 = security(tickerid, TF_3_time, open) < security(tickerid, TF_3_time, close) ? true:false
TF_3_color = TF_3 ? upcolor:downcolor
TF_4 = security(tickerid, TF_4_time, open) < security(tickerid, TF_4_time, close) ? true:false
TF_4_color = TF_4 ? upcolor:downcolor
TF_global = TF_1 and TF_2 and TF_3 and TF_4
TF_global_bear = TF_1 == false and TF_2 == false and TF_3 == false and TF_4 == false
TF_global_color = TF_global ? green : TF_global_bear ? red : white
TF_trigger_width = TF_global ? 6 : width
plot(1, style=linestyle, linewidth=width, color=TF_1_color)
plot(5, style=linestyle, linewidth=width, color=TF_2_color)
plot(10, style=linestyle, linewidth=width, color=TF_3_color)
plot(15, style=linestyle, linewidth=width, color=TF_4_color)
plot(25, style=linestyle, linewidth=4, color=TF_global_color)
exitCondition_Long = TF_global_bear
exitCondition_Short = TF_global
longCondition = TF_global
if (longCondition)
strategy.entry("MTF_Long", strategy.long)
shortCondition = TF_global_bear
if (shortCondition)
strategy.entry("MTF_Short", strategy.short)
strategy.close("MTF_Long", when=exitCondition_Long)
strategy.close("MTF_Short", when=exitCondition_Short)
