Symbol InfoFor those who likes clean chart:
Adjustable Symbol ticker and timeframe( AKA watermark) script is here.
1: You can place Symbol ticker and timeframe info anywhere on the chart.
Also you can hide one of them or both.
Position:
Horizontal options: Left Center Right
Vertical options: Top Middle Bottom
Size: Tiny Smal Normal Large Huge Auto
Color is adjustable. Background is optional too.
2: Even more cool part is you can add 2 different custom texts that can switch. (Idea from Pinecoders original script)
You don't have to use text function and reposition it everytime, your message will always stays at one place.
Let the chart deliver your message.
I put my favourite trading slangs there:
1. Do Your Own Research (DYOR)
2. Not a Financial Advice ( NFA)
Search in scripts for "文华财经tick价格"

Time and SalesThis scrip mimics time and sales window displaying tick by tick data coming from the exchange.
It only works when the market is open. And it does not store historical data.
Red color when the last price was higher than the new price.
Gray when both were same.
Green when new price is higher than last price.
Please note that I have tested this in India NSE Market Only. If you find anything buggy let me know in the comments, I will try to update it.

Monthly MA Close Generates buy or sell signal if monthly candle closes above or below the signal MA.
Long positions only.
Inputs:
-Change timeframe MA
-Change period MA
-Use SMA or EMA
-Display MA
-Use another ticker as signal
-Select time period for backtesting
This script is not necessarily written to maximize profits, but to minimize losses.
Although it can outperform 'Buy & Hold' on some occasions when there is a multiple month bearisch trend.
You can optimise this strategy by changing the signal MA inputs.
I would suggest aiming for the best Profit Factor starting from the monthly ("M") setting.
You can always fine-tune the results at a lower timeframe.
The option to use another ticker for providing signals can give you a more stable and unified results.
For example using AMEX:SPY as signal with default parameters gives better results with NASDAQ:AAPL than if you would use NASDAQ:AAPL itself.
I used the anti-repainting function from PineCoders to prevent repainting.
This script is best used for multi-month trading positions & Daily or 4H setting of your chart.

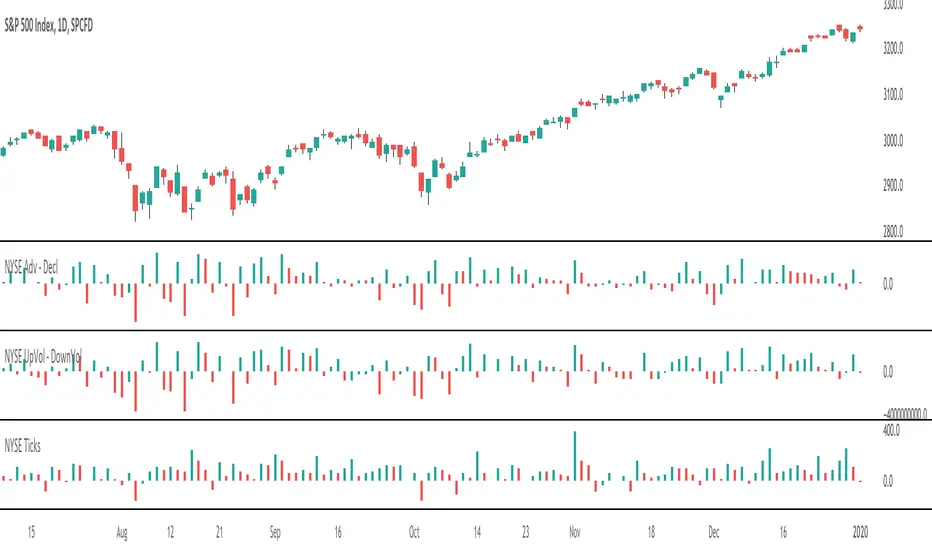
NYSE TicksDisplays NYSE ticks as histogram.
Part of market internals dashboard, so make sure to check the other indicators as well.
NeoButane Bitfinex BTC Longs vs. Shorts Tickers Simplified (MtF)With optional overlay for high/low candle values and daily resolution close. Now with MtF to add customization .
Made because I'm too lazy to constantly re-add tickers and to reduce noise.
High Tick Volume Alert (Classic Style)This indicator has the classic appearance of the volume indicator for tick volume. It notifies you according to your individual settings when there is increased volume on price.

Hammer + EMA Strategy with Tick-based SL/TPWhat This Script Does:
Detects Hammer (bullish reversal) and Inverted Hammer (bearish reversal) patterns
Requires a simple trend context (using 2 bars back)
Confirms price position relative to EMA 50
Applies tick-based SL and TP
Plots buy/sell signals on chart with emoji labels

Futures Tick and Point Value TableDisplays a table in the upper right corner of the chart showing the tick and point value in USD.

Big 8 Intraday TICKAt the start of each trading day (0930 EST), this indicator calculates the intraday price difference between open and close for the eight largest market cap stocks (AAPL, AMZN, GOOGLE, META, MSFT, NFLX, NVDA, and TSLA), assigns a +/-1 for each, and then plots the cumulative change. An EMA has been added for smoothing purposes that is set to 5 but can be changed. Please note indicator is best used on lower timeframes (15 min or less) and has no applicability to time frames above 1 hour.
The thought behind this indicator is those eight major stocks drive a majority of intraday price change in indices like SPY and QQQ that are heavily weighted towards these stocks, therefore they should be a leading indicator in price change. You can often catch a move in SPY or QQQ one to two bars (on 1 min chart) ahead of the actual move because you see this indicator moving strong to one direction.
It's not perfect as there are divergences you will see when you compare historical charts, but oftentimes those divergences ultimately lead to significant price swings in the same direction as this indicator, so recommend being on watch to pull the trigger when you see those and price confirms.
You can use this indicator in a few ways:
1. Confirmation that your current trade is in the same direction as this indicator
2. Use the zero cross as a trigger for put or call entry
3. Focusing only on calls/longs if the value is above 0, or only puts/shorts if the value is below zero. Just be sure to keep an eye on reversals.
If you have recommendations on how to improve, let me know and I'll do my best to make changes.

Inflation Adjusted Performance: Ticker/M2 money supplyPlots current ticker / M2 money supply, to give an idea of 'inflation adjusted performance'.
~In the above, see the last decade of bullish equities is not nearly as impressive as it seems when adjusted to account for the FED's money printing.
~Works on all timeframes/ assets; though M2 money supply is daily data release, so not meaningful to plot this on timeframe lower than daily.
~To display on same pane; comment-out line 6 and un-comment line 7; then save, remove and re-add indicator.
~Scale on the right is meaningless; this indicator is just to show/compare the shape of the charts.

Get Ticker Name - JDThis is a small helper script that can help you in case you need to enter exact ticker names in a script.
Gr, JD.
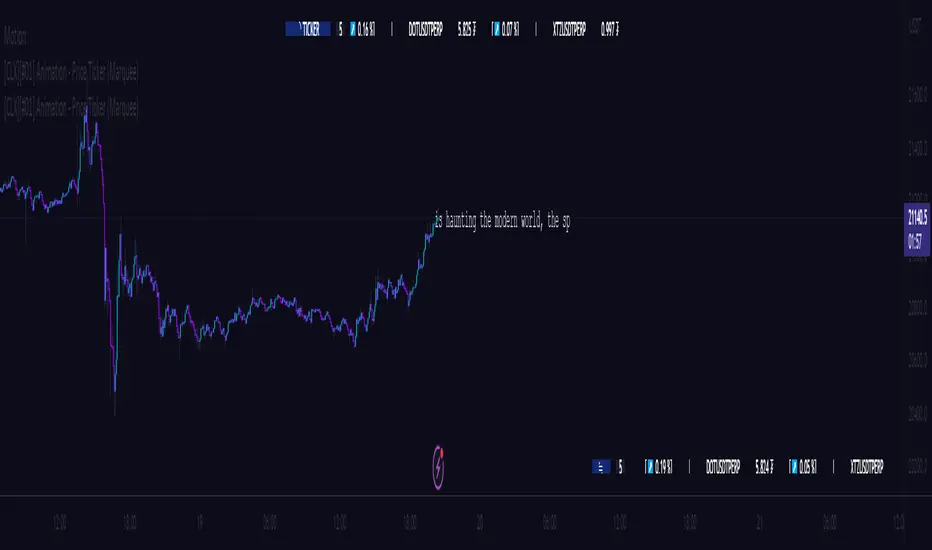
[CLX][#01] Animation - Price Ticker (Marquee)This indicator displays a classic animated price ticker overlaid on the user’s current chart. It is possible to fully customize it or to select one of the predefined styles.
A detailed description will follow in the next few days.
Used Pinescript technics:
- varip (view/animation)
- tulip instance (config/codestructur)
- table (view/position)
By the way, for me, one of the coolest animated effects is by Duyck
We hope you enjoy it! 🎉
CRYPTOLINX - jango_blockchained 😊👍
Disclaimer:
Trading success is all about following your trading strategy and the indicators should fit within your trading strategy, and not to be traded upon solely.
The script is for informational and educational purposes only. Use of the script does not constitute professional and/or financial advice. You alone have the sole responsibility of evaluating the script output and risks associated with the use of the script. In exchange for using the script, you agree not to hold dgtrd TradingView user liable for any possible claim for damages arising from any decision you make based on use of the script.
Crypto Base TickerAn example of using str.replace_all() function to extract a crypto ticker without its pair.
It can be useful if you didn't know syminfo.basecurrency existed.
I didn't know syminfo.basecurrency exists. Lol

Average True Range Pivot(2) High and ATR tick colorsTakes original colored ATR tick code from Autarch_Capital and adds pivot (2) high. In image the green upticks are thickened to make them easier to see. Can change in settings.

HG Scalpius - ATR Up/Down Tick HighlightHG Scalpius - ATR Up/Down Tick Highlight
This indicator highlights ATR(14) upticks (green) and downticks (red) and has the below application:
- If a new trend closing high (low) is made on a downtick in ATR, decreasing volatility mode turns on
If you come across or think of any other useful scripts for the HG Scalpius system please comment below!
Links to 2 previous HG Scalpius scripts:
-
-
Happy trading!
Code:
study(title="Average True Range", shorttitle="ATR", overlay=false)
length = input(title="Length", defval=14, minval=1)
smoothing = input(title="Smoothing", defval="RMA", options= )
ma_function(source, length) =>
if smoothing == "RMA"
rma(source, length)
else
if smoothing == "SMA"
sma(source, length)
else
if smoothing == "EMA"
ema(source, length)
else
wma(source, length)
ATR = ma_function(tr(true), length)
c = ATR >= ATR ? color.lime : color.red
plot(ATR, title = "ATR", color=c, transp=0)


Volume per minimum tickThis script calculates the volume traded per minimum tick of a scrip and is an indicator that the price move is justified by volume and trader interest

Short Squeeze Screener _ SYLGUYO//@version=5
indicator("Short Squeeze Screener — Lookup Table", overlay=false)
// ===========================
// TABLEAU INTERNE DES DONNÉES
// ===========================
// Exemple : remplace par tes données réelles
var string tickers = array.from("MARA", "BBBYQ", "GME")
var float short_float_data = array.from(28.5, 47.0, 22.3)
var float dtc_data = array.from(2.3, 15.2, 5.4)
var float oi_growth_data = array.from(12.0, 22.0, 4.0)
var float pcr_data = array.from(0.75, 0.45, 1.1)
// ===========================
// CHARGEMENT DU TICKER COURANT
// ===========================
string t = syminfo.ticker
var float short_f = na
var float dtc = na
var float oi = na
var float pcr = na
// Trouve le ticker dans la base
for i = 0 to array.size(tickers) - 1
if array.get(tickers, i) == t
short_f := array.get(short_float_data, i)
dtc := array.get(dtc_data, i)
oi := array.get(oi_growth_data, i)
pcr := array.get(pcr_data, i)
// ===========================
// SCORE SHORT SQUEEZE
// ===========================
score = 0
score += (short_f >= 30) ? 1 : 0
score += (dtc >= 7) ? 1 : 0
score += (oi >= 10) ? 1 : 0
score += (pcr <= 1) ? 1 : 0
plot(score, "Short Squeeze Score", linewidth=2)

Luxy VWAP Magic - MTF Projection EngineThis indicator transforms the classic VWAP into a comprehensive trading system. Instead of switching between multiple indicators, you get everything in one place: multi-timeframe analysis, statistical bands, momentum detection, volume profiling, session tracking, and divergence signals.
What Makes This Different
Traditional VWAP indicators show a single line. This tool treats VWAP as a foundation for complete market analysis. The indicator automatically detects your asset type (stocks, crypto, forex, futures) and adjusts its behavior accordingly. Crypto traders get 24/7 session tracking. Stock traders get proper market hours handling. Everyone gets institutional-grade analytics.
Anchor Period Options
The anchor period determines when VWAP resets and recalculates. You have three categories of options:
Time-Based Anchors:
Session - Resets at market open. Best for intraday stock trading where you want fresh VWAP each day.
Day - Resets at midnight UTC. Standard option for most traders.
Week / Month / Quarter / Year - Longer reset periods for swing traders and position traders who want broader context.
Rolling Window Anchors:
Rolling 5D - A sliding 5-day window that never resets. Solves the Monday problem where weekly VWAP equals daily VWAP on first day of week.
Rolling 21D - Approximately one month of trading data in continuous calculation. Excellent for crypto and forex markets that trade 24/7 without clear session breaks.
Event-Based Anchors:
Dividends - Resets on ex-dividend dates. Track institutional cost basis from dividend events.
Splits - Resets on stock split dates. Useful for analyzing post-split trading behavior.
Earnings - Resets on earnings report dates. See where volume-weighted trading occurred since last quarterly report.
Standard Deviation Bands
Three sets of bands surround the main VWAP line:
Band 1 (Aqua) - Plus and minus one standard deviation. Approximately 68% of price action occurs within this range under normal distribution. Touches suggest minor extension.
Band 2 (Fuchsia) - Plus and minus two standard deviations. Only 5% of trading should occur outside this range statistically. Touches here indicate significant overextension and high probability of mean reversion.
Band 3 (Purple) - Plus and minus three standard deviations. Touches are rare (0.3% probability) and represent extreme conditions. Often marks climax moves or panic selling/buying.
Each band can be toggled independently. Most traders show Band 1 by default and add Band 2 and 3 for specific setups or volatile instruments.
Multi-Timeframe VWAP System
The MTF section plots previous period VWAPs as horizontal support and resistance levels:
Daily VWAP - Previous day's final VWAP value. Key intraday reference level.
Weekly VWAP - Previous week's final VWAP. Important for swing traders.
Monthly VWAP - Previous month's final VWAP. Institutional benchmark level.
Quarterly VWAP - Previous quarter's final VWAP. Major support/resistance for position traders.
Previous Day VWAP - Yesterday's closing VWAP specifically, separate from current daily calculation.
The Confluence Zone percentage setting determines how close multiple VWAPs must be to trigger a confluence alert. When two or more timeframe VWAPs converge within this threshold, you get a high-probability support/resistance zone.
Session VWAPs for Global Markets
For forex, crypto, and futures traders who operate in 24/7 markets, the indicator tracks three major global sessions:
Asia Session - UTC 21:00 to 08:00. Gold colored line. Typically lower volatility, range-bound action that sets overnight levels.
London Session - UTC 08:00 to 17:00. Orange colored line. Often determines daily direction with high volume European participation.
New York Session - UTC 13:00 to 22:00. Blue colored line. Highest volume session globally. Sharp directional moves common.
Previous session VWAP values display as horizontal lines when each session closes, acting as intraday support and resistance. The table shows which sessions are currently active with checkmarks.
On-Chart Labels and Signals
The indicator plots several types of labels directly on price action when significant events occur:
Volume Spike Labels
Fire when current bar volume exceeds configurable thresholds relative to both the previous bar and the 20-bar average. Default settings require 300% of previous bar AND 200% of average volume. Green labels indicate bullish candles. Red labels indicate bearish candles. These spikes often mark institutional entry points.
Momentum Shift Labels
Appear when VWAP acceleration changes direction. The Slowing label warns when an active trend loses steam, often preceding reversal. The Accelerating label confirms trend continuation or potential bottom during downtrends. Filters available to show only reversal signals in existing trends.
VWAP Squeeze Labels
Detect when standard deviation bands contract relative to ATR (Average True Range). Low volatility compression often precedes explosive breakout moves. When the squeeze fires (releases), a label appears with directional prediction based on VWAP slope.
Divergence Labels
Mark price/volume divergences using CVD (Cumulative Volume Delta) analysis:
Bullish divergence: Price makes lower low, but CVD makes higher low. Hidden accumulation despite price weakness.
Bearish divergence: Price makes higher high, but CVD makes lower high. Hidden distribution despite price strength.
Dynamic VWAP Coloring
The main VWAP line changes color based on its slope direction:
Green - VWAP is rising. Institutional buying pressure. Volume-weighted price increasing.
Red - VWAP is falling. Institutional selling pressure. Volume-weighted price decreasing.
Gray - VWAP is flat. Consolidation or balance between buyers and sellers.
This coloring can be disabled for a static blue line if you prefer cleaner visuals. The VWAP label next to the line shows the current trend direction and delta percentage.
Calculated Projection Cone
One of the most powerful features is the Calculated Projection Cone. Unlike traditional extrapolation methods that simply extend a trend line forward, this system analyzes what actually happened in similar market conditions throughout the chart's history.
How It Works:
The system classifies each bar into one of 27 unique market states:
Z-Score Level - LOW (oversold), MID (fair value), or HIGH (overbought) based on configurable thresholds
Trend Direction - DOWN, FLAT, or UP based on VWAP slope
Volume Profile - LOW (below 80%), NORMAL (80-150%), or HIGH (above 150%) relative volume
When you look at the current bar, the indicator:
1. Identifies the current market state (e.g., LOW Z-Score + UP Trend + HIGH Volume)
2. Searches through all historical bars on the chart that had the same state
3. Calculates what happened in those bars X bars later (where X is your projection horizon)
4. Shows you the probability of up/down and the average move size
Visual Elements:
Probability Cone - Colored green (bullish probability above 55%), red (bearish below 45%), or gold (neutral). The cone width represents the historical range of outcomes (roughly the 20th to 80th percentile).
Center Line - Shows the average expected price based on historical outcomes in similar conditions.
Probability Label - Displays direction probability and average move. Example: "67% UP (+0.8%)" means 67% of similar past cases moved up, averaging 0.8% gain.
Fallback System:
When the exact 27-state match has insufficient historical data:
First fallback: Uses Z-Score plus Trend only (9 broader states, ignoring volume)
Second fallback: Uses Z-Score only (3 states)
When fallback is active, confidence automatically adjusts
Settings:
Projection Horizon - How many bars forward to analyze outcomes (5, 10, 15, or 20 bars, default 10)
Lookback Period - Historical data window in days (30-252, default 60)
Minimum Samples - Cases needed before using fallback (5-30, default 10)
Z-Score Threshold - Bucket boundary for LOW/MID/HIGH classification (1.0, 1.5, or 2.0 sigma)
Cloud Transparency - Adjust visibility (50-95%)
Colors - Customize bullish, bearish, and neutral cone colors
Confidence Levels:
HIGH - 30 or more similar historical cases found
MEDIUM - 15-29 similar cases
LOW - Fewer than 15 cases (more uncertainty)
IMPORTANT DISCLAIMER:
The Calculated Projection is based on past patterns only. It is NOT a price prediction or financial advice. Similar market states in the past do not guarantee similar outcomes in the future. The probability shown is historical frequency, not a guarantee. Always combine with other analysis and never rely solely on projections for trading decisions.
Alert Conditions
The indicator includes over 20 pre-built alert conditions:
Price vs VWAP:
Price crosses above VWAP
Price crosses below VWAP
Band Touches:
Price touches plus or minus one sigma band
Price touches plus or minus two sigma band (extreme)
Price touches plus or minus three sigma band (very extreme)
Z-Score Extremes:
Z-Score crosses above plus two (overbought extreme)
Z-Score crosses below minus two (oversold extreme)
Momentum and Trend:
Momentum slowing
Momentum accelerating
Trend turns bullish/bearish/neutral
Volume:
Volume spike detected
CVD Direction:
Buyers take control
Sellers take control
High Probability Signals:
Bullish reversal signal (oversold plus accelerating momentum)
Bearish reversal signal (overbought plus slowing momentum)
MTF and Special:
MTF confluence zone entry
VWAP squeeze fired
Bullish/Bearish divergence detected
Any significant signal (catch-all)
All signals use confirmed bar data to prevent false alerts from incomplete candles.
Settings Overview
Settings are organized into logical groups:
VWAP Settings
Anchor Period selection
Show/Hide VWAP line
Dynamic coloring toggle
VWAP label visibility
Bands Visibility
Toggle each of three bands independently
Info Table
Show/Hide table
Table position (9 options)
Text size
Volume spike label settings with adjustable thresholds
Momentum label settings with filters
Signal labels limited to 5 most recent (auto-managed)
Probability engine lookback period
Multi-Timeframe VWAP
Enable/Disable MTF system
Show MTF in table
Show MTF lines on chart
Individual timeframe toggles
Confluence zone threshold
Squeeze detection toggle
Session VWAPs
Enable/Disable session tracking
Apply to all assets option
Show session labels
Divergence Detection
Enable/Disable divergence
Pivot lookback period
Show divergence labels
Calculated Projection
Enable/Disable projection cone
Projection horizon (5, 10, 15, or 20 bars)
Lookback period in days (30-252)
Minimum samples threshold
Z-Score classification threshold (1.0, 1.5, or 2.0 sigma)
Cloud transparency adjustment
Bullish, bearish, and neutral colors
The Info Table - Your Trading Dashboard
The right side of your chart displays a compact table with up to twelve metrics.
Row-by-Row Breakdown:
Asset and Period - Shows what the indicator detected (US Stock, Crypto, Forex, etc.) and your selected anchor period. The detection happens automatically based on exchange data, so VWAP resets and calculations match your actual trading instrument.
Delta Percentage - How far current price sits from VWAP, expressed as a percentage. Positive means price trades above fair value. Negative means below. Large delta values (beyond 1-2%) often precede mean reversion moves. Day traders watch this for overextension.
Z-Score - Statistical deviation from VWAP measured in standard deviations. Unlike raw delta, Z-Score accounts for volatility. A 2% move in a volatile biotech stock differs from 2% in a stable utility. Z-Score normalizes this. Values beyond plus or minus two sigma occur only 5% of the time statistically.
Trend Direction - Whether VWAP itself is rising, falling, or flat. Rising VWAP means the volume-weighted average price is increasing, which indicates institutional accumulation. Falling VWAP suggests distribution. This differs from price trend since it weights by volume.
Momentum State - Is the trend accelerating or slowing down? This measures the rate of change in VWAP slope. When an uptrend shows slowing momentum, it often precedes reversal. Accelerating momentum in a downtrend can signal capitulation and potential bottom.
Relative Volume - Current bar volume compared to the 20-bar average, shown as percentage. Values above 150% indicate above-average activity. Spikes above 200-300% often mark institutional involvement. Low volume (below 80%) warns of potential fake moves.
MTF Bias - Four checkmarks or X marks showing whether price sits above or below Daily, Weekly, Monthly, and Quarterly VWAP. Four checkmarks means strong bullish alignment across all timeframes. Four X marks indicates bearish alignment. Mixed readings suggest consolidation or transition.
Band Probabilities - Historical statistics showing how often price touched each standard deviation band over your lookback period. This helps you understand if mean reversion or trend following works better for your specific instrument.
Session Status - Which global trading sessions are currently active (Asia, London, New York). Shows checkmarks for active sessions. Important for forex and crypto traders who need to know when major liquidity windows open and close.
Divergence State - Whether the indicator detects bullish or bearish divergence between price and cumulative volume delta. Bullish divergence occurs when price makes lower lows but buying pressure (CVD) makes higher lows, suggesting hidden accumulation.
Confidence Score - A weighted composite of all factors displayed as a progress bar and percentage. Combines MTF alignment, Z-Score, trend direction, volume delta, momentum, and relative volume into a single 0-100 score. Higher scores indicate stronger conviction setups.
Calculated Projection - When the Projection Cone is enabled, shows the historical probability of price direction and expected move. For example: "▲ 67% (+0.8%)" means in similar market states historically, price moved up 67% of the time with an average gain of 0.8%. The system analyzes 27 unique market states based on Z-Score, Trend, and Volume conditions.
Recommended Use Cases
Day Trading Stocks:
Use Session anchor with Band 1 visible. Watch for price returning to VWAP after morning move. Volume spikes near VWAP often mark institutional accumulation zones.
Swing Trading:
Use Weekly or Rolling 21D anchor. Enable MTF lines for Daily and Weekly levels. Trade pullbacks to these levels in direction of MTF bias.
Crypto and Forex:
Enable Session VWAPs. Use Rolling anchors to avoid artificial resets. Monitor session transitions for breakout opportunities.
Mean Reversion:
Focus on Z-Score reaching plus or minus two. Add Band 2 visibility. Combine with slowing momentum for highest probability reversals.
Trend Following:
Watch MTF bias alignment. Four checkmarks plus accelerating momentum plus high volume confirms trend continuation setups.
Projection Planning:
Enable the Calculated Projection to see what happened historically in similar market conditions. Use 5-10 bars for intraday setups, 15-20 bars for swing trade planning. Focus on high probability readings (above 60%) with HIGH confidence (30 or more samples). The cone shows the probable range of outcomes based on actual historical data. Combine with other factors like MTF alignment and volume for higher conviction setups.
Important Notes
The indicator does not repaint. MTF values use previous period's confirmed data.
Rolling VWAP works best on 15-minute timeframes and above due to bar lookback requirements.
Session VWAPs apply to global markets by default (forex, crypto, futures). Enable the all-assets option for stocks if desired.
Volume data for forex represents tick volume, not actual traded volume.
All alert conditions fire only on confirmed (closed) bars to prevent false signals.
The Calculated Projection updates each bar as market state changes. This is expected behavior. The projection shows probabilities based on similar past conditions, not a fixed prediction.
Q AND A
Q: Does this indicator repaint?
A: No. The main VWAP calculation uses standard TradingView VWAP methodology. Multi-timeframe values use previous period's confirmed data with appropriate lookahead settings. All alert signals require bar confirmation.
Q: Why does my Rolling VWAP look different on 1-minute versus 15-minute charts?
A: Rolling VWAP calculates across a fixed number of trading days. On very short timeframes, the bar lookback may hit TradingView limits. For best Rolling VWAP accuracy, use 15-minute or higher timeframes.
Q: Can I use this on any instrument?
A: Yes. The indicator automatically detects asset type and adjusts behavior. Stocks use standard market hours. Crypto uses 24/7 calculations. Forex uses tick volume. Everything adapts automatically.
Q: What does the Confidence Score actually measure?
A: The score combines six weighted factors: MTF alignment (25%), Z-Score position (20%), Trend direction (20%), CVD pressure (15%), Momentum state (10%), and Relative volume (10%). Higher scores indicate more factors aligned in one direction.
Q: Why are Session VWAPs not showing on my stock chart?
A: Session VWAPs apply to 24-hour markets by default (forex, crypto, futures). For stocks, enable the Use for All Assets option in Session VWAP settings.
Q: The Divergence labels appear delayed. Is this a bug?
A: Divergence detection requires pivot confirmation, which needs bars on both sides of the pivot point. The label appears at the actual pivot location (several bars back) once confirmed. This is intentional and prevents false signals.
Q: Can I change the band colors?
A: Yes. Each of the three bands has its own color input setting. You can customize Band 1, Band 2, and Band 3 colors to match your preferences. The defaults are Aqua, Fuchsia, and Purple. The main VWAP line color adapts dynamically based on slope direction or can be set to static blue.
Q: How do I set up alerts?
A: Right-click on the chart, select Add Alert, choose this indicator, and select your desired condition from the dropdown. All conditions include descriptive alert messages with relevant data.
Q: What is the Probability Engine lookback period?
A: This setting determines how many trading days the indicator analyzes to calculate band touch rates and mean reversion statistics. Default is 60 days (approximately 3 months). Longer periods provide more stable statistics but may miss recent behavior changes.
Q: Why do I see fewer labels than expected?
A: Signal labels (Volume, Momentum, Squeeze, Divergence) are limited to 5 most recent labels on the chart to keep it clean. When a new label appears, the oldest one is automatically removed. Additionally, momentum labels have several filters: check the slope multiplier setting (higher values require stronger trends) and the Only Reversal Signals option (when enabled, labels only appear for potential reversals, not trend confirmations).
Q: What is the Calculated Projection and how accurate is it?
A: The Calculated Projection analyzes what happened in past market conditions similar to the current state. It classifies each bar by Z-Score level, Trend direction, and Volume profile (27 unique states), then shows the historical probability of up vs down and the average move size. It is NOT a price prediction or guarantee. The probability shown is how often similar conditions led to up/down moves historically, not a future guarantee. Always use it as one input among many.
Q: Why does the Projection probability change?
A: The projection updates on each bar as market state changes. If Z-Score moves from LOW to MID, or trend shifts from UP to FLAT, the system looks up a different historical category. This is expected behavior. The projection shows what happened in similar past conditions to the current bar's state.
Q: The Projection shows LOW confidence. What does that mean?
A: Confidence levels indicate sample size: HIGH means 30 or more historical cases found, MEDIUM means 15-29 cases, LOW means fewer than 15 cases. When sample size is low, the system uses a fallback: first aggregating by Z-Score plus Trend only (ignoring volume), then by Z-Score only. LOW confidence means less statistical reliability, so weight other factors more heavily in your decision.
Q: Why does the cone sometimes show 50/50 probability?
A: A 50/50 reading means that in similar past market states, price moved up roughly half the time and down half the time. This indicates a neutral or balanced condition where historical patterns provide no directional edge. Consider waiting for a higher probability setup or using other analysis methods.
CREDITS AND ACKNOWLEDGMENTS
Methodology Foundation:
VWAP (Volume Weighted Average Price) - Standard institutional benchmark calculation, widely used since the 1980s for algorithmic execution and fair value assessment
Standard Deviation Bands - Statistical volatility measurement applying normal distribution principles to price deviation from mean
Z-Score Analysis - Classic statistical normalization technique for comparing values across different volatility regimes
Cumulative Volume Delta (CVD) - Order flow analysis concept measuring aggressive buying versus selling pressure
Concept Integration:
Mean reversion probability engine - Custom historical statistics tracking for band touch rates
Momentum acceleration detection - Second derivative analysis of VWAP slope changes
VWAP Squeeze - Volatility compression concept adapted from TTM Squeeze methodology applied to VWAP bands versus ATR
Confidence scoring system - Weighted composite scoring combining multiple technical factors
Calculated Projection Cone - Probability-based projection using 27-state market classification (Z-Score, Trend, Volume) with historical outcome analysis and weighted fallback system
All calculations use standard public domain formulas and TradingView built-in functions. No proprietary third-party code was used.
For questions, feedback, or feature requests, please comment below or send a private message.
Happy Trading!

Time-based levelsScript to plot time-based levels such as yearly/quarterly/monthly/Monday open, Monday range, previous month/week/day range.
This script does NOT handle sessions, therefore it's better suited for crypto which is 24/7.
There are various display options.
- Monday open is displayed immediately, but Monday High / Low / Mid 50% are displayed from Tuesday (i.e. when Monday closes and H/L are set for good)
This behaviour can be overridden using the appropriate option within the indicator's inputs parameters
- Levels are time-frame dependant (for instance, a daily level such as "Monday open" only shows on D1 TF and lower TF)
- To avoid redundancies:
* Yearly open is not displayed on January (redundant with monthly open)
* Quarterly open is not displayed on January, April, July and October (redundant with monthly open), neither on Feb. and March (redundant with yearly open)
* Previous day High / Low / Mid 50% are not displayed on Tuesday (redundant with Monday open / High / Low / Mid 50%)
* Daily open is not displayed on Monday (redundant with Monday open)
- Alerts can be created when prices crosses levels such as yearly/quarterly/monthly/Monday open, Monday range, previous month/week/day range
Known issue (TradingView ticket opened as issue is on their side):
On the W1 TF, if the current week spans over 2 months, the monthly open will be incorrect and still use the previous month open instead.
Once the week closes, the monthly open will be displayed correctly. This issue is not present on other TF.
Example: on Feb. 2nd 2023, when W1 TF is selected, monthly open shows January open instead of February open.

ApicodeLibrary "Apicode"
percentToTicks(percent, from)
Converts a percentage of the average entry price or a specified price to ticks when the
strategy has an open position.
Parameters:
percent (float) : (series int/float) The percentage of the `from` price to express in ticks, e.g.,
a value of 50 represents 50% (half) of the price.
from (float) : (series int/float) Optional. The price from which to calculate a percentage and convert
to ticks. The default is `strategy.position_avg_price`.
Returns: (float) The number of ticks within the specified percentage of the `from` price if
the strategy has an open position. Otherwise, it returns `na`.
percentToPrice(percent, from)
Calculates the price value that is a specific percentage distance away from the average
entry price or a specified price when the strategy has an open position.
Parameters:
percent (float) : (series int/float) The percentage of the `from` price to use as the distance. If the value
is positive, the calculated price is above the `from` price. If negative, the result is
below the `from` price. For example, a value of 10 calculates the price 10% higher than
the `from` price.
from (float) : (series int/float) Optional. The price from which to calculate a percentage distance.
The default is `strategy.position_avg_price`.
Returns: (float) The price value at the specified `percentage` distance away from the `from` price
if the strategy has an open position. Otherwise, it returns `na`.
percentToCurrency(price, percent)
Parameters:
price (float) : (series int/float) The price from which to calculate the percentage.
percent (float) : (series int/float) The percentage of the `price` to calculate.
Returns: (float) The amount of the symbol's currency represented by the percentage of the specified
`price`.
percentProfit(exitPrice)
Calculates the expected profit/loss of the open position if it were to close at the
specified `exitPrice`, expressed as a percentage of the average entry price.
NOTE: This function may not return precise values for positions with multiple open trades
because it only uses the average entry price.
Parameters:
exitPrice (float) : (series int/float) The position's hypothetical closing price.
Returns: (float) The expected profit percentage from exiting the position at the `exitPrice`. If
there is no open position, it returns `na`.
priceToTicks(price)
Converts a price value to ticks.
Parameters:
price (float) : (series int/float) The price to convert.
Returns: (float) The value of the `price`, expressed in ticks.
ticksToPrice(ticks, from)
Calculates the price value at the specified number of ticks away from the average entry
price or a specified price when the strategy has an open position.
Parameters:
ticks (float) : (series int/float) The number of ticks away from the `from` price. If the value is positive,
the calculated price is above the `from` price. If negative, the result is below the `from`
price.
from (float) : (series int/float) Optional. The price to evaluate the tick distance from. The default is
`strategy.position_avg_price`.
Returns: (float) The price value at the specified number of ticks away from the `from` price if
the strategy has an open position. Otherwise, it returns `na`.
ticksToCurrency(ticks)
Converts a specified number of ticks to an amount of the symbol's currency.
Parameters:
ticks (float) : (series int/float) The number of ticks to convert.
Returns: (float) The amount of the symbol's currency represented by the tick distance.
ticksToStopLevel(ticks)
Calculates a stop-loss level using a specified tick distance from the position's average
entry price. A script can plot the returned value and use it as the `stop` argument in a
`strategy.exit()` call.
Parameters:
ticks (float) : (series int/float) The number of ticks from the position's average entry price to the
stop-loss level. If the position is long, the value represents the number of ticks *below*
the average entry price. If short, it represents the number of ticks *above* the price.
Returns: (float) The calculated stop-loss value for the open position. If there is no open position,
it returns `na`.
ticksToTpLevel(ticks)
Calculates a take-profit level using a specified tick distance from the position's average
entry price. A script can plot the returned value and use it as the `limit` argument in a
`strategy.exit()` call.
Parameters:
ticks (float) : (series int/float) The number of ticks from the position's average entry price to the
take-profit level. If the position is long, the value represents the number of ticks *above*
the average entry price. If short, it represents the number of ticks *below* the price.
Returns: (float) The calculated take-profit value for the open position. If there is no open
position, it returns `na`.
calcPositionSizeByStopLossTicks(stopLossTicks, riskPercent)
Calculates the entry quantity required to risk a specified percentage of the strategy's
current equity at a tick-based stop-loss level.
Parameters:
stopLossTicks (float) : (series int/float) The number of ticks in the stop-loss distance.
riskPercent (float) : (series int/float) The percentage of the strategy's equity to risk if a trade moves
`stopLossTicks` away from the entry price in the unfavorable direction.
Returns: (int) The number of contracts/shares/lots/units to use as the entry quantity to risk the
specified percentage of equity at the stop-loss level.
calcPositionSizeByStopLossPercent(stopLossPercent, riskPercent, entryPrice)
Calculates the entry quantity required to risk a specified percentage of the strategy's
current equity at a percent-based stop-loss level.
Parameters:
stopLossPercent (float) : (series int/float) The percentage of the `entryPrice` to use as the stop-loss distance.
riskPercent (float) : (series int/float) The percentage of the strategy's equity to risk if a trade moves
`stopLossPercent` of the `entryPrice` in the unfavorable direction.
entryPrice (float) : (series int/float) Optional. The entry price to use in the calculation. The default is
`close`.
Returns: (int) The number of contracts/shares/lots/units to use as the entry quantity to risk the
specified percentage of equity at the stop-loss level.
exitPercent(id, lossPercent, profitPercent, qty, qtyPercent, comment, alertMessage)
A wrapper for the `strategy.exit()` function designed for creating stop-loss and
take-profit orders at percentage distances away from the position's average entry price.
NOTE: This function calls `strategy.exit()` without a `from_entry` ID, so it creates exit
orders for *every* entry in an open position until the position closes. Therefore, using
this function when the strategy has a pyramiding value greater than 1 can lead to
unexpected results. See the "Exits for multiple entries" section of our User Manual's
"Strategies" page to learn more about this behavior.
Parameters:
id (string) : (series string) Optional. The identifier of the stop-loss/take-profit orders, which
corresponds to an exit ID in the strategy's trades after an order fills. The default is
`"Exit"`.
lossPercent (float) : (series int/float) The percentage of the position's average entry price to use as the
stop-loss distance. The function does not create a stop-loss order if the value is `na`.
profitPercent (float) : (series int/float) The percentage of the position's average entry price to use as the
take-profit distance. The function does not create a take-profit order if the value is `na`.
qty (float) : (series int/float) Optional. The number of contracts/lots/shares/units to close when an
exit order fills. If specified, the call uses this value instead of `qtyPercent` to
determine the order size. The exit orders reserve this quantity from the position, meaning
other orders from `strategy.exit()` cannot close this portion until the strategy fills or
cancels those orders. The default is `na`, which means the order size depends on the
`qtyPercent` value.
qtyPercent (float) : (series int/float) Optional. A value between 0 and 100 representing the percentage of the
open trade quantity to close when an exit order fills. The exit orders reserve this
percentage from the open trades, meaning other calls to this command cannot close this
portion until the strategy fills or cancels those orders. The percentage calculation
depends on the total size of the applicable open trades without considering the reserved
amount from other `strategy.exit()` calls. The call ignores this parameter if the `qty`
value is not `na`. The default is 100.
comment (string) : (series string) Optional. Additional notes on the filled order. If the value is specified
and not an empty "string", the Strategy Tester and the chart show this text for the order
instead of the specified `id`. The default is `na`.
alertMessage (string) : (series string) Optional. Custom text for the alert that fires when an order fills. If the
value is specified and not an empty "string", and the "Message" field of the "Create Alert"
dialog box contains the `{{strategy.order.alert_message}}` placeholder, the alert message
replaces the placeholder with this text. The default is `na`.
Returns: (void) The function does not return a usable value.
closeAllAtEndOfSession(comment, alertMessage)
A wrapper for the `strategy.close_all()` function designed to close all open trades with a
market order when the last bar in the current day's session closes. It uses the command's
`immediately` parameter to exit all trades at the last bar's `close` instead of the `open`
of the next session's first bar.
Parameters:
comment (string) : (series string) Optional. Additional notes on the filled order. If the value is specified
and not an empty "string", the Strategy Tester and the chart show this text for the order
instead of the automatically generated exit identifier. The default is `na`.
alertMessage (string) : (series string) Optional. Custom text for the alert that fires when an order fills. If the
value is specified and not an empty "string", and the "Message" field of the "Create Alert"
dialog box contains the `{{strategy.order.alert_message}}` placeholder, the alert message
replaces the placeholder with this text. The default is `na`.
Returns: (void) The function does not return a usable value.
closeAtEndOfSession(entryId, comment, alertMessage)
A wrapper for the `strategy.close()` function designed to close specific open trades with a
market order when the last bar in the current day's session closes. It uses the command's
`immediately` parameter to exit the trades at the last bar's `close` instead of the `open`
of the next session's first bar.
Parameters:
entryId (string)
comment (string) : (series string) Optional. Additional notes on the filled order. If the value is specified
and not an empty "string", the Strategy Tester and the chart show this text for the order
instead of the automatically generated exit identifier. The default is `na`.
alertMessage (string) : (series string) Optional. Custom text for the alert that fires when an order fills. If the
value is specified and not an empty "string", and the "Message" field of the "Create Alert"
dialog box contains the `{{strategy.order.alert_message}}` placeholder, the alert message
replaces the placeholder with this text. The default is `na`.
Returns: (void) The function does not return a usable value.
sortinoRatio(interestRate, forceCalc)
Calculates the Sortino ratio of the strategy based on realized monthly returns.
Parameters:
interestRate (simple float) : (simple int/float) Optional. The *annual* "risk-free" return percentage to compare against
strategy returns. The default is 2, meaning it uses an annual benchmark of 2%.
forceCalc (bool) : (series bool) Optional. A value of `true` forces the function to calculate the ratio on the
current bar. If the value is `false`, the function calculates the ratio only on the latest
available bar for efficiency. The default is `false`.
Returns: (float) The Sortino ratio, which estimates the strategy's excess return per unit of
downside volatility.
sharpeRatio(interestRate, forceCalc)
Calculates the Sharpe ratio of the strategy based on realized monthly returns.
Parameters:
interestRate (simple float) : (simple int/float) Optional. The *annual* "risk-free" return percentage to compare against
strategy returns. The default is 2, meaning it uses an annual benchmark of 2%.
forceCalc (bool) : (series bool) Optional. A value of `true` forces the function to calculate the ratio on the
current bar. If the value is `false`, the function calculates the ratio only on the latest
available bar for efficiency. The default is `false`.
Returns: (float) The Sortino ratio, which estimates the strategy's excess return per unit of
total volatility.
