Weiss Wave Open Interest BarsFirstly :
LazyBear ' s "Weiss Wave " codes are used for open interests.
Original Weiss Wave Volume :
Let's start :
Open Interest vs. Volume: An Overview
Volume and open interest are two key measurements that describe the liquidity and activity of contracts In the options and futures markets. However, their meanings and applications are different. Volume refers to the number of contracts traded in a given period, while open interest denotes the number of active contracts.
Volume
Trading volume measures the number of options or futures contracts being exchanged between buyers and sellers, identifying the level of activity for that particular contract. For every buyer, there is a seller, and the transaction itself counts toward the daily volume.
Open Interest
Open interest indicates the number of options or futures contracts that are held by traders and investors in active positions. These positions have not been closed out, expired, or exercised. Open interest decreases when holders and writers of options (or buyers and sellers of futures) close out their positions. To close out positions, they must take offsetting positions or exercise their options. Open interest increases once again when investors and traders open new long positions or writers/sellers take on new short positions. Open interest also increases when new options or futures contracts are created.
Options or futures contract trading volume can only increase while open interest can either increase or decrease. While trading volume indicates the number of contracts that have been bought or sold, open interest identifies the number of contracts that are currently held.
Reference : www.investopedia.com
*** Worked to define all futures . You can look them in codes (between line : 13 to line 94 )
** CAUTION 1 : Since each instrument in the list has its own unique contract data, you must first enter its name to display it. I recommend you to select OANDA from the markets. Finally, when the COT reports are issued, it may repaints. However, this repaint is usually close to closing or after close .(When COT reports are so sharp ) So use this script only 1W ( 1 week ) or 1 M ( 1 month ) timeframe.
** CAUTION 2 : This data is taken to Tradingview with the help of Quandl. This is a tremendous possibility, but the system will not work if there is a malfunction.
Best regards.
Search in scripts for "纳斯达克期货cfd"

SJ Fx Session RangeSJ Fx Session Range Indicator
A Professional Forex Session Tracking Tool with Opening Range Analysis
Overview
The SJ Fx Session Range indicator is a comprehensive tool designed to help forex traders visualize major trading sessions (Asia, Europe+London, and New York) along with their first 15-minute opening ranges. Built with Pine Script v5, this indicator provides clear session boundaries, high/low ranges, and customizable opening range analysis to enhance your trading decisions.
Key Features
1. Trading Session Boxes
- Three major forex sessions: Asia, Europe+London, and New York
- Color-coded session boxes with transparent backgrounds for easy visualization
- Automatic session high/low tracking
- Session labels displayed inside boxes for quick identification
- Displays up to 50 historical sessions for pattern analysis
2. Opening Range Analysis
- Tracks first 15-minute opening range for Europe, London, and NY sessions
- Plots high, low, and mid-range levels
- Customizable line colors for each session's opening range
- Background highlights during the first 15 minutes of each session
- Helps identify potential breakout or reversal zones
3. Daylight Saving Time Support
- Built-in DST toggle for easy seasonal adjustment
- Automatically adjusts all session timings by 1 hour when enabled
- Clear tooltip instructions for when to enable/disable DST
- Default timings configured for IST timezone (Asia/Kolkata)
4. User-Friendly Design
- Clean input interface organized by session categories
- Fixed optimal settings for boxes and lines (50-day history)
- All session times are easily customizable with helpful tooltips
- Warning tooltips to prevent accidental timing changes
Default Session Times (when DST is disabled)
- Asia Session: 04:00 - 12:30 IST
- Europe + London Session: 12:30 - 20:00 IST
- New York Session: 20:00 - 02:30 IST
How to Use
1. Add to Chart: Apply the indicator to any forex pair chart
2. Adjust DST: Enable the "Start Daylight Saving Time Change" checkbox on the second Sunday in March; disable on the first Sunday in November
3. Customize Sessions: Toggle individual sessions on/off based on your trading preference
4. Opening Range Colors: Customize the opening range line colors for better visibility
5. Session Times: Default times are optimized for IST; modify only if trading from a different timezone
Technical Specifications
- Version: Pine Script v5
- Overlay: Yes (draws directly on price chart)
- Maximum Objects: 500 boxes, 500 lines
- History: 50 days of session data
- Timezone: Asia/Kolkata (IST) - customizable in code
Use Cases
- Identify high-liquidity trading periods
- Track session volatility patterns
- Monitor opening range breakouts/breakdowns
- Analyze session-specific price action
- Plan entries around major session opens
- Avoid trading during low-liquidity periods
Performance
Optimized for efficient rendering with:
- Fixed 50-day history limit for optimal performance
- Automatic cleanup of old session boxes and lines
- Lightweight code structure for fast chart loading
Customization Options
Available Inputs:
- Enable/disable individual sessions
- Adjust session timings (with safety tooltips)
- Toggle DST on/off
- Show/hide opening range analysis
- Customize opening range line colors for each session
Fixed for Optimal Performance:
- Session box colors (Asia: Aqua, Europe: Green, NY: Red)
- 50-day historical display
- Line width and style
- Mid-range line always displayed
Educational Value
This indicator helps traders:
- Understand forex market structure and session overlaps
- Recognize high-probability trading times
- Develop session-based trading strategies
- Improve timing of trade entries and exits
Open Source License
This script is published under Mozilla Public License 2.0, allowing you to:
- Use freely for personal trading
- Modify and adapt to your needs
- Learn from the code structure
- Share improvements with the community
Credits
Developed by Shantanu Joshi
- Designed for forex traders focusing on session-based strategies
- Built with clean, well-documented Pine Script v5 code
- Regular updates and improvements based on user feedback
Support & Feedback
If you find this indicator useful:
- Give it a thumbs up
- Share your trading results in the comments
- Suggest improvements or new features
- Report any issues for quick resolution
Disclaimer
This indicator is for educational and informational purposes only. It does not constitute financial advice. Always conduct your own research and risk management before making trading decisions. Past performance does not guarantee future results.
Compatible with: CFDs of forex pairs, commodities, indices, and crypto.
Best used on: 5-minutes
Recommended chart type: Candlestick charts

TZtraderTZtrader
This is a TrendZones version with features to set stoploss and targets in short and long positions meant for use in intraday charts. It aims to provide signals for opening and closing long and short positions. In the comments under the TrendZones publication several people expressed a need for features for a short position similar to those for a long position as implemented in TrendZones, some want to use it for scalping, some asked for alerts. When I proposed to create a version for day trading with target lines based on ATR, several people liked the idea.
Full disclosure: I don’t do day trading, because, after I lost a lot of money, I had to promise my wife to stay away from it. I restrict myself to long term investing in stocks which are in uptrend. However I understand what a day trader needs. I gather from my experience that day trading or scalping is an attempt to earn something by opening a position in the morning and close, reopen and close it again during the day with a profit. It is usually done with leveraged instruments like CFD’s, futures, options, and what have you. Opening and closing positions is done within minutes, so the trader needs a quick and efficient way to set proper stoploss and target. TZtrader supports this by showing only three or four numbers on the price bar: The price of the instrument, The logical stop level (gray or green or maroon dots), and the target level (navy). All other numbers are suppressed to prevent mistakes. Also a clear feedback for current settings at the top-center of the pane and an alert feedback at bottom that flashes alerts during the development of the current bar and gives suppression status.
The script
First I made a bare bones version of TrendZones to which I added code for long and short trading setups and a bare setup for no position. The code for the logical stops in long setup had to be reviewed, after which this became the basis for stops in short setup.
Then I added code for 10 alert messages, which was a hassle, because this is the first time I coded alerts and the first time I used an array as a stack to avoid a complicated if-then construction. During testing the array caused a runtime error which I solved by adding ‘array.clear’ to the code, also I discovered that in TradingView separate alerts have to be created for all three setups - short, long and bare. Flipping setups is done in the inputs with a dropdown menu because Pine Script has no function for a clickable button.
One visual with three setups.
The visual has the TrendZones structure: Three near parallel very smooth curves, which border the moderate uptrend (green) and downtrend (orange) zone over and under the curve in the middle, the COG (Center Of Gravity). Where the price breaks out of these curves, strong trend zones show up over and under the curves, respectively strong uptrend (blue) and strong downtrend (red).
Three setups were made clearly different to avoid confusion and to provide oversight in case of multiple trades going on simultaneously which I imagine are monitored in one screen. You have to see which one is long, which short and which have no position. The long setup should not trigger short signals, nor should the short trigger long signals nor the bare setup exclusive long or short signals.
The Long setup is default, shown on the example chart. In this setup the Stoploss suggestions (green, gray and maroon dots) are under the price bars and the target line (navy) at a set distance above the High Border. A zone with a width of 1 ATR is drawn under the Low Border. In this setup 5 specific alerts are provided
The Short setup has the Stoploss suggestions over the price bars, the target line at a set distance under the Low Border. A zone with a width of 1 ATR is drawn above the High Border. This setup also has 5 specific alerts.
The Bare setup has no Stoploss suggestions, no target line and supports 4 alerts, 2 in common with the Long setup and 2 with Short.
The table below gives a summary of scripted alerts:
Setup = Where = When = Purpose
Long, Bare = Green Zone = Bars come from lower zones = Uptrend starts
Long, Bare = Green Zone = Sideways ends in uptrend = Uptrend resumes
Long = COG = First crossing = Uptrend might end warning
Long = Orange Zone = Bars come from higher zones = Uptrend ended take care
Long = Red Zone = Bars come from higher zones = Strong downtrend->close Long
Short, Bare = Orange Zone = Bars come from higher zones = Downtrend starts
Short, Bare = Orange Zone = Sideways ends in downtrend = Downtrend resumes
Short = COG = First crossing = Downtrend might end warning
Short = Green Zone = Bars come from lower zones = Downtrend ended take care
Short = Blue Zone = Bars come from lower zones = Strong uptrend -> close short
You can use script alerts in TradingView by clicking the clock in the sidebar, then ‘create alert’ or plus, as condition you choose ‘Tztrader’ in the dialog box, then the “Any alert() function call” option (the first item in the list). The script lets the valid alert trigger by TradingView after the bar is completed, this can differ from the flashed messages during its formation.
When you create alerts in Tradingview, I advice to do that for each setup, then to make only the alert active which matches the current setup, pause the other ones.
Suppressing false and annoying signals
The script has two ways to suppress such signals, which have to do with the numbers in the alert feedback. The numbers left and right of the message with a colored background, depict the zones in which the previous (left) and current (right) bar move. 1 is the strong downtrend zone (red), 2 the moderate downtrend zone (orange), 3 the sideways zones (gray), 4 the COG (gray), 5 the moderate uptrend zone (green), 6 the strong uptrend zone (blue), 7 something went wrong with assigning a zone (black). In extensive testing the number 7 never occurs, because I catch that error in the code. The idea is that an alert is only triggered if the previous bar was in a different zone. When the bars are in the same zone, no alert is possible. This way all annoying signals are suppressed and long, short and bare get the appropriate alerts.
The third number is a counter. It counts how often the COG is crossed without touching the outer curves. The counter will reset to zero when the upper or lower curve is touched. When the count is 1 you have zone situation 4 and appropriate alerts are flashed. When the count is 2 or higher, a sideways situation (3) is called and while the recrossings are going on, no alerts can be flashed. This suppresses false signals. The ATR zone and curves are brownish-gray where sideways happens(ed). When the channel is narrowed down to just the three curves, some false signals still might occur.
Inputs
“Setup”, default is long, drop down menu provides long, short and bare.
“Target ATR”, default is 2, sets the amount of ATR for the target line. In 1 minute charts 4 seems an appropriate setting, you have to learn by experience which setting works.
“show feedback …” default is on, This creates two feedback labels, a Setup feedback on top of the pane, which shows charted instrument, Setup type, Trend and timeframe of the chart. Background color of Trend feedback is green when it matches the setup, red when mismatches and gray when no match. The alert feedback at the bottom of the pane shows a number, a message and two numbers. The numbers will be explained in the chapter about false and annoying signals below. During formation of the bar, valid alerts are flashed with a blue background, otherwise the message ‘alerts for current bar suppressed’.
Logical Stops
The curves are the logical place to put stops, because, as these are averages of the high and low border of a Donchian channel, they signify the ‘natural’ current highest, lowest and main level in the lookback period that fit the monitored trend setup. A downtrend turns into an uptrend when a breakout of the upper curve occurs. If you are short, that is where you want to close position, so the logical place for the stoploss is the upper curve. Vice versa, when you are long, the logical stop is on the lower curve. The stops show up as green or gray dots on the curves, the green dots signify a nice entry level, the gray stops are there to suggest levels where unrealized profits might be secured, the maroon dots indicate that the trend mismatches the setup.
COG versus other lines
Any line used to identify a trend, be it some MA or some other line, is interpreted the same way: When the bars move above the line there is an uptrend and when below, a downtrend. COG is not different in that sense. If you put such a line in the same chart as TZtrader, you can see situations in which the other line shows uptrend or downtrend earlier than COG, also some other lines, e.g. Hull MA, are very good at showing tops and bottoms, while COG ignores these. On the other hand the other lines are usually a little nervous and let you shake out of position too soon. Just like the other lines, COG gives false signals when it is near horizontal. The advantage of the placement COG is the tolerance for pull backs. This way TZtrader keeps you longer in the trend. Such pull backs are often ‘flags’ which are interpreted in TA as confirming the trend. Tztrader aims to get you in position reasonably soon when a trend begins and out of position as soon as the trend turns against you. The placement of COG is done with a fundamentally different algorithm than other lines as it is not an average of prices, but the middle of two averages of borders of a Donchian channel. This gives the two zones between the curves the same quality as the two zones above and below the middle line of a standard Donchian Channel.
A multi timeframe application.
In this scenario you put a 5 minutes and 1 minute chart with Tztrader side by side. If the 5 minutes shows uptrend, set the 1 minute on long trading and open positions when the trend matches uptrend en close when it mismatches. Don’t open short positions. Once the 5 minute changes to downtrend, set Tztrader in the 1 minute to short trading and open positions when the trend matches downtrend and close when it mismatches.
The idea is that in a long ‘context’, provided by the 5 minutes, the uptrends in the 1 minute will last longer and go further, vice versa for the short ‘context’. This way you do swing trading in the 5 minute in a smart way, maximizing profits.
You can do this with any timeframe pairs with a proportion of around 5:1, 4:1, 6:1, like e.g. 60 minutes and 15 minutes or weeks and days (5 trading days in a week).
Dear day-traders, may this tool be helpful and may your days be blessed.
Take care

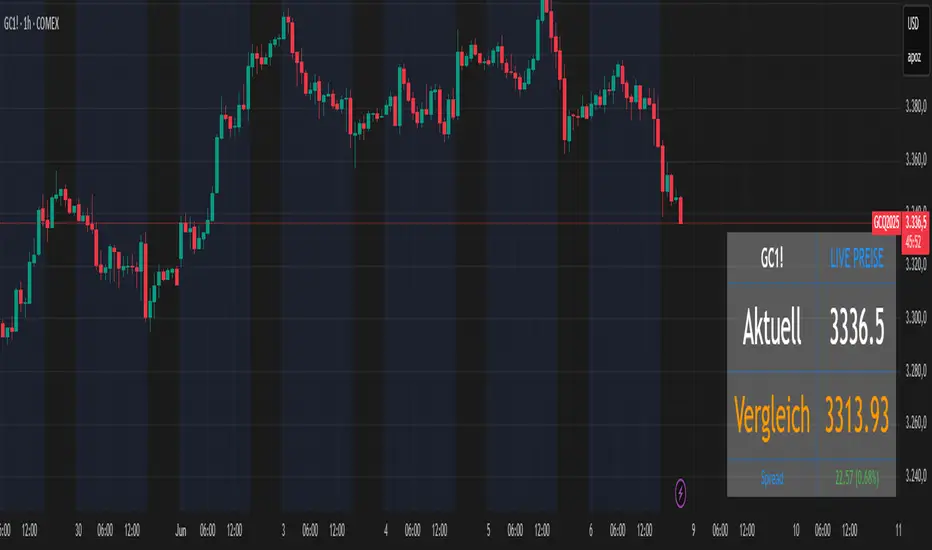
Futures vs CFD Price Display
🎯 Trading the same asset in CFDs and Futures but tired of switching charts to compare prices? This is your indicator!
Stop the constant chart hopping! This live price comparison shows you instantly where the better conditions are.
✨ What you get:
Bidirectional: Works in both Futures AND CFD charts
Live prices: Real-time comparison of both markets
Spread calculation: Automatic difference in points and percentage
Fully customizable: Colors, position, size to your liking
Professional design: Clean display with symbol header
🎯 Perfect for:
Gold traders (Futures vs CFD)
Arbitrage strategies
Spread monitoring
Multi-broker comparisons
⚙️ Customization:
3 sizes (Small/Normal/Large) for all screens
4 positions available
Individual color schemes
Toggle features on/off
💡 Simply enter the symbol and keep both markets in sight!
Notice: "Co-developed with Claude AI (Anthropic) - because even AI needs to pay the server bills! 😄"
Auto Position CalculatorA position sizing tool that automatically detects the instrument you're trading and calculates the correct position size based on your risk parameters.
What It Does
This indicator calculates how many contracts, lots, or shares to trade based on your account size, risk percentage, and stop loss distance. It auto-detects the instrument type and adjusts the point/pip value accordingly.
Supported Instruments
Futures: NQ, MNQ, ES, MES, YM, MYM, RTY, M2K, CL, MCL, GC, MGC
Forex: All major pairs (USD, EUR, GBP, JPY, etc.)
Index CFDs: NAS100, US500, US30, GER40, UK100
Metals: XAU, XAG
Crypto and Stocks: Automatic detection
How to Use
Set your account size and risk % in settings
Click the settings icon and place Entry, Stop Loss, and Take Profit on the chart
The position size and risk calculations appear automatically
Levels auto-reset at your chosen session (Asia, London, or New York open)
Limitations
CFD and forex pip values assume standard lot sizing - your broker may differ
Auto-detection relies on ticker naming conventions, which vary by broker/data feed
Session reset times are based on ET (Eastern Time)

Cash Gaps on a Future/CFD-ChartThe script is based on the great work of @NgUTech which very nicely prints the gaps on any given chart.
The purpose of this script is to show the gaps to futures or cfd of the underlying cash chart, because very often gap closing provides an opportunity to fade the move.
The script works in the way that the user provides the underlying chart symbol and the current spread of the instruments (cash-future/cfd) and it draws boxes where the cash-gaps are.
If you know a way to automatically calculate the spread of the two instruments, please let me know, thanks.
Michael

FluxPulse Momentum [JOAT]FluxPulse Momentum - Adaptive Multi-Component Oscillator
FluxPulse Momentum is a composite oscillator that blends three distinct momentum components into a single, smoothed signal line. Rather than relying on a single indicator, it synthesizes adaptive RSI, normalized rate of change, and a Kaufman-style efficiency ratio to provide a multi-dimensional view of momentum.
What This Indicator Does
Combines RSI, Rate of Change (ROC), and Efficiency Ratio into one weighted composite
Applies EMA smoothing to reduce noise while preserving responsiveness
Displays overbought/oversold zones with optional background highlighting
Generates buy/sell signals when the oscillator crosses its signal line in favorable zones
Provides a real-time dashboard showing current state, momentum direction, and efficiency
Core Components
Adaptive RSI (50% weight) — Standard RSI calculation normalized around the 50 level
Normalized ROC (30% weight) — Rate of change scaled relative to its recent maximum range
Efficiency Ratio (20% weight) — Measures directional movement efficiency, inspired by Kaufman's adaptive concepts
The final composite is smoothed twice using EMA to create both a fast line and a signal line.
Signal Logic
// Buy signal: crossover in lower half
buySignal = ta.crossover(qmo, qmoSmooth) and qmo < 50
// Sell signal: crossunder in upper half
sellSignal = ta.crossunder(qmo, qmoSmooth) and qmo > 50
Signals are generated only when the oscillator is positioned favorably—buy signals occur below the 50 midline, sell signals occur above it.
Dashboard Information
The on-chart table displays:
Current oscillator value with gradient coloring
Momentum state (Overbought, Oversold, Bullish, Bearish, Neutral)
Momentum direction and acceleration
Efficiency ratio percentage
Active signal status
Inputs Overview
RSI Length — Period for RSI calculation (default: 14)
ROC Length — Period for rate of change (default: 10)
Smoothing Length — EMA smoothing period (default: 3)
Overbought/Oversold Levels — Threshold levels for zone detection
Await Bar Confirmation — Wait for bar close before triggering alerts
How to Use It
Watch for crossovers between the main line and signal line
Use overbought/oversold zones to identify potential reversal areas
Monitor the histogram for momentum acceleration or deceleration
Combine with price action analysis for confirmation
Alerts
Buy Signal — Bullish crossover in the lower zone
Sell Signal — Bearish crossunder in the upper zone
Overbought/Oversold Crosses — Level threshold crossings
This indicator is provided for educational purposes. It does not constitute financial advice. Always conduct your own analysis before making trading decisions.
— Made with passion by officialjackofalltrades

SNIPER ORB V2# 🎯 SNIPER ORB TRADING CHEAT SHEET
## Quick Reference Guide for Live Trading
---
## 📊 VISUAL IDENTIFICATION GUIDE
```
═══════════════════════════════════════════════════════════════════
YOUR CHART AT A GLANCE
═══════════════════════════════════════════════════════════════════
🔵 BRIGHT BLUE LINES (3px) → 5min ORB High/Low
🔷 CYAN LINES (2px) → 15min ORB High/Low
🟣 PURPLE LINES (2px) → 30min ORB High/Low (PRIMARY)
🟢 GREEN DASHED LINES (1px) → Upside targets (1x, 2x, 3x from 30min ORB)
🔴 RED DASHED LINES (1px) → Downside targets (1x, 2x, 3x from 30min ORB)
🟡 GOLD LINE (2px) → Anchored VWAP (9:30 AM anchor for NY, 3:00 AM for London)
📋 INFO TABLE (top-right) → Shows live ORB ranges, VWAP price, status
═══════════════════════════════════════════════════════════════════
```
**KEY DIFFERENCE FROM OTHER ORB INDICATORS:**
- You see **ALL 3 ORB PERIODS SIMULTANEOUSLY** (5min, 15min, 30min)
- Targets calculated from **30min ORB ONLY** (not 5min or 15min)
- **NO BOX FILLS** - clean line-only display for sniper precision
- Auto-disappears at session end (no clutter from old sessions)
---
## 🔘 NEW FEATURE: ORB DISPLAY TOGGLES
**You now have FULL CONTROL over which ORB periods to display!**
```
In indicator settings → "ORB Display" section:
☑ Show 5min ORB → Toggle blue lines ON/OFF
☑ Show 15min ORB → Toggle cyan lines ON/OFF
☑ Show 30min ORB → Toggle purple lines ON/OFF
USE CASES:
━━━━━━━━━━━━━━━━━━━━━━━━━━━━━━━━━━━━━━━━━━━━━━━
1. FOCUS MODE (30min only)
☐ 5min ☐ 15min ☑ 30min
→ Clean chart, just your primary trading range
→ Best for beginners or minimalist traders
2. EARLY WARNING MODE (5min + 30min)
☑ 5min ☐ 15min ☑ 30min
→ See early breaks with 5min, trade 30min confirmation
→ Reduces visual noise from 15min
3. CONFLUENCE MODE (all 3 ORBs)
☑ 5min ☑ 15min ☑ 30min
→ Maximum information, all alignment signals
→ For advanced traders seeking highest probability
4. INTRADAY SCALP MODE (5min only)
☑ 5min ☐ 15min ☐ 30min
→ Ultra-fast entries on 5min breaks
→ High-risk, high-frequency approach
━━━━━━━━━━━━━━━━━━━━━━━━━━━━━━━━━━━━━━━━━━━━━━━
💡 PRO TIP: Start with 30min only, then add 5min/15min as you gain experience
```
---
## 🎯 FIXED: ANCHORED VWAP (TIMESTAMP-BASED)
**The VWAP now anchors with SURGICAL PRECISION to the exact session start candle!**
```
LONDON SESSION:
• Anchors at the EXACT 3:00 AM ET candle
• Uses timestamp checking: hour == 3 AND minute == 0
• Resets every morning at London Open
NEW YORK SESSION:
• Anchors at the EXACT 9:30 AM ET candle
• Uses timestamp checking: hour == 9 AND minute == 30
• Resets every day at NY Open
WHAT THIS MEANS:
✅ VWAP starts accumulating from the first tick of the session
✅ No more "off by one bar" errors
✅ Institutional-grade VWAP anchoring
✅ Perfect alignment with your ORB start times
HOW TO VERIFY IT'S WORKING:
1. Load indicator on 1min or 5min chart
2. Find the exact 9:30 AM candle (NY) or 3:00 AM candle (London)
3. VWAP should START appearing from that exact bar
4. Not the bar before, not the bar after - THAT EXACT BAR
```
---
## ⏰ SESSION TIMING MATRIX
| Session | Start Time | 5min Complete | 15min Complete | 30min Complete | Session End |
|---------|-----------|---------------|----------------|----------------|-------------|
| **London** | 3:00 AM ET | 3:05 AM | 3:15 AM | 3:30 AM | 9:30 AM ET (disappears) |
| **New York** | 9:30 AM ET | 9:35 AM | 9:45 AM | 10:00 AM | 5:00 PM ET (disappears) |
**💡 GOLDEN RULES:**
1. **WAIT FOR 30MIN ORB TO COMPLETE** before trading targets (10:00 AM NY / 3:30 AM London)
2. Use 5min and 15min ORBs as **early warning signals** only
3. All ORB lines + VWAP **auto-delete** at session end (clean chart)
---
## 🎯 THE 3-ORB SYSTEM: HOW IT WORKS
### **Hierarchical ORB Structure**
```
TIME: 9:30 AM ─────────────────────────────────> 10:00 AM ──────> 5:00 PM
↓ ↓
SESSION START 30min ORB COMPLETE
(all 3 ORBs begin forming) (targets appear)
📍 5min ORB (9:30-9:35 AM): ━━━━━━━━━━━━━━━━━━━━━━━━━━━━━━━━━━━━━>
Purpose: EARLY breakout signal, fastest-moving boundary
📍 15min ORB (9:30-9:45 AM): ━━━━━━━━━━━━━━━━━━━━━━━━━━━━━━━━━━━━━>
Purpose: MID-TERM institutional reference level
📍 30min ORB (9:30-10:00 AM): ━━━━━━━━━━━━━━━━━━━━━━━━━━━━━━━━━━━━━>
Purpose: PRIMARY TRADING RANGE - all targets calculated from this
🎯 TARGETS (10:00 AM onward): ▪ ▪ ▪ ▪ ▪ (1x, 2x, 3x from 30min ORB)
Purpose: Profit-taking levels based on 30min range
```
**Why 3 ORBs Instead of 1?**
- **5min ORB**: Captures early institutional positioning (first 5 minutes)
- **15min ORB**: Confirms directional bias (more stable than 5min)
- **30min ORB**: Full market digestion of overnight news + opening orders
- **Confluence = Higher Win Rate**: When all 3 align, breakouts are extremely reliable
---
## 🎯 THE 5 HIGH-PROBABILITY SETUPS
### **SETUP #1: TRIPLE ORB BREAKOUT CONFLUENCE** ⭐⭐⭐⭐⭐
```
CONDITIONS:
✅ 30min ORB complete (10:00 AM NY / 3:30 AM London)
✅ Price breaks ALL 3 ORBs simultaneously:
• 5min high/low (blue line)
• 15min high/low (cyan line)
• 30min high/low (purple line)
✅ VWAP confirms direction (below price = bullish, above = bearish)
✅ Volume spike on breakout candle
ENTRY: Close of breakout candle (must close beyond ALL 3 ORBs)
STOP: Inside 30min ORB at 30m low (long) or 30m high (short)
TARGET 1: First green/red dashed line (0.5x 30m range)
TARGET 2: Second target (1x 30m range)
TARGET 3: Third target (1.5x 30m range)
WIN RATE: 75-85% | R:R = 1:2.5 minimum
NOTES: When all 3 ORBs align, institutional order flow is unanimous
```
---
### **SETUP #2: 5MIN EARLY BREAKOUT → 30MIN CONFIRMATION** ⭐⭐⭐⭐
```
CONDITIONS:
✅ Price breaks 5min ORB first (blue line crossed)
✅ 15min ORB holds initially (cyan line not crossed yet)
✅ After 30min ORB completes, price breaks 30min boundary (purple)
✅ VWAP alignment confirms direction
✅ All 3 ORBs now broken in same direction
ENTRY: When 30min ORB breaks (purple line) + 5min/15min already broken
STOP: 30min ORB opposite boundary
TARGET 1-3: Standard targets from 30min ORB
WIN RATE: 70-80% | R:R = 1:2+
NOTES: 5min gave early warning, 30min confirms institutional commitment
```
---
### **SETUP #3: FALSE 5MIN BREAKOUT → 30MIN REVERSAL** ⭐⭐⭐⭐⭐
```
CONDITIONS:
✅ Price breaks 5min ORB (blue line)
✅ Fails to break 15min or 30min ORBs (cyan/purple lines hold)
✅ Price reverses back inside 5min ORB
✅ Then breaks OPPOSITE side of 30min ORB (purple line)
✅ VWAP flips to confirm new direction
ENTRY: When 30min ORB breaks in OPPOSITE direction of failed 5min break
STOP: Failed 5min breakout high/low (now a liquidity grab zone)
TARGET 1-3: Standard targets
WIN RATE: 80-90% | R:R = 1:3+ (trapped traders forced to exit)
NOTES: Most profitable setup - 5min breakout was liquidity hunt
```
---
### **SETUP #4: TIGHT COMPRESSION → EXPLOSION** ⭐⭐⭐⭐
```
CONDITIONS:
✅ All 3 ORBs tightly overlapping (5m, 15m, 30m within 50 points on YM)
✅ Range < 0.3% of price (very tight consolidation)
✅ VWAP sitting in middle of compression
✅ 30min ORB complete, price still inside all 3
ENTRY: Simultaneous break of ALL 3 ORBs + VWAP cross
STOP: Middle of compression zone
TARGET: 2x-4x normal targets (volatility expansion)
WIN RATE: 65-75% | R:R = 1:5+ (explosive breakout)
NOTES: Low volatility → high volatility shift, institutions coiling spring
```
---
### **SETUP #5: VWAP BOUNCE WITHIN 30MIN ORB** ⭐⭐⭐⭐
```
CONDITIONS:
✅ Price stayed inside 30min ORB for 1+ hours post-formation
✅ VWAP acting as dynamic support (long) or resistance (short)
✅ Price bouncing between VWAP and 30min ORB boundaries
✅ Clear rejection candles at VWAP
ENTRY: When price bounces off VWAP toward 30min ORB boundary
• Long: VWAP bounce up toward 30m high (purple)
• Short: VWAP rejection down toward 30m low (purple)
STOP: Beyond VWAP by 20 points
TARGET: 30min ORB opposite boundary
WIN RATE: 70-80% | R:R = 1:1.5-2
NOTES: Range-bound play, NOT for breakout traders
```
---
## 🛡️ RISK MANAGEMENT RULES
### **Position Sizing by ORB Range**
```
30min ORB Range | Stop Distance | Risk $500 (1%) | YM Contracts
-----------------|------------------|-----------------|-------------
< 50 points | 50 pts | $500 ÷ $250 = | 2 contracts
50-100 points | 100 pts | $500 ÷ $500 = | 1 contract
100-150 points | 150 pts | $500 ÷ $750 = | 0.66 (use 1)
150-200 points | 200 pts | $500 ÷ $1000 = | 0.5 (use 1)
> 200 points | Don't trade | Too wide | Skip setup
Formula: Risk $ ÷ (Stop Distance × $5 per YM point) = Max Contracts
```
### **The 3-Strike Rule (MANDATORY)**
```
✅ Trade 1: Full position size (based on 30m ORB range)
❌ Stop hit → Trade 2: HALF position size
❌ Stop hit → Trade 3: QUARTER position size
❌ Stop hit → DONE FOR THE DAY (no exceptions)
```
### **Profit Taking Ladder**
```
TARGET 1 (0.5x 30m range): Take 50% off, move stop to breakeven
TARGET 2 (1.0x 30m range): Take 30% off, trail stop by 25 points
TARGET 3 (1.5x 30m range): Take 15% off, let 5% run with 50pt trail
```
---
## ⚠️ DO NOT TRADE IF...
```
🚫 30min ORB incomplete (< 10:00 AM NY / < 3:30 AM London)
🚫 30min ORB range < 40 points YM (too tight, likely chop)
🚫 30min ORB range > 250 points YM (too wide, unpredictable)
🚫 All 3 ORBs wildly divergent (5m=100pts, 15m=180pts, 30m=240pts)
🚫 Major news release within 30 minutes (wait for ORB to reform)
🚫 You've hit 3 losses in the session (3-strike rule)
🚫 You're tired, emotional, revenge trading, or distracted
🚫 Time > 12:00 PM ET (lunch, avoid until 1:00 PM)
🚫 Time > 3:00 PM ET unless Power Hour (3:00-4:00 PM) momentum
```
---
## 🔍 PRE-SESSION CHECKLIST
**15 Minutes Before London (2:45 AM ET) or NY (9:15 AM ET):**
```
□ Check economic calendar (FOMC? NFP? CPI? → extra caution)
□ Review previous session's ORB ranges (context for today's volatility)
□ Load SNIPER ORB on 1min or 5min chart
□ Select correct session: "London" or "New York"
□ Verify indicator settings:
• Number of Targets: 3
• Target % of 30min Range: 50%
• Show Anchored VWAP: ON
□ Set TradingView alerts:
• 30min ORB complete (10:00 AM or 3:30 AM)
• Price crossing 30min high/low
• VWAP crosses
□ Prepare bracket orders mentally (entry, stop, 3 targets)
□ Review yesterday's P&L and lessons learned
□ Set phone to "Do Not Disturb" mode
```
---
## 🎨 INDICATOR SETTINGS GUIDE
### **Core Settings (Updated with Toggles)**
```
SESSION SETTINGS:
━━━━━━━━━━━━━━━━━━━━━━━━━━━━━━━━━━━━━━━━
• Active Session: "London" or "New York"
ORB DISPLAY (NEW!):
━━━━━━━━━━━━━━━━━━━━━━━━━━━━━━━━━━━━━━━━
☑ Show 5min ORB (toggle blue lines)
☑ Show 15min ORB (toggle cyan lines)
☑ Show 30min ORB (toggle purple lines)
💡 Turn OFF any ORB to declutter your chart!
TARGET SETTINGS:
━━━━━━━━━━━━━━━━━━━━━━━━━━━━━━━━━━━━━━━━
• Number of Targets: 3 (default)
• Target % of 30min Range: 50% (default)
VWAP SETTINGS:
━━━━━━━━━━━━━━━━━━━━━━━━━━━━━━━━━━━━━━━━
☑ Show Anchored VWAP
• VWAP Color: Gold (#FFC107)
• VWAP Width: 2px
```
### **Color Customization (Optimized for Dark Charts)**
```
DEFAULT COLORS:
━━━━━━━━━━━━━━━━━━━━━━━━━━━━━━━━━━━━━━━━
5min ORB: Bright Blue (#2196F3) - 3px wide
15min ORB: Cyan (#00BCD4) - 2px wide
30min ORB: Purple (#9C27B0) - 2px wide
Upside Targets: Green (#4CAF50) - 1px dashed
Downside Targets: Red (#F44336) - 1px dashed
VWAP: Gold (#FFC107) - 2px solid
━━━━━━━━━━━━━━━━━━━━━━━━━━━━━━━━━━━━━━━━
WHY THESE COLORS?
• Blue family (5m/15m) = short-term, high-frequency
• Purple (30m) = primary, institutional level
• Green/Red = universal up/down
• Gold VWAP = fair value anchor (stands out)
```
### **Settings by Trading Style**
**BEGINNER (Clean & Simple):**
```
ORB Display:
☐ Show 5min ORB
☐ Show 15min ORB
☑ Show 30min ORB (30min only - focus mode)
Number of Targets: 2-3
Target % of 30min Range: 50%
Chart Timeframe: 5-minute
```
**SCALPER (5-15 min holds):**
```
ORB Display:
☑ Show 5min ORB (early signals)
☐ Show 15min ORB
☑ Show 30min ORB (confirmation)
Number of Targets: 5
Target % of 30min Range: 30-40%
Label Size: Tiny
Chart Timeframe: 1-minute
```
**DAY TRADER (30-90 min holds):**
```
ORB Display:
☑ Show 5min ORB
☑ Show 15min ORB
☑ Show 30min ORB (all 3 - confluence mode)
Number of Targets: 3
Target % of 30min Range: 50%
Label Size: Small
Chart Timeframe: 5-minute (RECOMMENDED)
```
**SWING TRADER (2-4 hour holds):**
```
ORB Display:
☐ Show 5min ORB (too noisy for swings)
☑ Show 15min ORB
☑ Show 30min ORB
Number of Targets: 2-3
Target % of 30min Range: 75-100%
Label Size: Normal
Chart Timeframe: 15-minute
```
---
## 📈 TIMEFRAME SELECTION GUIDE
| Your Timeframe | What You See | Best For |
|---------------|--------------|----------|
| **1-minute** | Every tick, high noise | Scalping, precision entries |
| **5-minute** | Balanced clarity | Day trading (RECOMMENDED) |
| **15-minute** | Clean structure | Swing positions |
| **30-minute** | Too compressed | Not recommended (can't see ORB form) |
**💡 PRO TIP:**
- **Primary chart: 5-minute** (for entries and monitoring)
- **Secondary chart: 1-minute** (for precise timing)
- **Never go above 15-minute** (ORBs won't form properly)
---
## 🧠 READING THE 3-ORB STRUCTURE
### **Bullish Alignment Patterns**
```
PATTERN 1: "Staircase Expansion"
5min: ━━━━ (tight, 60 pts)
15min: ━━━━━━ (wider, 90 pts)
30min: ━━━━━━━━ (widest, 120 pts)
→ Bullish expansion, expect upside breakout
PATTERN 2: "Nested Compression"
5min: ━━ (30 pts)
15min: ━━━ (35 pts)
30min: ━━━━ (40 pts)
→ All tight, explosive breakout likely
PATTERN 3: "Early Commitment"
5min: ━━━━━━ (100 pts, already broken up)
15min: ━━━━━ (80 pts, holding)
30min: ━━━━━ (110 pts, about to break)
→ 5min led the way, 30min confirmation coming
```
### **Bearish Alignment Patterns**
```
PATTERN 1: "Waterfall Setup"
5min: ━━━━ (50 pts, broke down)
15min: ━━━━━ (70 pts, broke down)
30min: ━━━━━━ (90 pts, about to break)
→ Sequential breakdown, strong bearish momentum
PATTERN 2: "Failed Highs"
5min: ━━━━━━ (upper wick rejections)
15min: ━━━━━━ (couldn't break)
30min: ━━━━━━━ (topped out)
→ All 3 rejecting highs, bearish reversal likely
```
### **Neutral/Chop Patterns (AVOID TRADING)**
```
PATTERN 1: "Wide Divergence"
5min: ━━ (30 pts)
15min: ━━━━━━━ (120 pts)
30min: ━━━━━━━━━━━ (200 pts)
→ No consensus, unpredictable, skip
PATTERN 2: "Whipsaw City"
• Price breaking 5min up, then down, then up again
• 15min and 30min not aligned
• VWAP getting crossed every 5 minutes
→ Chop day, step aside, wait for clarity
```
---
## 📊 INTEGRATION WITH YM ULTIMATE SNIPER v8.1
**The 2-System Confluence Method:**
```
┌─────────────────────────────────────────────────────────────┐
│ STEP 1: SNIPER ORB → Defines "Zones That Matter" │
│ • 30min ORB = primary institutional range │
│ • VWAP = fair value anchor │
│ • Targets = profit zones │
│ • 5min/15min = early warning signals │
└─────────────────────────────────────────────────────────────┘
↓
┌─────────────────────────────────────────────────────────────┐
│ STEP 2: YM ULTIMATE SNIPER → Triggers precise entry │
│ • Wait for GOD MODE signal AT 30min ORB boundary │
│ • 6-gate filter: Score ≥9, fat body ≥70%, delta ≥70% │
│ • Candle Dominance Index (CDI) ≥7 │
│ • Intrabar pressure consistent throughout formation │
└─────────────────────────────────────────────────────────────┘
↓
┌─────────────────────────────────────────────────────────────┐
│ STEP 3: EXECUTE TRADE │
│ • ORB breakout + GOD MODE = MAXIMUM PROBABILITY │
│ • Enter ONLY when BOTH systems align │
│ • This is TRUE "sniper" trading (2-5 trades/day max) │
└─────────────────────────────────────────────────────────────┘
```
**Confluence Scoring for Combined System:**
```
SNIPER ORB Criteria:
□ 30min ORB complete (10:00 AM+) +2 points
□ All 3 ORBs broken in same direction +2 points
□ VWAP alignment (below=bull, above=bear) +1 point
□ Volume spike on breakout candle +1 point
□ Tight 3-ORB compression (<100pt divergence) +1 point
YM ULTIMATE SNIPER Criteria:
□ GOD MODE signal at ORB boundary +3 points
□ Score ≥9.0 (tier classification) +1 point
□ Candle Dominance Index (CDI) ≥8 +1 point
TOTAL POSSIBLE: 12 points
TRADE EXECUTION RULES:
• 10-12 points = MAX SIZE (this is the holy grail setup)
• 8-9 points = FULL SIZE (high probability)
• 6-7 points = HALF SIZE (moderate probability)
• <6 points = NO TRADE (wait for better alignment)
```
---
## 💡 COMMON MISTAKES & FIXES
```
❌ MISTAKE: Trading before 30min ORB completes
✅ FIX: Wait until 10:00 AM (NY) or 3:30 AM (London), NO EXCEPTIONS
❌ MISTAKE: Ignoring 5min and 15min ORBs (only watching 30min)
✅ FIX: Use all 3 for confluence - they're your early warning system
❌ MISTAKE: Chasing breakouts 100+ points beyond 30min ORB
✅ FIX: Wait for pullback to VWAP or 30min boundary for re-entry
❌ MISTAKE: Not adjusting target % for market conditions
✅ FIX: Volatile day (ORB >200pts)? Use 75-100% targets
Calm day (ORB <80pts)? Use 30-40% targets
❌ MISTAKE: Trading when all 3 ORBs are wildly different sizes
✅ FIX: Skip the day if 5m/15m/30m diverge by >100pts - no consensus
❌ MISTAKE: Forgetting VWAP position
✅ FIX: VWAP MUST confirm bias:
• Long: price > VWAP
• Short: price < VWAP
• If VWAP contradicts, skip the trade
❌ MISTAKE: Not respecting the 3-strike rule
✅ FIX: 3 losses = DONE for the session, no rationalization
❌ MISTAKE: Trading during lunch (12:00-1:00 PM ET)
✅ FIX: Volume dies, ORBs lose relevance, false signals increase
```
---
## 🔔 ALERT SETUP (ESSENTIAL)
**TradingView Alerts You MUST Set:**
```
ALERT 1: "30min ORB Complete"
• Type: Time-based
• Trigger: 10:00 AM ET (NY) or 3:30 AM ET (London)
• Message: "🎯 30min ORB complete - targets now active"
ALERT 2: "30min ORB High Breakout"
• Type: Crossing Up
• Value 1: Close
• Value 2: 30min ORB High (purple line)
• Message: "🚀 30m ORB HIGH broken - check for long setup"
ALERT 3: "30min ORB Low Breakdown"
• Type: Crossing Down
• Value 1: Close
• Value 2: 30min ORB Low (purple line)
• Message: "📉 30m ORB LOW broken - check for short setup"
ALERT 4: "VWAP Cross"
• Type: Crossing
• Value 1: Close
• Value 2: VWAP
• Message: "⚡ VWAP crossed - check institutional bias shift"
ALERT 5: "Target 1 Hit"
• Type: Crossing
• Value 1: High (for longs) or Low (for shorts)
• Value 2: First target line
• Message: "🎯 Target 1 hit - take 50% off, move stop to BE"
```
---
## 📱 MOBILE TRADING WORKFLOW
**TradingView Mobile App Setup:**
```
1. SAVE LAYOUT
• Chart: 5-minute timeframe
• SNIPER ORB indicator loaded
• YM Ultimate SNIPER v8.1 loaded (if using)
• Save as "SNIPER ORB - YM"
2. ENABLE NOTIFICATIONS
• Settings → Notifications → Push Alerts: ON
• All 5 alerts above configured
3. QUICK ACCESS
• Add YM futures to Watchlist: "MYM" or "YM1!"
• Pin SNIPER ORB layout to favorites
4. EXECUTION READY
• Broker app (TastyTrade, NinjaTrader, etc.) logged in
• Preset bracket orders:
- Entry: market order
- Stop: 30m ORB opposite boundary
- Targets: 3 levels (50%, 30%, 20% of position)
5. BATTERY & CONNECTIVITY
• Phone charged 100% before session
• Stable WiFi or LTE connection
• Backup power bank available
```
---
## 🎓 DAILY PERFORMANCE JOURNAL
**After Each Trading Session (MANDATORY):**
```
═══════════════════════════════════════════════════════════════
DATE: __________ SESSION: □ London □ New York
═══════════════════════════════════════════════════════════════
ORB DATA:
• 5min ORB Range: ______ points
• 15min ORB Range: ______ points
• 30min ORB Range: ______ points
• Alignment: □ Tight □ Moderate □ Wide (skip if wide)
VWAP BEHAVIOR:
• Opening position: □ Above price □ Below price □ Mixed
• Did VWAP act as support/resistance? □ Yes □ No
TRADES TAKEN:
Total Setups Identified: _____
Trades Executed: _____
Win/Loss Record: _____ W / _____ L
Win Rate: _____%
Gross P&L: $_______
Net P&L (after commissions): $_______
BEST TRADE:
• Setup: ____________________ (which of the 5 setups?)
• Entry Price: ______ Exit Price: ______
• Profit: $_______
• What went RIGHT: _________________________________
_________________________________________________
WORST TRADE:
• Setup: ____________________
• Entry Price: ______ Exit Price: ______
• Loss: $_______
• What went WRONG: _________________________________
_________________________________________________
• Lesson Learned: ___________________________________
3-STRIKE RULE STATUS:
□ No losses (great day)
□ 1 loss (still in game)
□ 2 losses (caution, half size)
□ 3 losses (stopped for day, as required)
TOMORROW'S ADJUSTMENTS:
□ _________________________________________________
□ _________________________________________________
□ _________________________________________________
EMOTIONAL STATE TODAY:
□ Calm & focused (optimal)
□ Anxious/rushed (need to work on patience)
□ Overconfident (dial back position size)
□ Fearful (review winning trades to build confidence)
═══════════════════════════════════════════════════════════════
```
---
## 🚀 YOUR FIRST LIVE TRADE WALKTHROUGH
**Step-by-Step for New York Session (Most Common):**
```
⏰ 9:15 AM ET - PREPARATION
□ Load SNIPER ORB on YM 5-minute chart
□ Select "New York" session in indicator settings
□ Verify VWAP is showing (gold line)
□ Check economic calendar (any big news at 9:30?)
□ Prepare mentally: "I will wait for 30min ORB to complete"
⏰ 9:30 AM ET - SESSION OPENS
□ Watch 3 ORBs begin forming:
• Blue lines (5min) will lock in at 9:35 AM
• Cyan lines (15min) will lock in at 9:45 AM
• Purple lines (30min) will lock in at 10:00 AM
□ Observe VWAP anchoring at 9:30 AM candle
□ DO NOT TRADE YET - just observe
⏰ 9:35 AM - 5MIN ORB COMPLETE
□ Note 5min high/low (blue lines locked)
□ Check info table: "5m Range = XX points"
□ If 5min ORB breaks early, note direction but DON'T ENTER
⏰ 9:45 AM - 15MIN ORB COMPLETE
□ Note 15min high/low (cyan lines locked)
□ Compare to 5min ORB: Aligned? Expanding?
□ Still waiting... patience pays
⏰ 10:00 AM - 30MIN ORB COMPLETE (TARGETS APPEAR!)
□ Purple lines locked (30m high/low)
□ Green/red dashed target lines appear automatically
□ Info table shows "Status: ✓ Complete"
□ NOW you can trade breakouts
⏰ 10:00 AM - 11:30 AM - TRADING WINDOW
□ Wait for price to break purple line (30m ORB high or low)
□ Confirm:
1. All 3 ORBs broken in same direction?
2. VWAP confirming (below=bullish, above=bearish)?
3. Volume spike visible?
4. YM SNIPER GOD MODE signal? (if using)
□ If all YES → ENTER TRADE:
• Market order at breakout close
• Stop at 30m ORB opposite boundary
• Targets at green/red dashed lines
⏰ TARGET MANAGEMENT
□ Price hits first target (1x) → Take 50% off, move stop to BE
□ Price hits second target (2x) → Take 30% off, trail stop
□ Price hits third target (3x) → Take 15% off, let 5% run
⏰ 12:00 PM - LUNCH (AVOID TRADING)
□ Volume dies down
□ ORBs become less relevant
□ Take a break, review morning trades
⏰ 1:00 PM - 3:00 PM - AFTERNOON SESSION
□ ORBs still valid but less reliable
□ Consider waiting for Power Hour (3:00-4:00 PM)
⏰ 5:00 PM - SESSION END
□ All ORB lines disappear automatically
□ VWAP disappears automatically
□ Chart cleans itself - ready for tomorrow
□ Fill out daily journal
```
---
## 🏆 WINNING MINDSET AFFIRMATIONS
Read these BEFORE each trading session:
```
"I trade ORBs, not chaos. Structure gives me edge."
"3 high-quality trades beat 20 mediocre ones."
"The 30min ORB is my anchor. I wait for it. Every. Single. Time."
"When all 3 ORBs align, institutions are unified. I follow."
"VWAP is my institutional compass. I respect its guidance."
"3 strikes and I'm out. Discipline > Ego."
"I am a SNIPER, not a machine gunner. Precision wins."
"My edge is patience. Let the ORBs complete."
"I don't predict. I react to proven structure."
"One perfect setup is worth waiting all morning."
```
---
## 📞 TROUBLESHOOTING
**"ORB lines not showing on chart!"**
→ Check timeframe: Must be 1min-30min (not daily/weekly)
→ Verify session time: Must be during London (3AM-9:30AM) or NY (9:30AM-5PM)
→ Check indicator status: Should say "⏳ Forming" or "✓ Complete" in table
**"Targets not appearing!"**
→ 30min ORB must be complete (10:00 AM NY / 3:30 AM London)
→ Check "Number of Targets" setting (must be ≥1)
→ Verify "Target % of 30min Range" is set (default 50%)
**"VWAP disappeared!"**
→ Normal behavior: VWAP auto-deletes at session end (5PM NY / 9:30AM London)
→ Toggle "Show Anchored VWAP" OFF then ON to reset
→ Check if you're viewing chart outside session hours
**"All 3 ORBs look the same!"**
→ This is actually GOOD - means tight alignment (high-probability setup)
→ If they're diverging wildly (>100pts difference), that's a skip signal
**"Info table blocking my view!"**
→ Info table is in top-right corner by default
→ Drag it to a different position (TradingView allows moving)
→ Or minimize it by clicking the small arrow
**"Colors are hard to see on my chart!"**
→ Go to indicator settings:
• "5min ORB", "15min ORB", "30min ORB" color pickers
• "Upside Targets", "Downside Targets" color pickers
• Recommended: Use contrasting colors vs your chart background
---
## 📚 ADVANCED INTEGRATION TECHNIQUES
### **Combining with Market Profile**
```
• Use Volume Profile to identify Value Area High (VAH) and Low (VAL)
• If 30min ORB aligns with VAH/VAL → extra confluence
• POC (Point of Control) acts similar to VWAP
```
### **Combining with Cumulative Delta**
```
• Check if delta is positive on 30min ORB high break (bullish confirmation)
• Negative delta on low break confirms bearish institutional flow
• Your YM SNIPER already tracks this - use together!
```
### **Combining with Options Flow**
```
• Large call buying near 30min ORB high? Institutions positioning for breakout
• Large put buying near 30min ORB low? Smart money hedging/shorting
• Tools: Unusual Whales, Cheddar Flow, OptionStrat
```
---
## 🎯 FINAL PRE-LIVE CHECKLIST
**DO NOT GO LIVE UNTIL ALL CHECKED:**
```
□ Practiced on TradingView Replay for 2+ weeks
□ Can identify all 5 setups by pattern recognition
□ Understand why targets come from 30min ORB only
□ Know difference between 5min/15min/30min roles
□ Risk management rules memorized (position sizing, 3-strike)
□ YM Ultimate SNIPER v8.1 loaded (optional but recommended)
□ All 5 TradingView alerts configured
□ Broker platform tested with demo account
□ Stop/target orders can be placed in <10 seconds
□ Daily journal template prepared
□ Emotional state: calm, patient, focused
□ Account size: Minimum $10,000 recommended
□ Understand auto-disappear behavior (ORBs delete at session end)
□ Know NOT to trade before 30min ORB complete
□ Comfortable with looking at chart and seeing 6+ lines (3 ORBs + targets)
IF ALL CHECKED → YOU'RE READY TO SNIPE! 🎯
IF ANY UNCHECKED → KEEP PRACTICING, DON'T RUSH
```
---
## 💎 THE CORE PRINCIPLE
```
╔═══════════════════════════════════════════════════════════╗
║ ║
║ "The ORB doesn't predict the market. ║
║ The ORB reveals where institutions are positioned. ║
║ ║
║ When you see all 3 ORBs align and break, ║
║ you're not guessing direction— ║
║ you're following the billion-dollar order flow." ║
║ ║
║ THAT'S YOUR EDGE. ║
║ ║
╚═══════════════════════════════════════════════════════════╝
```
**🎯 Good luck, stay patient, and happy sniping! 🎯**
═══════════════════════════════════════════════════════════════════
END OF SNIPER ORB TRADING CHEAT SHEET v1.0
═══════════════════════════════════════════════════════════════════

UNDETECTED FX - Psychologic LevelsThis indicator automatically plots major 250-pip psychological levels on XAUUSD and highlights the price zones around them. These levels act as strong reaction points where liquidity, reversals, and institutional activity commonly occur.
What the Indicator Does
✔ Plots every 250-pip level starting from a user-defined base (e.g., 4050 → 4075 → 4100 → 4125 → …)
✔ Each level is represented by a thick black horizontal line for maximum visual clarity
✔ Around every 250-pip level, the indicator draws a liquidity zone
Top of zone: +200 pips
Bottom of zone: –200 pips
(configured as ± zoneHalf in settings)
✔ Uses extend: both, so levels stretch across the entire chart and stay fixed, no matter how far you scroll
✔ Zones are filled with a customizable color for clear premium/discount visualization
✔ The indicator never repaints and requires no updates after drawing — all levels are fixed on their price coordinates
Why It’s Useful
🔹 Helps quickly identify institutional levels where gold often reacts
🔹 Acts as a framework for scalping, intraday trading, and swing bias
🔹 Makes it easy to spot liquidity sweeps, rejections, and premium/discount areas
🔹 Clearly shows market structure breaks around key psychological levels
🔹 Forces discipline by creating predefined, fixed levels for trading decisions
Best Use Case
XAUUSD scalpers
Intraday traders who rely on precision entries
Traders who use psychological levels, liquidity grabs, or smart-money concepts
Anyone wanting a clean, non-cluttered chart with high-impact levels only

CRR Bill Williams These are SMMA based on the average price (high+low/2):
Jaw – Blue
Slow line, the base of the trend.
Teeth – Red
Medium speed.
Lips – Green/Lime
The fast one, the one that touches the price first.
Trend reading with the Alligator:
🟢 Uptrend (trendUpAlligator):
Lips (green) > Teeth (red) > Jaw (blue)
The alligator is awake and eating UP.
🔴 Downtrend (trendDownAlligator):
Lips (green) < Teeth (red) < Jaw (blue)
The alligator is eating DOWN.
⚪ Range / sleeping market (trendNeutral):
The lines cross, get tangled, without a clear order → better NOT to trade aggressively there.
In the HUD it shows it as:
UPTREND (green)
DOWNTREND (red)
RANGE (gray)
2️⃣ Fractals (▲ and ▼ arrows)
Fractal High (▲ green): possible local top (resistance).
Fractal Low (▼ red): possible local bottom (support).
They serve as:
Points where the price can break through to continue.
Areas where you can place stop losses or breakouts.
3️⃣ AO and AC (trend strength)
AO (Awesome Oscillator): difference of moving averages (5 and 34 of the average price).
AO > 0 → bullish pressure.
AO < 0 → bearish pressure.
AC (Accelerator): AO – average of AO.
AC > 0 → acceleration in favor of the movement.
AC < 0 → the movement slows down or goes against the trend.
In the HUD you see:
AO > 0 | AC > 0 → good tailwind.
AO < 0 | AC < 0 → strong headwind. 4️⃣ Bill Williams MFI (GREEN, FADE, FAKE, SQUAT)
This MFI is based on the candle range/volume and then compares it to the previous candle:
GREEN (Lime) → mfiUp + volUp
Price and volume rise together → real, strong momentum.
FADE (Gray) → mfiDown + volDown
Everything is dying down, price and volume fall → exhaustion.
FAKE (Orange) → mfiUp + volDown
Price rises but volume falls → deceptive movement.
SQUAT (Fuchsia) → mfiDown + volUp
Strong fight between buyers and sellers → explosive zone.
The color you see in the "MFI" HUD is:
Green → healthy momentum
Gray → fading out
Orange → deception
Fuchsia → strong fight, a big move may be coming
5️⃣ Candle Colors (barcolor)
Your script paints the candles like this:
💚 StrongBull (strong buying)
Bullish Alligator (Lips > Teeth > Jaw)
AO > 0
AC > 0
MFI = "GREEN"
→ Bright LIME candle:
👉 strong upward trend, ideal time to look for buying opportunities.
❤️ StrongBear (strong selling)
Bearish Alligator (Lips < Teeth < Jaw)
AO < 0
AC < 0
MFI = "GREEN"
→ Strong RED candle:
👉 strong downward trend, ideal for looking for selling opportunities.
🩵 Normal bullish trend:
Bullish Alligator but without all the strength conditions → TEAL (bluish-green) candle.
🟥 Normal bearish trend:
Bearish Alligator but without full strength → MAROON candle.
⚪ Sideways market:
Everything mixed → translucent GRAY candle (color.gray 60).
👉 Not the best time to enter aggressively. 6️⃣ BUY / SELL Signals (triangles)
✔️ BUY Condition (longSignalCond)
The code requires:
Bullish Alligator → Lips > Teeth > Jaw
AO > 0
AC > 0
MFI = GREEN or SQUAT
close > Lips (green lips) → the price is already above the fast moving average.
When fulfilled:
A green “BUY” triangle appears below the candle.
In the HUD:
Trend: BULLISH (green)
AO / AC: > 0
MFI: GREEN or SQUAT
BW Setup: “SIGNAL: BUY”
Context: “Buying Pressure”
👉 Idea for making money (buys):
Wait for the Alligator to be in a bullish order.
Check that the HUD says BULLISH and AO/AC > 0.
Check MFI: GREEN or SQUAT.
As soon as the BUY triangle appears and the candle is lime/teal, you can:
Enter a buy position.
Place the stop loss below the last fractal low (▼).
Close partially when:
MFI changes to FADE/FAKE or
The candles change to gray/maroon or
The Alligator becomes entangled (loses its order).
❌ SELL Condition (shortSignalCond)
The code requires:
Bearish Alligator → Lips < Teeth < Jaw
AO < 0
AC < 0
MFI = GREEN or SQUAT (strength but downwards)
close < Lips → price below the lips.
When fulfilled:
A red “SELL” triangle appears above the candle.
In the HUD:
Trend: BEARISH
AO / AC: < 0
MFI: GREEN / SQUAT
BW Setup: “SIGNAL: SELL”
Context: “Selling Pressure”
👉 Idea for making money (sells):
Wait for the Alligator to be in a bearish order.
HUD in BEARISH, AO/AC < 0.
MFI in GREEN or SQUAT.
When the SELL triangle appears with a red/maroon candle:
Enter a sell position. Stop above the last fractal high (▲).
Partial exit when:
MFI changes to FADE/FAKE,
The candles turn gray/teal,
Or the Alligator becomes tangled.
7️⃣ When NOT to trade
Avoid:
HUD → “RANGE”
Mostly gray candles.
AO and AC mixed (one >0 and the other <0).
MFI constantly in FAKE/FADE.
In these situations, the system tells you: slow or deceptive market → not suitable for serious trades.
8️⃣ Ultra-short summary (golden rule)
BUY:
Alligator ordered UP (green > red > blue).
AO > 0 and AC > 0.
MFI = GREEN or SQUAT.
Strong green candle (lime/teal) + BUY triangle.
Even better if it breaks a previous fractal low upwards.
SELL:
Alligator ordered DOWN (green < red < blue).
AO < 0 and AC < 0.
MFI = GREEN or SQUAT.
Red/maroon candle + SELL triangle.
Even better if it breaks a fractal high downwards.

SNIPER ORB v1# 🎯 SNIPER ORB TRADING CHEAT SHEET
## Quick Reference Guide for Live Trading
---
## 📊 VISUAL IDENTIFICATION GUIDE
```
═══════════════════════════════════════════════════════════════════
YOUR CHART AT A GLANCE
═══════════════════════════════════════════════════════════════════
🔵 BRIGHT BLUE LINES (3px) → 5min ORB High/Low
🔷 CYAN LINES (2px) → 15min ORB High/Low
🟣 PURPLE LINES (2px) → 30min ORB High/Low (PRIMARY)
🟢 GREEN DASHED LINES (1px) → Upside targets (1x, 2x, 3x from 30min ORB)
🔴 RED DASHED LINES (1px) → Downside targets (1x, 2x, 3x from 30min ORB)
🟡 GOLD LINE (2px) → Anchored VWAP (9:30 AM anchor for NY, 3:00 AM for London)
📋 INFO TABLE (top-right) → Shows live ORB ranges, VWAP price, status
═══════════════════════════════════════════════════════════════════
```
**KEY DIFFERENCE FROM OTHER ORB INDICATORS:**
- You see **ALL 3 ORB PERIODS SIMULTANEOUSLY** (5min, 15min, 30min)
- Targets calculated from **30min ORB ONLY** (not 5min or 15min)
- **NO BOX FILLS** - clean line-only display for sniper precision
- Auto-disappears at session end (no clutter from old sessions)
---
## ⏰ SESSION TIMING MATRIX
| Session | Start Time | 5min Complete | 15min Complete | 30min Complete | Session End |
|---------|-----------|---------------|----------------|----------------|-------------|
| **London** | 3:00 AM ET | 3:05 AM | 3:15 AM | 3:30 AM | 9:30 AM ET (disappears) |
| **New York** | 9:30 AM ET | 9:35 AM | 9:45 AM | 10:00 AM | 5:00 PM ET (disappears) |
**💡 GOLDEN RULES:**
1. **WAIT FOR 30MIN ORB TO COMPLETE** before trading targets (10:00 AM NY / 3:30 AM London)
2. Use 5min and 15min ORBs as **early warning signals** only
3. All ORB lines + VWAP **auto-delete** at session end (clean chart)
---
## 🎯 THE 3-ORB SYSTEM: HOW IT WORKS
### **Hierarchical ORB Structure**
```
TIME: 9:30 AM ─────────────────────────────────> 10:00 AM ──────> 5:00 PM
↓ ↓
SESSION START 30min ORB COMPLETE
(all 3 ORBs begin forming) (targets appear)
📍 5min ORB (9:30-9:35 AM): ━━━━━━━━━━━━━━━━━━━━━━━━━━━━━━━━━━━━━>
Purpose: EARLY breakout signal, fastest-moving boundary
📍 15min ORB (9:30-9:45 AM): ━━━━━━━━━━━━━━━━━━━━━━━━━━━━━━━━━━━━━>
Purpose: MID-TERM institutional reference level
📍 30min ORB (9:30-10:00 AM): ━━━━━━━━━━━━━━━━━━━━━━━━━━━━━━━━━━━━━>
Purpose: PRIMARY TRADING RANGE - all targets calculated from this
🎯 TARGETS (10:00 AM onward): ▪ ▪ ▪ ▪ ▪ (1x, 2x, 3x from 30min ORB)
Purpose: Profit-taking levels based on 30min range
```
**Why 3 ORBs Instead of 1?**
- **5min ORB**: Captures early institutional positioning (first 5 minutes)
- **15min ORB**: Confirms directional bias (more stable than 5min)
- **30min ORB**: Full market digestion of overnight news + opening orders
- **Confluence = Higher Win Rate**: When all 3 align, breakouts are extremely reliable
---
## 🎯 THE 5 HIGH-PROBABILITY SETUPS
### **SETUP #1: TRIPLE ORB BREAKOUT CONFLUENCE** ⭐⭐⭐⭐⭐
```
CONDITIONS:
✅ 30min ORB complete (10:00 AM NY / 3:30 AM London)
✅ Price breaks ALL 3 ORBs simultaneously:
• 5min high/low (blue line)
• 15min high/low (cyan line)
• 30min high/low (purple line)
✅ VWAP confirms direction (below price = bullish, above = bearish)
✅ Volume spike on breakout candle
ENTRY: Close of breakout candle (must close beyond ALL 3 ORBs)
STOP: Inside 30min ORB at 30m low (long) or 30m high (short)
TARGET 1: First green/red dashed line (0.5x 30m range)
TARGET 2: Second target (1x 30m range)
TARGET 3: Third target (1.5x 30m range)
WIN RATE: 75-85% | R:R = 1:2.5 minimum
NOTES: When all 3 ORBs align, institutional order flow is unanimous
```
---
### **SETUP #2: 5MIN EARLY BREAKOUT → 30MIN CONFIRMATION** ⭐⭐⭐⭐
```
CONDITIONS:
✅ Price breaks 5min ORB first (blue line crossed)
✅ 15min ORB holds initially (cyan line not crossed yet)
✅ After 30min ORB completes, price breaks 30min boundary (purple)
✅ VWAP alignment confirms direction
✅ All 3 ORBs now broken in same direction
ENTRY: When 30min ORB breaks (purple line) + 5min/15min already broken
STOP: 30min ORB opposite boundary
TARGET 1-3: Standard targets from 30min ORB
WIN RATE: 70-80% | R:R = 1:2+
NOTES: 5min gave early warning, 30min confirms institutional commitment
```
---
### **SETUP #3: FALSE 5MIN BREAKOUT → 30MIN REVERSAL** ⭐⭐⭐⭐⭐
```
CONDITIONS:
✅ Price breaks 5min ORB (blue line)
✅ Fails to break 15min or 30min ORBs (cyan/purple lines hold)
✅ Price reverses back inside 5min ORB
✅ Then breaks OPPOSITE side of 30min ORB (purple line)
✅ VWAP flips to confirm new direction
ENTRY: When 30min ORB breaks in OPPOSITE direction of failed 5min break
STOP: Failed 5min breakout high/low (now a liquidity grab zone)
TARGET 1-3: Standard targets
WIN RATE: 80-90% | R:R = 1:3+ (trapped traders forced to exit)
NOTES: Most profitable setup - 5min breakout was liquidity hunt
```
---
### **SETUP #4: TIGHT COMPRESSION → EXPLOSION** ⭐⭐⭐⭐
```
CONDITIONS:
✅ All 3 ORBs tightly overlapping (5m, 15m, 30m within 50 points on YM)
✅ Range < 0.3% of price (very tight consolidation)
✅ VWAP sitting in middle of compression
✅ 30min ORB complete, price still inside all 3
ENTRY: Simultaneous break of ALL 3 ORBs + VWAP cross
STOP: Middle of compression zone
TARGET: 2x-4x normal targets (volatility expansion)
WIN RATE: 65-75% | R:R = 1:5+ (explosive breakout)
NOTES: Low volatility → high volatility shift, institutions coiling spring
```
---
### **SETUP #5: VWAP BOUNCE WITHIN 30MIN ORB** ⭐⭐⭐⭐
```
CONDITIONS:
✅ Price stayed inside 30min ORB for 1+ hours post-formation
✅ VWAP acting as dynamic support (long) or resistance (short)
✅ Price bouncing between VWAP and 30min ORB boundaries
✅ Clear rejection candles at VWAP
ENTRY: When price bounces off VWAP toward 30min ORB boundary
• Long: VWAP bounce up toward 30m high (purple)
• Short: VWAP rejection down toward 30m low (purple)
STOP: Beyond VWAP by 20 points
TARGET: 30min ORB opposite boundary
WIN RATE: 70-80% | R:R = 1:1.5-2
NOTES: Range-bound play, NOT for breakout traders
```
---
## 🛡️ RISK MANAGEMENT RULES
### **Position Sizing by ORB Range**
```
30min ORB Range | Stop Distance | Risk $500 (1%) | YM Contracts
-----------------|------------------|-----------------|-------------
< 50 points | 50 pts | $500 ÷ $250 = | 2 contracts
50-100 points | 100 pts | $500 ÷ $500 = | 1 contract
100-150 points | 150 pts | $500 ÷ $750 = | 0.66 (use 1)
150-200 points | 200 pts | $500 ÷ $1000 = | 0.5 (use 1)
> 200 points | Don't trade | Too wide | Skip setup
Formula: Risk $ ÷ (Stop Distance × $5 per YM point) = Max Contracts
```
### **The 3-Strike Rule (MANDATORY)**
```
✅ Trade 1: Full position size (based on 30m ORB range)
❌ Stop hit → Trade 2: HALF position size
❌ Stop hit → Trade 3: QUARTER position size
❌ Stop hit → DONE FOR THE DAY (no exceptions)
```
### **Profit Taking Ladder**
```
TARGET 1 (0.5x 30m range): Take 50% off, move stop to breakeven
TARGET 2 (1.0x 30m range): Take 30% off, trail stop by 25 points
TARGET 3 (1.5x 30m range): Take 15% off, let 5% run with 50pt trail
```
---
## ⚠️ DO NOT TRADE IF...
```
🚫 30min ORB incomplete (< 10:00 AM NY / < 3:30 AM London)
🚫 30min ORB range < 40 points YM (too tight, likely chop)
🚫 30min ORB range > 250 points YM (too wide, unpredictable)
🚫 All 3 ORBs wildly divergent (5m=100pts, 15m=180pts, 30m=240pts)
🚫 Major news release within 30 minutes (wait for ORB to reform)
🚫 You've hit 3 losses in the session (3-strike rule)
🚫 You're tired, emotional, revenge trading, or distracted
🚫 Time > 12:00 PM ET (lunch, avoid until 1:00 PM)
🚫 Time > 3:00 PM ET unless Power Hour (3:00-4:00 PM) momentum
```
---
## 🔍 PRE-SESSION CHECKLIST
**15 Minutes Before London (2:45 AM ET) or NY (9:15 AM ET):**
```
□ Check economic calendar (FOMC? NFP? CPI? → extra caution)
□ Review previous session's ORB ranges (context for today's volatility)
□ Load SNIPER ORB on 1min or 5min chart
□ Select correct session: "London" or "New York"
□ Verify indicator settings:
• Number of Targets: 3
• Target % of 30min Range: 50%
• Show Anchored VWAP: ON
□ Set TradingView alerts:
• 30min ORB complete (10:00 AM or 3:30 AM)
• Price crossing 30min high/low
• VWAP crosses
□ Prepare bracket orders mentally (entry, stop, 3 targets)
□ Review yesterday's P&L and lessons learned
□ Set phone to "Do Not Disturb" mode
```
---
## 🎨 INDICATOR SETTINGS GUIDE
### **Color Customization (Optimized for Dark Charts)**
```
DEFAULT COLORS:
━━━━━━━━━━━━━━━━━━━━━━━━━━━━━━━━━━━━━━━━
5min ORB: Bright Blue (#2196F3) - 3px wide
15min ORB: Cyan (#00BCD4) - 2px wide
30min ORB: Purple (#9C27B0) - 2px wide
Upside Targets: Green (#4CAF50) - 1px dashed
Downside Targets: Red (#F44336) - 1px dashed
VWAP: Gold (#FFC107) - 2px solid
━━━━━━━━━━━━━━━━━━━━━━━━━━━━━━━━━━━━━━━━
WHY THESE COLORS?
• Blue family (5m/15m) = short-term, high-frequency
• Purple (30m) = primary, institutional level
• Green/Red = universal up/down
• Gold VWAP = fair value anchor (stands out)
```
### **Settings by Trading Style**
**SCALPER (5-15 min holds):**
```
Number of Targets: 5
Target % of 30min Range: 30-40%
Label Size: Tiny
Chart Timeframe: 1-minute
```
**DAY TRADER (30-90 min holds):**
```
Number of Targets: 3
Target % of 30min Range: 50%
Label Size: Small
Chart Timeframe: 5-minute
```
**SWING TRADER (2-4 hour holds):**
```
Number of Targets: 2-3
Target % of 30min Range: 75-100%
Label Size: Normal
Chart Timeframe: 15-minute
```
---
## 📈 TIMEFRAME SELECTION GUIDE
| Your Timeframe | What You See | Best For |
|---------------|--------------|----------|
| **1-minute** | Every tick, high noise | Scalping, precision entries |
| **5-minute** | Balanced clarity | Day trading (RECOMMENDED) |
| **15-minute** | Clean structure | Swing positions |
| **30-minute** | Too compressed | Not recommended (can't see ORB form) |
**💡 PRO TIP:**
- **Primary chart: 5-minute** (for entries and monitoring)
- **Secondary chart: 1-minute** (for precise timing)
- **Never go above 15-minute** (ORBs won't form properly)
---
## 🧠 READING THE 3-ORB STRUCTURE
### **Bullish Alignment Patterns**
```
PATTERN 1: "Staircase Expansion"
5min: ━━━━ (tight, 60 pts)
15min: ━━━━━━ (wider, 90 pts)
30min: ━━━━━━━━ (widest, 120 pts)
→ Bullish expansion, expect upside breakout
PATTERN 2: "Nested Compression"
5min: ━━ (30 pts)
15min: ━━━ (35 pts)
30min: ━━━━ (40 pts)
→ All tight, explosive breakout likely
PATTERN 3: "Early Commitment"
5min: ━━━━━━ (100 pts, already broken up)
15min: ━━━━━ (80 pts, holding)
30min: ━━━━━ (110 pts, about to break)
→ 5min led the way, 30min confirmation coming
```
### **Bearish Alignment Patterns**
```
PATTERN 1: "Waterfall Setup"
5min: ━━━━ (50 pts, broke down)
15min: ━━━━━ (70 pts, broke down)
30min: ━━━━━━ (90 pts, about to break)
→ Sequential breakdown, strong bearish momentum
PATTERN 2: "Failed Highs"
5min: ━━━━━━ (upper wick rejections)
15min: ━━━━━━ (couldn't break)
30min: ━━━━━━━ (topped out)
→ All 3 rejecting highs, bearish reversal likely
```
### **Neutral/Chop Patterns (AVOID TRADING)**
```
PATTERN 1: "Wide Divergence"
5min: ━━ (30 pts)
15min: ━━━━━━━ (120 pts)
30min: ━━━━━━━━━━━ (200 pts)
→ No consensus, unpredictable, skip
PATTERN 2: "Whipsaw City"
• Price breaking 5min up, then down, then up again
• 15min and 30min not aligned
• VWAP getting crossed every 5 minutes
→ Chop day, step aside, wait for clarity
```
---
## 📊 INTEGRATION WITH YM ULTIMATE SNIPER v8.1
**The 2-System Confluence Method:**
```
┌─────────────────────────────────────────────────────────────┐
│ STEP 1: SNIPER ORB → Defines "Zones That Matter" │
│ • 30min ORB = primary institutional range │
│ • VWAP = fair value anchor │
│ • Targets = profit zones │
│ • 5min/15min = early warning signals │
└─────────────────────────────────────────────────────────────┘
↓
┌─────────────────────────────────────────────────────────────┐
│ STEP 2: YM ULTIMATE SNIPER → Triggers precise entry │
│ • Wait for GOD MODE signal AT 30min ORB boundary │
│ • 6-gate filter: Score ≥9, fat body ≥70%, delta ≥70% │
│ • Candle Dominance Index (CDI) ≥7 │
│ • Intrabar pressure consistent throughout formation │
└─────────────────────────────────────────────────────────────┘
↓
┌─────────────────────────────────────────────────────────────┐
│ STEP 3: EXECUTE TRADE │
│ • ORB breakout + GOD MODE = MAXIMUM PROBABILITY │
│ • Enter ONLY when BOTH systems align │
│ • This is TRUE "sniper" trading (2-5 trades/day max) │
└─────────────────────────────────────────────────────────────┘
```
**Confluence Scoring for Combined System:**
```
SNIPER ORB Criteria:
□ 30min ORB complete (10:00 AM+) +2 points
□ All 3 ORBs broken in same direction +2 points
□ VWAP alignment (below=bull, above=bear) +1 point
□ Volume spike on breakout candle +1 point
□ Tight 3-ORB compression (<100pt divergence) +1 point
YM ULTIMATE SNIPER Criteria:
□ GOD MODE signal at ORB boundary +3 points
□ Score ≥9.0 (tier classification) +1 point
□ Candle Dominance Index (CDI) ≥8 +1 point
TOTAL POSSIBLE: 12 points
TRADE EXECUTION RULES:
• 10-12 points = MAX SIZE (this is the holy grail setup)
• 8-9 points = FULL SIZE (high probability)
• 6-7 points = HALF SIZE (moderate probability)
• <6 points = NO TRADE (wait for better alignment)
```
---
## 💡 COMMON MISTAKES & FIXES
```
❌ MISTAKE: Trading before 30min ORB completes
✅ FIX: Wait until 10:00 AM (NY) or 3:30 AM (London), NO EXCEPTIONS
❌ MISTAKE: Ignoring 5min and 15min ORBs (only watching 30min)
✅ FIX: Use all 3 for confluence - they're your early warning system
❌ MISTAKE: Chasing breakouts 100+ points beyond 30min ORB
✅ FIX: Wait for pullback to VWAP or 30min boundary for re-entry
❌ MISTAKE: Not adjusting target % for market conditions
✅ FIX: Volatile day (ORB >200pts)? Use 75-100% targets
Calm day (ORB <80pts)? Use 30-40% targets
❌ MISTAKE: Trading when all 3 ORBs are wildly different sizes
✅ FIX: Skip the day if 5m/15m/30m diverge by >100pts - no consensus
❌ MISTAKE: Forgetting VWAP position
✅ FIX: VWAP MUST confirm bias:
• Long: price > VWAP
• Short: price < VWAP
• If VWAP contradicts, skip the trade
❌ MISTAKE: Not respecting the 3-strike rule
✅ FIX: 3 losses = DONE for the session, no rationalization
❌ MISTAKE: Trading during lunch (12:00-1:00 PM ET)
✅ FIX: Volume dies, ORBs lose relevance, false signals increase
```
---
## 🔔 ALERT SETUP (ESSENTIAL)
**TradingView Alerts You MUST Set:**
```
ALERT 1: "30min ORB Complete"
• Type: Time-based
• Trigger: 10:00 AM ET (NY) or 3:30 AM ET (London)
• Message: "🎯 30min ORB complete - targets now active"
ALERT 2: "30min ORB High Breakout"
• Type: Crossing Up
• Value 1: Close
• Value 2: 30min ORB High (purple line)
• Message: "🚀 30m ORB HIGH broken - check for long setup"
ALERT 3: "30min ORB Low Breakdown"
• Type: Crossing Down
• Value 1: Close
• Value 2: 30min ORB Low (purple line)
• Message: "📉 30m ORB LOW broken - check for short setup"
ALERT 4: "VWAP Cross"
• Type: Crossing
• Value 1: Close
• Value 2: VWAP
• Message: "⚡ VWAP crossed - check institutional bias shift"
ALERT 5: "Target 1 Hit"
• Type: Crossing
• Value 1: High (for longs) or Low (for shorts)
• Value 2: First target line
• Message: "🎯 Target 1 hit - take 50% off, move stop to BE"
```
---
## 📱 MOBILE TRADING WORKFLOW
**TradingView Mobile App Setup:**
```
1. SAVE LAYOUT
• Chart: 5-minute timeframe
• SNIPER ORB indicator loaded
• YM Ultimate SNIPER v8.1 loaded (if using)
• Save as "SNIPER ORB - YM"
2. ENABLE NOTIFICATIONS
• Settings → Notifications → Push Alerts: ON
• All 5 alerts above configured
3. QUICK ACCESS
• Add YM futures to Watchlist: "MYM" or "YM1!"
• Pin SNIPER ORB layout to favorites
4. EXECUTION READY
• Broker app (TastyTrade, NinjaTrader, etc.) logged in
• Preset bracket orders:
- Entry: market order
- Stop: 30m ORB opposite boundary
- Targets: 3 levels (50%, 30%, 20% of position)
5. BATTERY & CONNECTIVITY
• Phone charged 100% before session
• Stable WiFi or LTE connection
• Backup power bank available
```
---
## 🎓 DAILY PERFORMANCE JOURNAL
**After Each Trading Session (MANDATORY):**
```
═══════════════════════════════════════════════════════════════
DATE: __________ SESSION: □ London □ New York
═══════════════════════════════════════════════════════════════
ORB DATA:
• 5min ORB Range: ______ points
• 15min ORB Range: ______ points
• 30min ORB Range: ______ points
• Alignment: □ Tight □ Moderate □ Wide (skip if wide)
VWAP BEHAVIOR:
• Opening position: □ Above price □ Below price □ Mixed
• Did VWAP act as support/resistance? □ Yes □ No
TRADES TAKEN:
Total Setups Identified: _____
Trades Executed: _____
Win/Loss Record: _____ W / _____ L
Win Rate: _____%
Gross P&L: $_______
Net P&L (after commissions): $_______
BEST TRADE:
• Setup: ____________________ (which of the 5 setups?)
• Entry Price: ______ Exit Price: ______
• Profit: $_______
• What went RIGHT: _________________________________
_________________________________________________
WORST TRADE:
• Setup: ____________________
• Entry Price: ______ Exit Price: ______
• Loss: $_______
• What went WRONG: _________________________________
_________________________________________________
• Lesson Learned: ___________________________________
3-STRIKE RULE STATUS:
□ No losses (great day)
□ 1 loss (still in game)
□ 2 losses (caution, half size)
□ 3 losses (stopped for day, as required)
TOMORROW'S ADJUSTMENTS:
□ _________________________________________________
□ _________________________________________________
□ _________________________________________________
EMOTIONAL STATE TODAY:
□ Calm & focused (optimal)
□ Anxious/rushed (need to work on patience)
□ Overconfident (dial back position size)
□ Fearful (review winning trades to build confidence)
═══════════════════════════════════════════════════════════════
```
---
## 🚀 YOUR FIRST LIVE TRADE WALKTHROUGH
**Step-by-Step for New York Session (Most Common):**
```
⏰ 9:15 AM ET - PREPARATION
□ Load SNIPER ORB on YM 5-minute chart
□ Select "New York" session in indicator settings
□ Verify VWAP is showing (gold line)
□ Check economic calendar (any big news at 9:30?)
□ Prepare mentally: "I will wait for 30min ORB to complete"
⏰ 9:30 AM ET - SESSION OPENS
□ Watch 3 ORBs begin forming:
• Blue lines (5min) will lock in at 9:35 AM
• Cyan lines (15min) will lock in at 9:45 AM
• Purple lines (30min) will lock in at 10:00 AM
□ Observe VWAP anchoring at 9:30 AM candle
□ DO NOT TRADE YET - just observe
⏰ 9:35 AM - 5MIN ORB COMPLETE
□ Note 5min high/low (blue lines locked)
□ Check info table: "5m Range = XX points"
□ If 5min ORB breaks early, note direction but DON'T ENTER
⏰ 9:45 AM - 15MIN ORB COMPLETE
□ Note 15min high/low (cyan lines locked)
□ Compare to 5min ORB: Aligned? Expanding?
□ Still waiting... patience pays
⏰ 10:00 AM - 30MIN ORB COMPLETE (TARGETS APPEAR!)
□ Purple lines locked (30m high/low)
□ Green/red dashed target lines appear automatically
□ Info table shows "Status: ✓ Complete"
□ NOW you can trade breakouts
⏰ 10:00 AM - 11:30 AM - TRADING WINDOW
□ Wait for price to break purple line (30m ORB high or low)
□ Confirm:
1. All 3 ORBs broken in same direction?
2. VWAP confirming (below=bullish, above=bearish)?
3. Volume spike visible?
4. YM SNIPER GOD MODE signal? (if using)
□ If all YES → ENTER TRADE:
• Market order at breakout close
• Stop at 30m ORB opposite boundary
• Targets at green/red dashed lines
⏰ TARGET MANAGEMENT
□ Price hits first target (1x) → Take 50% off, move stop to BE
□ Price hits second target (2x) → Take 30% off, trail stop
□ Price hits third target (3x) → Take 15% off, let 5% run
⏰ 12:00 PM - LUNCH (AVOID TRADING)
□ Volume dies down
□ ORBs become less relevant
□ Take a break, review morning trades
⏰ 1:00 PM - 3:00 PM - AFTERNOON SESSION
□ ORBs still valid but less reliable
□ Consider waiting for Power Hour (3:00-4:00 PM)
⏰ 5:00 PM - SESSION END
□ All ORB lines disappear automatically
□ VWAP disappears automatically
□ Chart cleans itself - ready for tomorrow
□ Fill out daily journal
```
---
## 🏆 WINNING MINDSET AFFIRMATIONS
Read these BEFORE each trading session:
```
"I trade ORBs, not chaos. Structure gives me edge."
"3 high-quality trades beat 20 mediocre ones."
"The 30min ORB is my anchor. I wait for it. Every. Single. Time."
"When all 3 ORBs align, institutions are unified. I follow."
"VWAP is my institutional compass. I respect its guidance."
"3 strikes and I'm out. Discipline > Ego."
"I am a SNIPER, not a machine gunner. Precision wins."
"My edge is patience. Let the ORBs complete."
"I don't predict. I react to proven structure."
"One perfect setup is worth waiting all morning."
```
---
## 📞 TROUBLESHOOTING
**"ORB lines not showing on chart!"**
→ Check timeframe: Must be 1min-30min (not daily/weekly)
→ Verify session time: Must be during London (3AM-9:30AM) or NY (9:30AM-5PM)
→ Check indicator status: Should say "⏳ Forming" or "✓ Complete" in table
**"Targets not appearing!"**
→ 30min ORB must be complete (10:00 AM NY / 3:30 AM London)
→ Check "Number of Targets" setting (must be ≥1)
→ Verify "Target % of 30min Range" is set (default 50%)
**"VWAP disappeared!"**
→ Normal behavior: VWAP auto-deletes at session end (5PM NY / 9:30AM London)
→ Toggle "Show Anchored VWAP" OFF then ON to reset
→ Check if you're viewing chart outside session hours
**"All 3 ORBs look the same!"**
→ This is actually GOOD - means tight alignment (high-probability setup)
→ If they're diverging wildly (>100pts difference), that's a skip signal
**"Info table blocking my view!"**
→ Info table is in top-right corner by default
→ Drag it to a different position (TradingView allows moving)
→ Or minimize it by clicking the small arrow
**"Colors are hard to see on my chart!"**
→ Go to indicator settings:
• "5min ORB", "15min ORB", "30min ORB" color pickers
• "Upside Targets", "Downside Targets" color pickers
• Recommended: Use contrasting colors vs your chart background
---
## 📚 ADVANCED INTEGRATION TECHNIQUES
### **Combining with Market Profile**
```
• Use Volume Profile to identify Value Area High (VAH) and Low (VAL)
• If 30min ORB aligns with VAH/VAL → extra confluence
• POC (Point of Control) acts similar to VWAP
```
### **Combining with Cumulative Delta**
```
• Check if delta is positive on 30min ORB high break (bullish confirmation)
• Negative delta on low break confirms bearish institutional flow
• Your YM SNIPER already tracks this - use together!
```
### **Combining with Options Flow**
```
• Large call buying near 30min ORB high? Institutions positioning for breakout
• Large put buying near 30min ORB low? Smart money hedging/shorting
• Tools: Unusual Whales, Cheddar Flow, OptionStrat
```
---
## 🎯 FINAL PRE-LIVE CHECKLIST
**DO NOT GO LIVE UNTIL ALL CHECKED:**
```
□ Practiced on TradingView Replay for 2+ weeks
□ Can identify all 5 setups by pattern recognition
□ Understand why targets come from 30min ORB only
□ Know difference between 5min/15min/30min roles
□ Risk management rules memorized (position sizing, 3-strike)
□ YM Ultimate SNIPER v8.1 loaded (optional but recommended)
□ All 5 TradingView alerts configured
□ Broker platform tested with demo account
□ Stop/target orders can be placed in <10 seconds
□ Daily journal template prepared
□ Emotional state: calm, patient, focused
□ Account size: Minimum $10,000 recommended
□ Understand auto-disappear behavior (ORBs delete at session end)
□ Know NOT to trade before 30min ORB complete
□ Comfortable with looking at chart and seeing 6+ lines (3 ORBs + targets)
IF ALL CHECKED → YOU'RE READY TO SNIPE! 🎯
IF ANY UNCHECKED → KEEP PRACTICING, DON'T RUSH
```
---
## 💎 THE CORE PRINCIPLE
```
╔═══════════════════════════════════════════════════════════╗
║ ║
║ "The ORB doesn't predict the market. ║
║ The ORB reveals where institutions are positioned. ║
║ ║
║ When you see all 3 ORBs align and break, ║
║ you're not guessing direction— ║
║ you're following the billion-dollar order flow." ║
║ ║
║ THAT'S YOUR EDGE. ║
║ ║
╚═══════════════════════════════════════════════════════════╝
```
**🎯 Good luck, stay patient, and happy sniping! 🎯**
═══════════════════════════════════════════════════════════════════
END OF SNIPER ORB TRADING CHEAT SHEET v1.0
═══════════════════════════════════════════════════════════════════

SNIPER ORB# 🎯 SNIPER ORB TRADING CHEAT SHEET
## Quick Reference Guide for Live Trading
---
## 📊 VISUAL IDENTIFICATION GUIDE
```
═══════════════════════════════════════════════════════════════════
YOUR CHART AT A GLANCE
═══════════════════════════════════════════════════════════════════
🔵 BRIGHT BLUE BOX (5min) → Fastest ORB, early warning signals
🔷 CYAN BOX (15min) → Mid-term institutional reference
🟣 PURPLE BOX (30min) → PRIMARY TRADING RANGE (your base)
🟢 GREEN DASHED LINES → Upside profit targets (long)
🔴 RED DASHED LINES → Downside profit targets (short)
🟡 GOLD LINE (VWAP) → Institutional fair value anchor
═══════════════════════════════════════════════════════════════════
```
---
## ⏰ SESSION TIMING MATRIX
| Session | Start Time | ORB Complete | Breakout Window | End Time |
|---------|-----------|--------------|-----------------|----------|
| **London Open** | 3:00 AM ET | 3:30 AM ET | 3:30-5:00 AM | 9:30 AM ET |
| **New York Open** | 9:30 AM ET | 10:00 AM ET | 10:00-11:30 AM | 5:00 PM ET |
**💡 GOLDEN RULE**: Wait for 30min ORB to **complete** before taking breakout trades!
---
## 🎯 THE 5 HIGH-PROBABILITY SETUPS
### **SETUP #1: CLEAN BREAKOUT** ⭐⭐⭐⭐⭐
```
CONDITIONS:
✅ 30min ORB complete (10:00 AM for NY / 3:30 AM for London)
✅ Price breaks ABOVE purple high (bullish) or BELOW purple low (bearish)
✅ VWAP confirms direction:
• Long: VWAP below price
• Short: VWAP above price
✅ Volume spike on breakout candle
ENTRY: Breakout candle close
STOP: Inside 30min ORB (opposite side)
TARGET 1: First green/red target (0.5x range)
TARGET 2: Second target (1x range)
TARGET 3: Third target (1.5x range)
WIN RATE: 65-75% | R:R = 1:2 minimum
```
---
### **SETUP #2: FALSE BREAKOUT REVERSAL** ⭐⭐⭐⭐⭐
```
CONDITIONS:
✅ Price breaks purple high/low initially
✅ Fails to hold (wick reversal or immediate rejection)
✅ Re-enters 30min ORB zone
✅ VWAP acts as rejection point
✅ Breaks opposite side of 30min ORB
ENTRY: When price breaks opposite ORB boundary
STOP: Original false breakout high/low
TARGET 1: VWAP (quick scalp)
TARGET 2: First opposite target line
WIN RATE: 70-80% | R:R = 1:3+ (trapped traders exit)
NOTES: Most profitable setup - institutions hunting stops
```
---
### **SETUP #3: TRIPLE ORB COMPRESSION** ⭐⭐⭐⭐
```
CONDITIONS:
✅ All 3 ORBs tightly aligned (5min, 15min, 30min overlap)
✅ Range < 0.5% of price (very tight)
✅ VWAP sitting in middle of compression
✅ Multiple candles consolidating inside
ENTRY: Simultaneous break of ALL 3 ORBs
STOP: Middle of compression zone
TARGET: 2x-3x normal targets (explosive move)
WIN RATE: 60-70% | R:R = 1:4+ (volatility expansion)
NOTES: Low volume → high volume shift = institutional play
```
---
### **SETUP #4: VWAP RETEST CONTINUATION** ⭐⭐⭐⭐
```
CONDITIONS:
✅ 30min ORB already broken (trend established)
✅ Price pulls back to VWAP
✅ VWAP acts as dynamic support/resistance
✅ Rejection candle forms at VWAP
ENTRY: Candle closes back in trend direction from VWAP
STOP: 10-15 points beyond VWAP
TARGET: Next target line (1x, 1.5x, 2x)
WIN RATE: 70-75% | R:R = 1:2
NOTES: Safest continuation entry, institutions defending VWAP
```
---
### **SETUP #5: OPENING RANGE FADE** ⭐⭐⭐
```
CONDITIONS:
✅ Price stuck inside 30min ORB for 1+ hours post-formation
✅ Multiple failed attempts to break high or low
✅ VWAP in dead center (neutral)
✅ Decreasing volume
ENTRY: Sell at purple high, buy at purple low (range bound)
STOP: Outside ORB by 20 points
TARGET: Opposite ORB boundary + VWAP
WIN RATE: 55-65% | R:R = 1:1.5
NOTES: Use on slow/choppy days only, exit if breakout starts
```
---
## 🛡️ RISK MANAGEMENT RULES
### **Position Sizing Matrix**
```
Account Size: $50,000 example
Risk Per Trade: 1-2% max
ORB Range | Stop Distance | Position Size (1% risk) | YM Contracts
-------------|---------------|-------------------------|-------------
50 points | 50 points | $500 risk | 1 contract
100 points | 100 points | $500 risk | 1 contract
150 points | 150 points | $500 risk | 1 contract
200 points | 200 points | $500 risk | 1 contract
Formula: Risk $ ÷ (Stop Distance × $5 per point) = Contracts
```
### **The 3-Strike Rule**
```
✅ Strike 1: Full position size
❌ Stop hit → Strike 2: Half position size
❌ Stop hit → Strike 3: 1/4 position size
❌ Stop hit → DONE for the session
```
### **Profit Taking Strategy**
```
TARGET 1 (0.5x): Take 50% off, move stop to breakeven
TARGET 2 (1x): Take 30% off, trail stop 20 points
TARGET 3 (1.5x): Take 15% off, let 5% run to 2x-3x
```
---
## ⚠️ DO NOT TRADE IF...
```
🚫 30min ORB incomplete (wait until 10:00 AM NY / 3:30 AM London)
🚫 ORB range < 30 points YM (too tight, likely fake breakout)
🚫 ORB range > 300 points YM (too wide, unpredictable)
🚫 Major news release within 30 minutes
🚫 You've hit 3 losses in the session (walk away)
🚫 Price whipsawing violently (wait for structure)
🚫 You're tired, emotional, or distracted
```
---
## 🔍 PRE-MARKET CHECKLIST
**Every Morning Before Trading:**
```
□ Check economic calendar (avoid high-impact news)
□ Identify previous day's high/low (macro context)
□ Note overnight price action (gap up/down?)
□ Load SNIPER ORB on 1min or 5min chart
□ Select active session (London or New York)
□ Set TradingView alerts for ORB breakouts
□ Prepare stop/target orders in advance
□ Review yesterday's ORB ranges (context)
```
---
## 🎨 INDICATOR SETTINGS QUICK REFERENCE
### **Default Configuration (Recommended)**
```
Session: New York
Number of Targets: 3
Target % Increment: 50% (gives 0.5x, 1x, 1.5x)
Show VWAP: ON
VWAP Line Width: 2
ORB Line Width: 2
Target Line Width: 1
```
### **Aggressive Day Trading Setup**
```
Session: New York
Number of Targets: 5
Target % Increment: 30% (tighter targets)
Show VWAP: ON
```
### **Conservative Swing Setup**
```
Session: New York
Number of Targets: 2
Target % Increment: 75% (wider targets)
Show VWAP: ON
```
---
## 📈 OPTIMAL TIMEFRAME BY STYLE
| Trading Style | Recommended TF | Why? |
|--------------|----------------|------|
| **Scalper** | 1-minute | See every tick, 5-15 min holds |
| **Day Trader** | 5-minute | Balanced view, 30-90 min holds |
| **Swing Trader** | 15-minute | Less noise, 2-4 hour holds |
**💡 PRO TIP**: Use 5min chart for entries, but watch 1min for precise timing!
---
## 🧠 PATTERN RECOGNITION QUICK GUIDE
### **Bullish ORB Patterns**
```
1. "Staircase" → Price respects each target as new support
2. "Rocket Launch" → Clean break through all targets no pullback
3. "VWAP Bounce" → Pullback to VWAP, then continuation higher
4. "Triple Compression" → All ORBs converge then explosive breakout
```
### **Bearish ORB Patterns**
```
1. "Waterfall" → Price cascades through all downside targets
2. "Failed High" → Breaks top, immediately reverses to bottom
3. "VWAP Rejection" → Hits VWAP from above, hard rejection down
4. "Slow Bleed" → Gradual drift lower, respecting each target
```
### **Neutral/Chop Patterns**
```
1. "Ping Pong" → Price bouncing between ORB high/low repeatedly
2. "Flat VWAP" → VWAP horizontal, price hugging it (no trade)
3. "Wide Range" → ORB > 300 points, too much uncertainty
4. "Gap Confusion" → Opens far outside all ORBs, wait for reset
```
---
## 📊 CONFLUENCE SCORING SYSTEM
**Rate Each Trade 1-10 Before Entry:**
```
Breakout confirmed (30min ORB): +2 points
VWAP alignment: +2 points
Volume spike on breakout: +1 point
All 3 ORBs align: +1 point
Clean candle close beyond ORB: +1 point
Your YM SNIPER GOD MODE signal: +2 points
Time: 10:00-11:30 AM ET window: +1 point
SCORING:
9-10 points = SNIPER SETUP (maximum size)
7-8 points = GOOD TRADE (standard size)
5-6 points = MARGINAL (half size or skip)
< 5 points = NO TRADE (wait for better)
```
---
## 🎯 INTEGRATION WITH YM ULTIMATE SNIPER v8.1
**The Perfect Confluence:**
```
STEP 1: SNIPER ORB identifies the STRUCTURE
→ 30min ORB defines "Zones That Matter"
→ VWAP shows institutional bias
→ Targets define profit zones
STEP 2: YM ULTIMATE SNIPER triggers the ENTRY
→ Wait for GOD MODE signal at ORB boundary
→ 6-gate system confirms institutional pressure
→ Score ≥9.0, fat body ≥70%, delta dominance ≥70%
STEP 3: Execute with PRECISION
→ ORB break + GOD MODE = highest probability
→ Enter only when BOTH systems align
→ This is TRUE "sniper" trading
```
---
## 💡 COMMON MISTAKES TO AVOID
```
❌ Entering BEFORE 30min ORB completes
✅ Wait until 10:00 AM (NY) or 3:30 AM (London)
❌ Ignoring VWAP position
✅ Always check: is VWAP confirming your directional bias?
❌ Chasing breakouts after 50+ point move
✅ Wait for pullback to VWAP or first target
❌ Trading during lunch (12-1 PM ET)
✅ Volume dies, false signals increase
❌ Using same target % in all conditions
✅ Adjust: 30-40% in chop, 50-75% in trends
❌ Forgetting to move stop to breakeven at Target 1
✅ NEVER give back a winning trade
❌ Overtrading on slow days
✅ Some days only have 1-2 clean setups, that's okay!
❌ Not respecting the 3-strike rule
✅ 3 losses = done, come back tomorrow
```
---
## 📱 MOBILE TRADING SETUP
**TradingView Mobile App:**
```
1. Save SNIPER ORB as "Default Layout"
2. Enable push notifications for alerts
3. Set bracket orders (stop + targets) in advance
4. Keep phone charged during trading hours
5. Have broker app ready for quick execution
```
---
## 🔔 ALERT CONFIGURATION
**Essential Alerts to Set:**
```
1. "30min ORB Complete"
→ Time-based: 10:00 AM ET (NY) / 3:30 AM ET (London)
2. "ORB Breakout Up"
→ Built-in: Price > 30min ORB high
3. "ORB Breakout Down"
→ Built-in: Price < 30min ORB low
4. "VWAP Touch"
→ Custom: Price crosses VWAP line
5. "Target 1 Hit"
→ Price level: First green/red target line
```
---
## 🎓 DAILY REVIEW TEMPLATE
**After Each Trading Session:**
```
Date: __________ Session: London / New York
Total Setups Identified: ____
Trades Taken: ____
Win Rate: ____%
P&L: $______
Best Trade:
- Setup type: _________________
- Entry: ______ Exit: ______
- What went right: _________________
Worst Trade:
- Setup type: _________________
- Entry: ______ Exit: ______
- What went wrong: _________________
Tomorrow's Adjustments:
□ _________________________________
□ _________________________________
□ _________________________________
```
---
## 🚀 QUICK START: YOUR FIRST TRADE
**5-Minute Walkthrough:**
```
1. ADD TO CHART (9:25 AM ET)
→ Load SNIPER ORB indicator
→ Select "New York" session
→ Set targets: 3 levels, 50%
2. WAIT (9:30-10:00 AM)
→ Watch 30min ORB form (purple box)
→ Note VWAP position
→ Identify if price trending or ranging
3. PREPARE (10:00 AM)
→ 30min ORB complete!
→ Measure range (info table shows points)
→ Set alerts for breakout
4. EXECUTE (10:00-11:30 AM)
→ Breakout signal fires
→ Check VWAP alignment
→ Check YM SNIPER confluence
→ Enter trade if 7+ confluence points
5. MANAGE
→ Target 1: Take 50%, move stop to BE
→ Target 2: Take 30%, trail stop
→ Target 3: Let remainder run
6. REPEAT
→ Maximum 3 trades per session
→ Stop after 3 losses
```
---
## 🏆 WINNING TRADER MINDSET
```
"I don't need to trade every ORB breakout.
I only need the HIGH-PROBABILITY setups.
3-5 trades per day is enough.
90%+ win rate on those 3-5 trades = success.
Patience + Precision = Profitability"
```
---
## 📞 TROUBLESHOOTING
**Indicator Not Showing?**
- Check max_boxes/max_lines limits in code
- Verify you're on 1min-30min timeframe
- Ensure TradingView session is 9:30-17:00 ET
**ORBs Look Wrong?**
- Verify timezone: should be "America/New_York"
- Check if market has DST adjustment today
- Confirm broker chart time matches indicator
**VWAP Disappeared?**
- Toggle "Show Anchored VWAP" in settings
- Check if session ended (auto-disappears at 5 PM)
- Verify you're not in pre-market hours
**Targets Too Close/Far?**
- Adjust "Target % Increment" setting
- 30% = tighter, 75% = wider
- Default 50% works for most conditions
---
## 🎯 FINAL CHECKLIST BEFORE GOING LIVE
```
□ Backtested on replay mode for 2+ weeks
□ Understand all 5 setup types
□ Risk management rules memorized
□ YM Ultimate SNIPER v8.1 loaded on same chart
□ TradingView alerts configured
□ Stop/target calculator ready
□ Trading journal template prepared
□ Emotional state: calm and focused
□ Sufficient account size (minimum $10k recommended)
□ Broker platform tested and ready
IF ALL CHECKED → YOU'RE READY TO SNIPE! 🎯
```
---
## 📚 ADVANCED RESOURCES
**Combine SNIPER ORB with:**
- Cumulative Volume Delta (CVD) for confirmation
- Footprint charts for order flow at ORB boundaries
- Market profile for volume-at-price context
- Options flow for institutional positioning
- Economic calendar for high-volatility avoidance
**Study Material:**
- Mark Fisher "The Logical Trader" (ORB bible)
- SMB Capital YouTube (institutional ORB strategies)
- Your own YM Ultimate SNIPER documentation
- Price action at previous session ORBs (historical analysis)
---
**💎 REMEMBER: Quality over quantity. Sniper precision over shotgun spray.**
**🎯 Good luck, and happy sniping! 🎯**
═══════════════════════════════════════════════════════════════════
END OF SNIPER ORB TRADING CHEAT SHEET
═══════════════════════════════════════════════════════════════════

Candle detector (Doji & Engulfing) with alerts by SimonezziStupid simple logic - get notified if needed when doji or engulfing candles show up.

IDLP – Intraday Daily Levels Pro [FXSMARTLAB]🔥 IDLP – Intraday Daily Levels Pro
IDLP – Intraday Daily Levels Pro is a precision toolkit for intraday traders who rely on objective daily structure instead of repainting indicators and noisy signals.
Every level plotted by IDLP is derived from one simple rule:
Today’s trading decisions must be based on completed market data only.
That means:
✅ No use of the current day’s unfinished data for levels
✅ No lookahead
✅ No hidden repaint behavior
IDLP reconstructs the previous trading day from the intraday chart and then projects that structure forward onto the current session, giving you a stable, institutional-style intraday map.
🧱 1. Previous Daily Levels (Core Structure)
IDLP extracts and displays the full previous daily structure, which you can toggle on/off individually via the inputs:
Previous Daily High (PDH)
Previous Daily Low (PDL)
Previous Daily Open
Previous Daily Close,
Previous Daily Mid (50% of the range)
Previous Daily Q1 (25% of the range)
Previous Daily Q3 (75% of the range)
All of these come from the day that just closed and are then locked for the entire current session.
What these levels tell you:
PDH / PDL – true extremes of yesterday’s price action (liquidity zones, breakout/reversal points).
Previous Daily Open / Close – how the market positioned itself between session start and end
Mid (50%) – equilibrium level of the previous day’s auction.
Q1 / Q3 (25% / 75%) internal structure of the previous day’s range, dividing it into four equal zones and helping you see if price is trading in the lower, middle, or upper quarter of yesterday’s range.
All these levels are non-repaint: once the day is completed, they are fixed and never change when you scroll, replay, or backtest.
🎯 2. Previous Day Pivot System (P, S1, S2, R1, R2)
IDLP includes a classic floor-trader pivot grid, but critically:
It is calculated only from the previous day’s high, low, and close.
So for the current session, the following are fixed:
Pivot P – central reference level of the previous day.
Support 1 (S1) and Support 2 (S2)
Resistance 1 (R1) and Resistance 2 (R2)
These levels are widely used by institutional desks and algos to structure:
mean-reversion plays, breakout zones, intraday targets, and risk placement.
Everything in this section is non-repaint because it only uses the previous day’s fully closed OHLC.
📏 3. 1-Day ADR Bands Around Previous Daily Open
Instead of a multi-day ADR, IDLP uses a pure 1-Day ADR logic:
ADR = Range of the previous day
ADR = PDH − PDL
From that, IDLP builds two clean bands centered around the previous daily Open:
ADR Upper Band = Previous Day Open + (ADR × Multiplier)
ADR Lower Band = Previous Day Open − (ADR × Multiplier)
The multiplier is user-controlled in the inputs:
ADR Multiplier (default: 0.8)
This lets you choose how “tight” or “wide” you want the ADR envelope to be around the previous day’s open.
Typical use cases:
Identify realistic intraday extension targets, Spot exhaustion moves beyond ADR bands, Frame reversals after reaching volatility extremes, Align trades with or against volatility expansion
Again, since ADR is calculated only from the completed previous day, these bands are totally non-repaint during the current session.
🔒 4. True Non-Repaint Architecture
The internal logic of IDLP is built to guarantee non-repaint behavior:
It reconstructs each day using time("D") and tracks:
dayOpen, dayHigh, dayLow, dayClose for the current day
prevDayOpen, prevDayHigh, prevDayLow, prevDayClose for the previous day
At the moment a new day starts:
The “current day” gets “frozen” into prevDay*
These prevDay* values then drive: Previous Daily Levels, Pivots, ADR.
During the current day:
All these “previous day” values stay fixed, no matter what happens.
They do not move in real time, they do not shift in replay.
This means:
What you see in the past is exactly what you would have seen live.
No fake backtests.
No illusion of perfection from repainting behavior.
🎯 5. Designed For Intraday Traders
IDLP – Intraday Daily Levels Pro is made for:
- Day traders and scalpers
- Index and FX traders
- Prop firm challenge trading
- Traders using ICT/SMC-style levels, liquidity, and range logic
- Anyone who wants a clean, institutional-style daily framework without noise
You get:
Previous Day OHLC
Mid / Q1 / Q3 of the previous range
Previous-Day Pivots (P, S1, S2, R1, R2)
1-Day ADR Bands around Previous Day Open
All calculated only from closed data, updated once per day, and then locked.

TRI - Multi-Timeframe FVGTRI - MULTI-TIMEFRAME FAIR VALUE GAPS v1.0.0
DESCRIPTION:
Advanced multi-timeframe Fair Value Gap (FVG) indicator that displays FVG zones from higher timeframes
on your current chart. Supports automatic or manual timeframe selection with comprehensive visualization
and alert system.
KEY FEATURES:
Multi-timeframe FVG detection - view FVG from any higher timeframe
Automatic timeframe selection - configure different FVG timeframes for each chart timeframe
Automatic mitigation detection - zones change color when price mitigates them
Configurable FVG threshold - filter out small gaps
Customizable visualization - colors, borders, labels, text colors
Smart zone inclusion - larger zones automatically remove smaller included zones
Memory efficient - automatic cleanup of expired zones
HOW IT WORKS:
A Fair Value Gap (FVG) is detected when there's a 3-candle pattern with a gap between candle 1 and
candle 3, indicating institutional order flow imbalances. Bullish FVG occurs when candle 3's low is
above candle 1's high (gap up), creating a demand zone shown in green. Bearish FVG occurs when candle
3's high is below candle 1's low (gap down), creating a supply zone shown in red.
The indicator uses request.security() to fetch data from the selected higher timeframe, detects FVG
patterns on that timeframe, and displays them on your current chart. FVG zones remain active until
price closes through them (mitigation), then change color and remain visible for a configurable
number of bars before disappearing.
TIMEFRAME CONFIGURATION:
Configure different FVG timeframes based on current chart timeframe:
1m-5m charts → Default 4h FVG
15m charts → Default 4h FVG
30m-1h charts → Default 4h FVG
4h charts → Default 4h FVG
Daily charts → Default Daily FVG
Weekly charts → Default Weekly FVG
Monthly charts → Default Monthly FVG
All timeframes are configurable via input settings.
BEST USE:
Works on all timeframes and asset classes. Particularly useful for intraday traders who want to see
higher timeframe FVG zones on their lower timeframe charts. FVG zones often act as support/resistance
and are frequently filled by price returning to rebalance the imbalance. Use them to identify potential
entry/exit points, stop-loss placement, and institutional order flow areas.
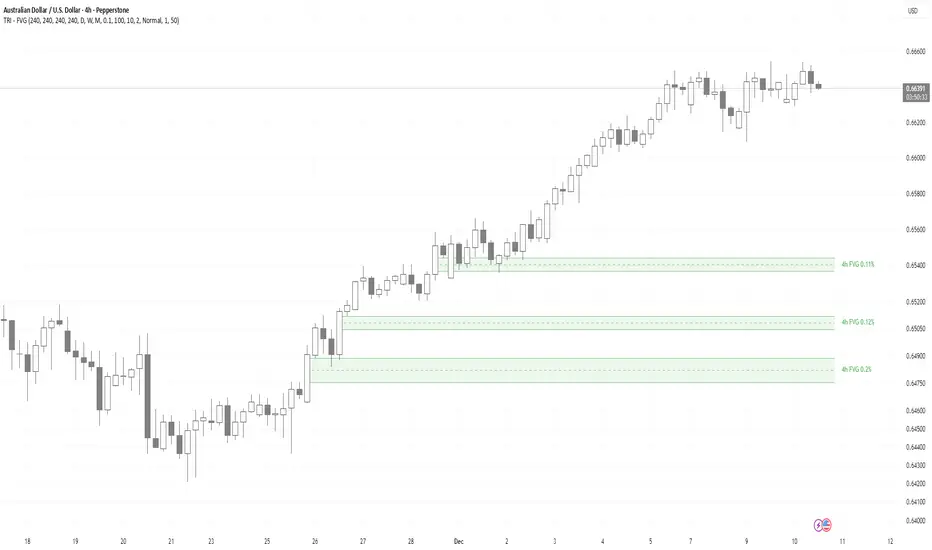
cảnh báo Khi Nến M15 Đóngtoday timeframe today timeframe today timeframe today timeframe today timeframe

Multi-EMA Slope DashboardThis script provides a comprehensive dashboard displayed directly on the chart, allowing you to analyze the underlying trend using 8 Exponential Moving Averages (EMA) ranging from period 20 to 55.
Unlike classic indicators that simply check if the price is above or below the EMA, this tool analyzes the slope of each moving average to determine the true market dynamics.
The indicator calculates the status of 8 distinct EMAs (20, 25, 30, 35, 40, 45, 50, 55). For each EMA, the script determines the direction using the following logic:
Slope Calculation: It compares the current EMA value with its value 3 bars ago (variable nb_bougies).
Neutrality Threshold: To avoid false signals in ranging (flat) markets, a neutrality filter is applied (0.01% of the EMA value).
Dashboard Interpretation
The table is located at the top right of your screen and displays three columns:
EMA: The moving average period (e.g., 20, 55).
State:
H (Hausse / Up): The slope is positive and above the threshold.
B (Baisse / Down): The slope is negative and below the negative threshold.
N (Neutre / Neutral): The slope is weak, indicating no clear trend.
COL (Color): Quick visual indicator.
🔵 Blue: Bullish trend.
🟠 Orange: Bearish trend.
⚪ Gray: Neutral Trend / Ranging.
Trading Usage
Trend Confirmation: Use the "Totaux" (Totals) counter at the bottom of the table. If you see 8/8 H (Blue), the bullish trend is strong and aligned across all timeframes (short and medium term).
Reversal Detection: If fast EMAs (20, 25) turn Orange (B) while slow ones (50, 55) are still Blue (H), this may signal the beginning of a correction or a trend reversal.

Liquidity Heatmap [Eˣ]💧 Liquidity Heatmap - Free Indicator
Overview
The Liquidity Heatmap reveals where stop losses are clustered in the market - the hidden liquidity zones that smart money targets. This indicator automatically identifies Buy-Side Liquidity (BSL) above price and Sell-Side Liquidity (SSL) below price, showing you exactly where institutional traders are likely to hunt for stops before major moves.
━━━━━━━━━━━━━━━━━━━━━━━━━━━━
🎯 What This Indicator Does
Identifies Liquidity Zones:
• Buy-Side Liquidity (BSL) - Stop losses from SHORT positions clustered above price
• Sell-Side Liquidity (SSL) - Stop losses from LONG positions clustered below price
• Automatically clusters nearby levels into high-probability zones
• Shows liquidity strength (1-5+) - higher numbers = more stops = bigger target
• Removes swept liquidity in real-time as price takes out stops
Visual Display:
• 🔴 Red Zones Above Price = Buy-Side Liquidity (shorts' stops)
• 🟢 Green Zones Below Price = Sell-Side Liquidity (longs' stops)
• Thicker/Darker Zones = Higher liquidity concentration
• BSL/SSL Labels = Show exact strength count
• Triangle Markers = Liquidity sweep alerts (when price takes stops)
Smart Features:
• Auto-removes old liquidity (customizable lookback period)
• Clusters nearby levels to reduce noise
• Tracks liquidity strength and age
• Updates in real-time as new swing points form
• Alerts when major liquidity zones are swept
━━━━━━━━━━━━━━━━━━━━━━━━━━━━
📊 How To Use This Indicator
Understanding Liquidity Concepts
What is Liquidity?
Liquidity refers to clusters of stop loss orders sitting in the market. These stops represent:
• Long traders' stop losses (below support) = Sell-Side Liquidity
• Short traders' stop losses (above resistance) = Buy-Side Liquidity
Why Does This Matter?
• Institutions NEED liquidity to fill large orders
• Price often "sweeps" liquidity zones before reversing
• Major liquidity = major target for smart money
• Understanding liquidity = understanding market maker behavior
The Liquidity Cycle:
1. Retail traders place stops at obvious levels (swing highs/lows)
2. Smart money identifies these clusters
3. Price is pushed to sweep the stops (liquidity grab)
4. Institutions fill their orders with this liquidity
5. Price reverses in the opposite direction
━━━━━━━━━━━━━━━━━━━━━━━━━━━━
💡 Trading Strategies
Strategy 1: Liquidity Sweep Reversals
Best For: Swing trading, catching reversals
Timeframes: 15min, 1H, 4H, Daily
Entry Setup:
1. Identify strong Sell-Side Liquidity (SSL) zone below price
2. Wait for price to sweep down into the SSL zone
3. Look for rejection/reversal candle pattern (pin bar, engulfing)
4. Enter LONG after sweep and reversal confirmation
5. Stop loss: Below the swept liquidity zone
6. Target: Opposite liquidity zone or key resistance
Why It Works: Smart money sweeps stops to fill buy orders, then pushes price higher
Example:
• SSL zone at $45,000 with strength 3
• Price drops to $44,950, sweeps the SSL
• Strong bullish reversal candle forms
• Enter long at $45,100
• Target: BSL zone at $47,000
Strategy 2: Liquidity-to-Liquidity Runs
Best For: Day trading, scalping
Timeframes: 5min, 15min, 1H
Entry Setup:
1. Price sweeps Sell-Side Liquidity below and reverses up
2. Identify Buy-Side Liquidity zone above
3. Enter LONG targeting the BSL zone above
4. Exit near/at the BSL zone (don't wait for sweep)
5. Stop loss: Below recent swing low
Why It Works: Price moves from liquidity pool to liquidity pool
Variation - Reverse for Shorts:
• BSL sweep above → Look for SSL zone below
• Enter short targeting lower liquidity
Strategy 3: Liquidity Avoidance (Stop Placement)
Best For: Improving win rate on existing strategies
Timeframes: All
Rules:
1. NEVER place stops exactly at obvious liquidity zones
2. Place stops beyond the liquidity zone with buffer
3. Or place stops before the liquidity zone (tighter, riskier)
4. Monitor liquidity strength - avoid zones with strength 3+
Why It Works: Market makers hunt obvious stop clusters
Example:
• Trading long, swing low at $100 (SSL zone, strength 4)
• Bad: Stop at $99.50 (will get swept)
• Better: Stop at $98.50 (beyond the liquidity)
• Alternative: Stop at $100.50 (tighter, before sweep zone)
Strategy 4: Confluence Trading
Best For: High probability setups
Timeframes: 1H, 4H, Daily
Entry Setup:
1. Find liquidity zone that aligns with:
• Major support/resistance level
• Fibonacci retracement (0.618, 0.786)
• Trendline
• Round psychological number ($50,000, $2,000, etc)
2. Wait for sweep of this high-confluence zone
3. Enter on reversal with multiple confirmations
4. Larger position size justified by confluence
Why It Works: Multiple factors = institutional interest = higher probability
━━━━━━━━━━━━━━━━━━━━━━━━━━━━
⚙️ Settings Explained
Core Settings
Swing Detection Length (Default: 10)
• Number of bars left/right to identify swing highs and lows
• Lower values (5-8): More sensitive, more liquidity zones, more noise
• Higher values (12-20): Less sensitive, only major swings, cleaner chart
• Recommended: 8-10 for intraday, 10-15 for swing trading
Liquidity Lookback Bars (Default: 100)
• How many historical bars to track liquidity zones
• Lower values (50-75): Shows only recent liquidity
• Higher values (100-200): Shows longer-term liquidity clusters
• Zones older than this are automatically removed
• Recommended: 100-150 for most timeframes
Zone Proximity % (Default: 0.5)
• Percentage threshold to group nearby levels into single zone
• Lower values (0.2-0.4): Keeps levels separate, more zones
• Higher values (0.6-1.0): Aggressive clustering, fewer zones
• Recommended: 0.4-0.6 for crypto, 0.3-0.5 for forex, 0.5-0.8 for stocks
Visualization Settings
Show Buy-Side Liquidity
• Toggle ON/OFF red zones above price
• Turn OFF if only interested in downside liquidity
Show Sell-Side Liquidity
• Toggle ON/OFF green zones below price
• Turn OFF if only interested in upside liquidity
Show Liquidity Labels
• Toggle BSL/SSL labels with strength numbers
• Turn OFF for cleaner chart appearance
• Keep ON to see exact liquidity strength
Display Style
• Boxes: Filled rectangular zones (best for visualizing strength)
• Lines: Horizontal dashed lines (minimal, clean look)
• Both: Boxes + Lines (maximum visibility)
Color Intensity
• Low: 85% transparency (subtle, less distracting)
• Medium: 75% transparency (balanced visibility)
• High: 65% transparency (bold, maximum visibility)
━━━━━━━━━━━━━━━━━━━━━━━━━━━━
📱 Info Panel Guide
Located in the top-right corner, the info panel provides real-time liquidity statistics:
Buy-Side Zones
• Count of active BSL zones above current price
• Higher number = More upside targets for price
Sell-Side Zones
• Count of active SSL zones below current price
• Higher number = More downside targets for price
Total Zones
• Combined count of all active liquidity
• Useful for gauging overall market structure
Nearest BSL
• Distance in % to closest Buy-Side Liquidity above
• Example: +2.5% means BSL is 2.5% above current price
• Quick reference for next upside target
Nearest SSL
• Distance in % to closest Sell-Side Liquidity below
• Example: -1.8% means SSL is 1.8% below current price
• Quick reference for next downside target
Liquidity Bias
• ⬆️ Bullish : More BSL than SSL (upside targets dominate)
• ⬇️ Bearish : More SSL than BSL (downside targets dominate)
• ↔️ Balanced: Equal liquidity on both sides (range-bound)
━━━━━━━━━━━━━━━━━━━━━━━━━━━━
🎓 Understanding Liquidity Strength
What Do The Numbers Mean?
Strength 1 : Single swing point
• Light liquidity, minor target
• Can be ignored in trending markets
• Useful in ranging/choppy conditions
Strength 2-3 : Moderate liquidity cluster
• Multiple nearby swing points merged
• Decent target for intraday moves
• Watch for potential sweeps
Strength 4-5 : Strong liquidity cluster
• Major cluster of stops
• High-probability target for institutions
• Expect reactions when swept
Strength 6+ : Extreme liquidity pool
• Massive stop cluster (rare)
• Critical zone - high probability of sweep
• Often marks major support/resistance
• Ideal for confluence setups
━━━━━━━━━━━━━━━━━━━━━━━━━━━━
📱 Alert Setup
This indicator includes 2 powerful alert types:
1. Buy-Side Liquidity Sweep
• Triggers when price sweeps BSL zone above
• Shows potential bullish reversal opportunity
• Often precedes upward continuation after sweep
2. Sell-Side Liquidity Sweep
• Triggers when price sweeps SSL zone below
• Shows potential bearish reversal opportunity
• Often precedes downward continuation after sweep
To Set Up Alerts:
1. Click the "Alert" button (clock icon) in TradingView
2. Condition: Select "Liquidity Heatmap"
3. Choose alert type: BSL Sweep or SSL Sweep
4. Configure notification method (push, email, webhook)
5. Click "Create"
Pro Tip: Set alerts for both BSL and SSL sweeps to catch opportunities in both directions
━━━━━━━━━━━━━━━━━━━━━━━━━━━━
💎 Pro Tips & Best Practices
✅ DO:
• Wait for confirmation - Don't enter immediately on sweep, wait for reversal pattern
• Combine with trend - SSL sweeps in uptrends = higher probability longs
• Check multiple timeframes - 1H liquidity + 4H liquidity = strongest zones
• Monitor strength - Focus on zones with strength 3+
• Use proper risk management - Liquidity sweeps can go further than expected
• Watch for re-sweeps - Sometimes liquidity zones get swept multiple times
• Consider volume - High volume sweeps = stronger reversal potential
⚠️ DON'T:
• Don't fade strong trends - In strong trends, sweeps often continue rather than reverse
• Don't overtrade - Not every sweep is a tradeable setup
• Don't ignore context - Check broader market conditions and news
• Don't use alone - Combine with price action, support/resistance, and other analysis
• Don't place stops at liquidity - Your stops will be hunted
• Don't expect perfection - Some sweeps fail, some zones never get hit
🎯 Best Timeframes:
• Scalping: 5min, 15min (fast moves, frequent sweeps)
• Day Trading: 15min, 1H (balanced view)
• Swing Trading: 1H, 4H, Daily (major liquidity zones)
• Position Trading: 4H, Daily, Weekly (institutional liquidity)
🔥 Best Markets:
• Crypto (high volatility, frequent liquidity grabs)
• Forex (EUR/USD, GBP/USD - liquid pairs)
• Futures (ES, NQ, CL - high liquidity contracts)
• Stocks (large caps with high volume)
⏰ Best Times:
• Market opens (high volatility = liquidity hunting)
• Before/after major news events
• Session overlaps (London/NY for forex)
• First hour and last hour of trading
━━━━━━━━━━━━━━━━━━━━━━━━━━━━
🚀 What Makes This Different?
Unlike basic pivot indicators, the Liquidity Heatmap:
• Institutional Perspective - Shows where smart money hunts stops
• Dynamic Clustering - Automatically groups nearby levels for clarity
• Strength Tracking - Not just where, but HOW MUCH liquidity exists
• Auto-Cleanup - Removes swept and old liquidity automatically
• Visual Clarity - Instant understanding of market structure
• Actionable - Clear targets and reversal zones for trading
• Real-Time Updates - Adapts as market structure evolves
Based On Professional Concepts:
• Order flow analysis
• Market maker behavior
• Institutional trading techniques
• Liquidity engineering principles
━━━━━━━━━━━━━━━━━━━━━━━━━━━━
📈 Common Liquidity Patterns
Pattern 1: The Double Sweep
• Price sweeps SSL below, reverses up
• Price sweeps BSL above, reverses down
• Back to original range
• Trading: Fade the second sweep for mean reversion
Pattern 2: The Cascade
• Multiple SSL zones stacked below
• Price sweeps first zone, continues to next
• Chain reaction of stop losses triggering
• Trading: Ride the momentum to lowest zone
Pattern 3: The Fake-Out
• Price approaches liquidity but doesn't quite sweep
• Reverses before hitting the zone
• "Scared money" didn't wait for full sweep
• Trading: Wait for actual sweep, don't anticipate
Pattern 4: The Absorption
• Price sweeps major liquidity zone (strength 5+)
• No reversal, just consolidation
• Institutions absorbed all liquidity
• Trading: Wait for breakout direction, likely continuation
━━━━━━━━━━━━━━━━━━━━━━━━━━━━
📈 Upgrade Your Trading Arsenal
This free indicator gives you institutional-level liquidity analysis. Want more?
🔥 Check out my premium scripts for:
• Automated entry signals with liquidity confirmation
• Multi-timeframe liquidity analysis
• Advanced stop loss management that avoids liquidity zones
• Backtested strategies with performance tracking
• Custom alerts for high-probability setups
• And much more...
👉 Visit my profile to see all available tools!
━━━━━━━━━━━━━━━━━━━━━━━━━━━━
📝 Important Notes
• Liquidity analysis is one piece of the puzzle - use with other analysis methods
• Not all liquidity zones get swept - some remain untouched
• Market conditions change - adapt your strategy accordingly
• Always use proper position sizing and risk management
• Liquidity sweeps can be violent - use appropriate stop losses
• Practice on demo accounts before trading with real capital
• Past liquidity patterns don't guarantee future price action
Disclaimer: This indicator is for educational purposes. Trading involves risk. Always do your own research and never risk more than you can afford to lose.
━━━━━━━━━━━━━━━━━━━━━━━━━━━━
🙏 Support This Work
If you find this indicator valuable:
• ⭐ Give it a thumbs up
• 💬 Share your best liquidity sweep trades in the comments
• 🔔 Follow for more free professional-grade tools
• 🚀 Share with traders who need to understand liquidity
Got questions? Drop a comment and I'll help you master liquidity trading!
━━━━━━━━━━━━━━━━━━━━━━━━━━━━
Developed with ❤️ for traders who want to think like institutions
━━━━━━━━━━━━━━━━━━━━━━━━━━━━
Version History
• v1.0 - Initial release with dynamic liquidity detection and clustering

EMA Touch AlertCan be used so you don't have to update your alert as your EMA moves with price. You can set the alert by clicking on the EMA touch on the chart, or by creating alert and selecting EMA Touch alert. Enjoy, it's very useful.


2026 CHRISTMAS PRESENT CHRISTMAS PRESENT
Overview
The Cash Detector is a comprehensive trading strategy that combines momentum analysis with price action confirmation to identify high-probability entry points. This strategy is designed to capture trend reversals and continuation moves by requiring multiple confirming signals before entry, significantly reducing false signals common in single-indicator systems.
Strategy Background
The strategy is built on the principle of confluence trading requiring multiple technical factors to align before taking a position. It focuses on two critical phases of market rotation:
Q2 Momentum Phase: Uses MACD crossovers to identify shifts in market momentum, signaling when bulls or bears are gaining control.
Q4 Trigger Phase: Employs engulfing candlestick patterns to confirm strong directional pressure and validate the momentum signal with actual price action.
By combining these elements, the strategy filters out weak signals and focuses only on setups where both momentum AND price action agree on direction.
Key Features
Dual Confirmation System: Requires both MACD momentum shift and engulfing candle pattern
RSI Filter: Optional overbought/oversold filter to avoid extreme conditions
Built-in Risk Management: Configurable stop loss and take profit levels
Performance Dashboard: Real-time ROI metrics displayed on chart
Full Backtesting: Strategy mode allows historical performance analysis
Trading Rules
LONG ENTRY BUY
All conditions must occur on the same candle:
1. Momentum Confirmation:
MACD line crosses above signal line bullish crossover
2. Price Action Confirmation:
Bullish engulfing pattern forms:
Current close greater than previous open
Current open less than previous close
Current close greater than current open
3. RSI Filter Optional:
RSI less than 70 not overbought
Visual Signal: Green LONG label appears below the candle
SHORT ENTRY SELL
All conditions must occur on the same candle:
1. Momentum Confirmation:
MACD line crosses below signal line bearish crossover
2. Price Action Confirmation:
Bearish engulfing pattern forms:
Current close less than previous open
Current open greater than previous close
Current close less than current open
3. RSI Filter Optional:
RSI greater than 30 not oversold
Visual Signal: Red SHORT label appears above the candle
Exit Rules
Stop Loss Default 2 percent
Long: Exit if price drops 2 percent below entry
Short: Exit if price rises 2 percent above entry
Take Profit Default 4 percent
Long: Exit if price rises 4 percent above entry
Short: Exit if price drops 4 percent below entry
Input Parameters
Indicator Settings
MACD Fast Length: 12 default
MACD Slow Length: 26 default
RSI Length: 14 default
Risk Management
Use Stop Loss: Enable or disable stop loss
Stop Loss percent: Percentage risk per trade default 2 percent
Use Take Profit: Enable or disable take profit
Take Profit percent: Target profit per trade default 4 percent
Filters
Use RSI Filter: Enable or disable RSI overbought oversold filter
RSI Overbought: Upper threshold default 70
RSI Oversold: Lower threshold default 30
Performance Metrics
The built-in dashboard displays:
Net Profit: Total profit loss in currency and percentage
Total Trades: Number of completed trades
Win Rate: Percentage of profitable trades
Profit Factor: Ratio of gross profit to gross loss
Average Win Loss: Mean profit per winning losing trade
Max Drawdown: Largest peak to trough decline
Best Practices
1. Timeframe Selection: Works on multiple timeframes test on 15min 1H 4H and daily
2. Market Conditions: Most effective in trending markets with clear momentum
3. Risk Reward Ratio: Default 1:2 ratio 2 percent risk 4 percent reward is conservative adjust based on backtesting
4. Combine with Context: Consider overall market trend and support resistance levels
5. Backtest First: Always backtest on your specific instrument and timeframe before live trading
Risk Disclaimer
This strategy is for educational purposes. Past performance does not guarantee future results. Always:
Backtest thoroughly on historical data
Paper trade before using real capital
Use proper position sizing and risk management
Never risk more than you can afford to lose
Customization Tips
Aggressive traders: Reduce stop loss to 1.5 percent increase take profit to 5 percent
Conservative traders: Increase stop loss to 3 percent reduce take profit to 3 percent
Ranging markets: Enable RSI filter to avoid false breakouts
Strong trends: Disable RSI filter to catch all momentum shifts
Technical Details
Indicators Used:
Moving Average Convergence Divergence MACD
Relative Strength Index RSI
Candlestick Pattern Recognition
Strategy Type: Trend following with momentum confirmation
Best Suited For: Stocks Forex Crypto Indices
Version 1.0
Compatible with Pine Script v5

Trading Sessions High/Low Zones The BestHiển thị toàn bộ session zone, có tùy chọn các ngày cần hiển thị gần nhất.
Hỗ trợ tốt hơn :)

HTF Candle Overlay – Multi-Timeframe Visualization ToolThis indicator overlays true Higher Timeframe (HTF) candlesticks directly onto any lower timeframe chart, allowing you to see the larger market structure while trading on precise execution timeframes such as 1-minute, 3-minute, or 5-minute.
Instead of constantly switching chart timeframes, you can now see both higher and lower timeframe price action at the same time. Each HTF candle is drawn as a large transparent candlestick with full upper and lower wicks, perfectly aligned in both time and price.
This makes it easy to identify:
- Trend direction from the higher timeframe
- Key support and resistance zones inside each HTF candle
- Liquidity sweeps and rejections across timeframes
- Optimal entries on lower timeframes with higher-timeframe confirmation
Key Features
- Displays true Higher Timeframe candles on any lower timeframe
- Clear transparent candle bodies for unobstructed price visibility
- Full upper and lower wicks
- Non-repainting confirmed candles
- Optional live display of the currently forming HTF candle
- Accurate time-based alignment
- Lightweight and optimized for performance
Who This Indicator Is For
- Scalpers who want higher-timeframe bias
- Day traders using multi-timeframe confirmation
- Smart Money / ICT traders monitoring HTF structure
- Anyone who wants clean multi-timeframe clarity without chart switching
How To Use
- Apply the indicator to any chart.
- Select your preferred Higher Timeframe (HTF) in the settings.
- Use your lower timeframe for entries while respecting HTF structure and direction.
- This tool helps you trade with the bigger picture in view while executing with precision on lower timeframes.
