Exponential Moving Average (Set of 3) [Krypt] + 13/34 EMAsI took Krypt's script and essentially added on to it.
the 20/50/100/200 EMAs should be used together as support and resistance as normal.
Wait for price to break 200 EMA
Wait for 50 EMA to cross 200 EMA
Wait for pullback to 50 EMA to open position
20 and 100 EMAs are for extra information about moving support and resistance
and 13/34 EMAs should be used in conjunction
When 13 EMA crosses 34 EMA, open position
When price gets far from 13/34, close position (because price will attempt to revert back to mean)
This is better for scalping and swing trades than the 20/50/100/200 setup.
Twitter: @AzorAhai06
Search in scripts for "20蒙古币兑换人民币"

Gap Gain Test V1.0 by @overratedtraderOddball indicators for entertainment purposes only. This is best used on daily chart.
Look at the 20 ALMA to gauge likelihood of stock following its up or down gap.
- if above the 20 ALMA , follow the gap direction
- if below the 20 ALMA , take counter trend trade
If stock gaps up AND closes higher than it opens, that gain % (close/open) is colored green and if stock gaps down and closes lower than it opens, that gain % (close/open) is colored green
Conversely if the stock gaps up BUT closes lower than it opens, red and if a stop gaps down but closes higher than it opens, red.
Enjoy and follow me on twitter @overratedtrader for more nonsensical and out-of-the-box ideas.

Adaptive Donchian ChannelThis indicator adds a level of adaptivity to the simple Donchian Channel by adjusting the sensitivity (lookback periods) of the channel's upper and lower bounds based on the amount of time that has elapsed since the price has hit/expanded the channel boundaries. Comparing the results of this indicator to the standard Donchian Channel, the readier level of responsiveness may prove self-evident.
METHODOLOGY:
Specifically, the more recently the channel was expanded in one direction, the longer the lookback period grows in that direction. Conversely, if the channel has not been expanded in a given direction, the lookback period will contract so as to allow for a tighter channel.
For example, let the initial lookback period be 20 bars and let the factor argument be 0.1 (or 2 bars to start, as 20*0.1 = 2). Now say the current bar sets a new 20-period high. Then the lookback period for the upper bound is expanded by 2 bars to 22, and the lookback period for the lower bound is contracted by 2 bars to 18, thereby making it simultaneously harder to set new highs and easier to set new lows (and vice versa for hitting new lows). If neither a new high nor a new low is formed, both periods contract by the given factor.

TonyUX EMA Scalper - Buy / SellThis is a simple scalping strategy that works for all time frames... I have only tested it on FOREX
It works by checking if the price is currently in an uptrend and if it crosses the 20 EMA.
If it crosses the 20 EMA and its in and uptrend it will post a BUY SIGNAL.
If it crosses the 20 EMA and its in and down it will post a SELL SIGNAL.
The red line is the highest close of the previous 8 bars --- This is resistance
The green line is the lowest close of the previous 8 bars -- This is support

EMA_ConvergenceFirst I have to give kudos to my son who I asked to take a shot at creating this little indicator. Nice work son!
While trading, one of the things I look for is when price or certain EMA's approach another EMA. The example that I use on this 1 minute SPY chart is an 8 EMA and 20 EMA. I am looking for when the 8 and 20 are within' 3 cents of each other. Many times when they are getting close, price is approaching a top or bottom. I am looking for a candlestick reversal around that area. You may want to know when PRICE is near the 50 EMA: Use EMA 1 and 50 for that. Having it light up on top of the page, or elsewhere, makes it easier to look for the convergence when it occurs. If it lights up for a long period, price may be going sideways. I don't enter into a trade until the EMA starts separating, usually with another candlestick formation.
You are able to change the distance for convergence and two EMA's. Unfortunately you will have to adjust the convergence number up as you increase in time frames. This is designed to see when they are close, not when they cross.
The bars on top of this example are lit up purple due to the 8 and 20 EMA are within' 3 cents of each other.
If you want to overlay the price bars, instead of having it separate, just change overlay to "true"
Enjoy.

ORB + SMA + EMA + BUY/SELL by yuvaraj ORB (Opening Range Breakout)
Meaning:
ORB stands for Opening Range Breakout.
It is a trading strategy where you watch the price movement for the first few minutes after the market opens (for example, 9:15 – 9:30 AM in India).
You mark the high and low during this period.
If price goes above the high, it signals a possible buy (long trade).
If price goes below the low, it signals a possible sell (short trade).
Why traders use it:
First few minutes decide the market direction.
Helps catch early momentum trades.
Very popular for intraday traders (Nifty, BankNifty, Crude Oil, etc.).
Example:
Market opens at 9:15.
First 5 minutes: High = 100, Low = 95.
If price moves above 100 → Buy.
If price moves below 95 → Sell.
📌 SMA (Simple Moving Average)
Meaning:
SMA stands for Simple Moving Average.
It is the average closing price of a stock over a certain number of candles.
Example:
SMA 9 → Average price of last 9 candles.
SMA 50 → Average price of last 50 candles.
Why traders use it:
Shows trend direction.
SMA going up → Uptrend, SMA going down → Downtrend.
You can use multiple SMAs (for example SMA 9 and SMA 50):
If SMA 9 crosses above SMA 50 → Buy signal.
If SMA 9 crosses below SMA 50 → Sell signal.
🔑 Key Difference:
Feature ORB SMA
Type Strategy (price breakout) Indicator (average price)
Use Entry trigger for trades Identifies trend direction
Works Best Intraday (first minutes) Any timeframe (intraday or swing)
Plots ORB High/Low lines for the first few minutes
Plots SMA 9/50/180 & EMA 20
Plots trailing stopline + Buy/Sell arrows
Optional bar color / background color toggle
Alert conditions for Buy/Sell
ORB high/low lines
SMA 9/50/180 + EMA 20
Buy/Sell arrows + trailing stopline

Chartlense Dashboard (Data, Trend & Levels)Chartlense Dashboard (Data, Trend & Levels)
Overview
This dashboard is designed to solve two common problems for traders: chart clutter and the manual drawing of support and resistance levels . It consolidates critical data from multiple indicators into a clean table overlay and automatically plots the most relevant S&R levels based on recent price action. The primary goal is to provide a clear, at-a-glance overview of the market's structure and data.
It offers both a vertical and horizontal layout to fit any trader's workspace.
Key Concepts & Calculations Explained
This indicator is more than a simple collection of values; it synthesizes data to provide unique insights. Here’s a conceptual look at how its core components work:
Automatic Support & Resistance (Pivot-Based):
The dashed support (green) and resistance (red) lines are not manually drawn. They are dynamically calculated based on the most recent confirmed pivot highs and pivot lows . A pivot is a foundational concept in technical analysis that identifies potential turning points in price action.
How it works: A pivot high is a candle whose `high` is higher than a specific number of candles to its left and right (the "Pivot Lookback" is set to 5 by default in the settings). A pivot low is the inverse. By automatically identifying these confirmed structural points, the script visualizes the most relevant levels of potential supply and demand on the chart.
Relative Volume (RVOL):
This value in the table is not the standard volume. It measures the current bar's volume against its recent average (specifically, `current volume / 10-period simple moving average of volume`).
Interpretation: A reading above 2.0 (indicated by green text) suggests that the current volume is more than double the recent average. This technique is used to identify significant volume spikes, which can add conviction to breakouts or signal potential market climaxes.
Consolidated Data for Context:
Other values displayed in the table, such as the EMAs (9, 20, 200) , Bollinger Bands (20, 2) , RSI (14) , MACD (12, 26, 9) , and VWAP (on intraday charts), use their standard industry calculations. They are included to provide a complete contextual picture without needing to load each indicator separately, saving valuable chart space.
How to Use This in Your Trading
This dashboard is designed as a tool for confluence and context , not as a standalone signal generator. Here are some ways to integrate it into your analysis workflow:
As a Trend Filter: Before considering a trade, quickly glance at the EMAs and the MACD values in the table. A price above the key EMAs and a positive MACD can serve as a quick confirmation that you are aligned with the dominant trend.
To Validate Breakouts: When the price is approaching a key Resistance level (red pivot line), watch the RVOL value . A reading above 2.0 on the breakout candle adds significant confirmation that the move is backed by strong interest. The same logic applies to breakdowns below a support level.
To Spot Potential Reversals: Confluence is key. For example, if the price is testing a Support level (green pivot line) AND the RSI in the table is approaching oversold levels (e.g., near 30), it can signal a higher probability reversal setup.
About This Indicator
This indicator was developed by the team at ChartLense to help traders declutter their charts and focus on the data that matters. We believe in making complex analysis more accessible and organized. We hope this free tool is a valuable addition to your trading process.

Trend-Strong Candle - 3 EMAs with Filters# Trend-Strong Candle - Professional Trading Indicator
## 📊 What It Does
Identifies high-probability entries by combining triple EMA trend analysis with strong candle detection. Only signals when all conditions align for maximum accuracy.
## 🎯 Core Features
- Triple EMA System: Fast (20) / Medium (50) / Slow (200) for trend confirmation
- Strong Candle Filter: ATR-based sizing ensures genuine momentum
- Advanced Filters: EMA close validation + trend stability checks
- Live Alerts: Instant notifications for real-time signals
- Session Filter: Trade only during active EU/US market hours
## ⚡ Quick Setup
Scalping (1-5min): Default settings + enable session filter
Day Trading (15-60min): Default settings work perfectly
Swing Trading (4H+): Increase ATR multiplier to 0.8-1.0
## 📈 Trading Rules
Long Signals: Green triangle below candle
- Strong bullish candle during confirmed uptrend
- All EMAs properly aligned (Fast > Medium > Slow)
Short Signals: Red triangle above candle
- Strong bearish candle during confirmed downtrend
- All EMAs properly aligned (Fast < Medium < Slow)
## ⚠️ Critical Success Factors
1. Always Verify the Trend Yourself
The indicator helps identify signals, but YOU must confirm the larger trend context. Check higher timeframes and overall market structure before entering.
2. Understand the "Big Players"
Strong candles in trend direction usually come from institutional money (banks, funds, algorithms). These create the momentum that retail traders can follow. The indicator catches these institutional moves.
3. Distance to Next Value Level
NEVER enter if price is too close to major resistance/support levels:
- Check distance to round numbers (1.1000, 1.1050, etc.)
- Ensure at least 20-30 pips room to next key level
- You need space for profit - tight levels = limited upside
4. Risk Management
- Stop Loss: 1-2 ATR from entry
- Take Profit: 2-3 ATR target (minimum 1:2 R/R)
- Position Size: Risk max 1-2% per trade
## 💡 Pro Tips
- Best Sessions: London open (8-12 UTC) and NY open (13-17 UTC)
- Avoid: Major news, low liquidity periods, choppy markets
- Multiple Timeframes: Confirm signals on higher timeframe
- Value Levels: Always check daily/weekly support/resistance before entering
## 🎯 Success Formula
Trend Confirmation + Strong Institutional Candle + Distance to Value Levels = High Probability Trade
*
Remember: The indicator finds the signals, but successful trading requires your analysis of trend context and value level positioning. Trade smart, not just frequent.

ATR Future Movement Range Projection
The "ATR Future Movement Range Projection" is a custom TradingView Pine Script indicator designed to forecast potential price ranges for a stock (or any asset) over short-term (1-month) and medium-term (3-month) horizons. It leverages the Average True Range (ATR) as a measure of volatility to estimate how far the price might move, while incorporating recent momentum bias based on the proportion of bullish (green) vs. bearish (red) candles. This creates asymmetric projections: in bullish periods, the upside range is larger than the downside, and vice versa.
The indicator is overlaid on the chart, plotting horizontal lines for the projected high and low prices for both timeframes. Additionally, it displays a small table in the top-right corner summarizing the projected prices and the percentage change required from the current close to reach them. This makes it useful for traders assessing potential targets, risk-reward ratios, or option strategies, as it combines volatility forecasting with directional sentiment.
Key features:
- **Volatility Basis**: Uses weekly ATR to derive a stable daily volatility estimate, avoiding noise from shorter timeframes.
- **Momentum Adjustment**: Analyzes recent candle colors to tilt projections toward the prevailing trend (e.g., more upside if more green candles).
- **Time Horizons**: Fixed at 1 month (21 trading days) and 3 months (63 trading days), assuming ~21 trading days per month (excluding weekends/holidays).
- **User Adjustable**: The ATR length/lookback (default 50) can be tweaked via inputs.
- **Visuals**: Green/lime lines for highs, red/orange for lows; a semi-transparent table for quick reference.
- **Limitations**: This is a probabilistic projection based on historical volatility and momentum—it doesn't predict direction with certainty and assumes volatility persists. It ignores external factors like news, earnings, or market regimes. Best used on daily charts for stocks/ETFs.
The indicator doesn't generate buy/sell signals but helps visualize "expected" ranges, similar to how implied volatility informs option pricing.
### How It Works Step-by-Step
The script executes on each bar update (typically daily timeframe) and follows this logic:
1. **Input Configuration**:
- ATR Length (Lookback): Default 50 bars. This controls both the ATR calculation period and the candle count window. You can adjust it in the indicator settings.
2. **Calculate Weekly ATR**:
- Fetches the ATR from the weekly timeframe using `request.security` with a length of 50 weeks.
- ATR measures average price range (high-low, adjusted for gaps), representing volatility.
3. **Derive Daily ATR**:
- Divides the weekly ATR by 5 (approximating 5 trading days per week) to get an equivalent daily volatility estimate.
- Example: If weekly ATR is $5, daily ATR ≈ $1.
4. **Define Projection Periods**:
- 1 Month: 21 trading days.
- 3 Months: 63 trading days (21 × 3).
- These are hardcoded but based on standard trading calendar assumptions.
5. **Compute Base Projections**:
- Base projection = Daily ATR × Days in period.
- This gives the total expected movement (range) without direction: e.g., for 3 months, $1 daily ATR × 63 = $63 total range.
6. **Analyze Candle Momentum (Win Rate)**:
- Counts green candles (close > open) and red candles (close < open) over the last 50 bars (ignores dojis where close == open).
- Total colored candles = green + red.
- Win rate = green / total colored (as a fraction, e.g., 0.7 for 70%). Defaults to 0.5 if no colored candles.
- This acts as a simple momentum proxy: higher win rate implies bullish bias.
7. **Adjust Projections Asymmetrically**:
- Upside projection = Base projection × Win rate.
- Downside projection = Base projection × (1 - Win rate).
- This skews the range: e.g., 70% win rate means 70% of the total range allocated to upside, 30% to downside.
8. **Calculate Projected Prices**:
- High = Current close + Upside projection.
- Low = Current close - Downside projection.
- Done separately for 1M and 3M.
9. **Plot Lines**:
- 3M High: Solid green line.
- 3M Low: Solid red line.
- 1M High: Dashed lime line.
- 1M Low: Dashed orange line.
- Lines extend horizontally from the current bar onward.
10. **Display Table**:
- A 3-column table (Projection, Price, % Change) in the top-right.
- Rows for 1M High/Low and 3M High/Low, color-coded.
- % Change = ((Projected price - Close) / Close) × 100.
- Updates dynamically with new data.
The entire process repeats on each new bar, so projections evolve as volatility and momentum change.
### Examples
Here are two hypothetical examples using the indicator on a daily chart. Assume it's applied to a stock like AAPL, but with made-up data for illustration. (In TradingView, you'd add the script to see real outputs.)
#### Example 1: Bullish Scenario (High Win Rate)
- Current Close: $150.
- Weekly ATR (50 periods): $10 → Daily ATR: $10 / 5 = $2.
- Last 50 Candles: 35 green, 15 red → Total colored: 50 → Win Rate: 35/50 = 0.7 (70%).
- Base Projections:
- 1M: $2 × 21 = $42.
- 3M: $2 × 63 = $126.
- Adjusted Projections:
- 1M Upside: $42 × 0.7 = $29.4 → High: $150 + $29.4 = $179.4 (+19.6%).
- 1M Downside: $42 × 0.3 = $12.6 → Low: $150 - $12.6 = $137.4 (-8.4%).
- 3M Upside: $126 × 0.7 = $88.2 → High: $150 + $88.2 = $238.2 (+58.8%).
- 3M Downside: $126 × 0.3 = $37.8 → Low: $150 - $37.8 = $112.2 (-25.2%).
- On the Chart: Green/lime lines skewed higher; table shows bullish % changes (e.g., +58.8% for 3M high).
- Interpretation: Suggests stronger potential upside due to recent bullish momentum; useful for call options or long positions.
#### Example 2: Bearish Scenario (Low Win Rate)
- Current Close: $50.
- Weekly ATR (50 periods): $3 → Daily ATR: $3 / 5 = $0.6.
- Last 50 Candles: 20 green, 30 red → Total colored: 50 → Win Rate: 20/50 = 0.4 (40%).
- Base Projections:
- 1M: $0.6 × 21 = $12.6.
- 3M: $0.6 × 63 = $37.8.
- Adjusted Projections:
- 1M Upside: $12.6 × 0.4 = $5.04 → High: $50 + $5.04 = $55.04 (+10.1%).
- 1M Downside: $12.6 × 0.6 = $7.56 → Low: $50 - $7.56 = $42.44 (-15.1%).
- 3M Upside: $37.8 × 0.4 = $15.12 → High: $50 + $15.12 = $65.12 (+30.2%).
- 3M Downside: $37.8 × 0.6 = $22.68 → Low: $50 - $22.68 = $27.32 (-45.4%).
- On the Chart: Red/orange lines skewed lower; table highlights larger downside % (e.g., -45.4% for 3M low).
- Interpretation: Indicates bearish risk; might prompt protective puts or short strategies.
#### Example 3: Neutral Scenario (Balanced Win Rate)
- Current Close: $100.
- Weekly ATR: $5 → Daily ATR: $1.
- Last 50 Candles: 25 green, 25 red → Win Rate: 0.5 (50%).
- Projections become symmetric:
- 1M: Base $21 → Upside/Downside $10.5 each → High $110.5 (+10.5%), Low $89.5 (-10.5%).
- 3M: Base $63 → Upside/Downside $31.5 each → High $131.5 (+31.5%), Low $68.5 (-31.5%).
- Interpretation: Pure volatility-based range, no directional bias—ideal for straddle options or range trading.
In real use, test on historical data: e.g., if past projections captured actual moves ~68% of the time (1 standard deviation for ATR), it validates the volatility assumption. Adjust the lookback for different assets (shorter for volatile cryptos, longer for stable blue-chips).

MA//@version=5
indicator("MA20 và EMA9", overlay=true)
// === Input tham số ===
lengthMA = input.int(20, "Độ dài MA", minval=1)
lengthEMA = input.int(9, "Độ dài EMA", minval=1)
// === Tính toán đường trung bình ===
ma20 = ta.sma(close, lengthMA) // Simple Moving Average 20
ema9 = ta.ema(close, lengthEMA) // Exponential Moving Average 9
// === Vẽ ra biểu đồ ===
plot(ma20, color=color.red, linewidth=2, title="MA20")
plot(ema9, color=color.blue, linewidth=2, title="EMA9")

Complexity v3.2Complex Trend Analyzer v6.1 v3.2
Advanced multi-indicator trend analysis with dynamic timeframe adaptation!
Overview:
This sophisticated indicator combines multiple technical analysis tools for comprehensive trend analysis. It features EMA crossovers, RSI momentum, MACD signals, Bollinger Bands, volume analysis, divergence detection, and multi-timeframe analysis with dynamic parameter adaptation based on market volatility.
Key Features:
✅ Multi-Indicator Analysis - EMA, RSI, MACD, Bollinger Bands, Volume, ATR
✅ Divergence Detection - Bullish and bearish divergence with strength calculation
✅ Dynamic Timeframe Adaptation - Parameters adjust automatically based on timeframe
✅ Trend Tracking - Complete trend lifecycle with BUY/SELL/END signals
✅ Multi-Timeframe Analysis - M5, M15, M30 trend comparison
✅ Risk Management - Volatility filtering and warning system
✅ Visual Clarity - Clean labels, trend lines, and information table
How It Works:
The indicator uses a weighted scoring system:
• EMA (2.0) - Primary trend direction
• RSI (1.5) - Momentum confirmation
• MACD (1.5) - Trend momentum
• Bollinger Bands (1.0) - Volatility context
• Volume (1.0) - Volume confirmation
• Price Action (0.5 each) - Higher highs/lows
Signal Logic:
• BUY - Weighted score > threshold + filters passed
• SELL - Weighted score > threshold + filters passed
• END - Trend reversal conditions met
Visual Elements:
• 🟢 BUY - Green label with trend tracking
• 🔴 SELL - Red label with trend tracking
• ⚫ END - Gray label marking trend end
• × BUY - Green crosses for bullish divergence
• × SELL - Red crosses for bearish divergence
• ⚠️ - Warning signals for trend reversals
Information Table:
Real-time display showing:
• ATR volatility with signal (HIGH/MED/LOW/NORMAL VOL)
• Divergence status with strength percentage
• BUY/SELL signal count and overall signal
• Multi-Timeframe analysis (M5, M15, M30)
• Current trend with strength percentage
• Detailed trend strength analysis
Dynamic Adaptation:
Parameters automatically adjust based on timeframe:
• M1 - Fastest reaction (1.5-7.5 bars)
• M3 - Quick response (2-10 bars)
• M5 - Standard setting (3-15 bars)
• M15 - Slower, more reliable (4-20 bars)
Settings:
• EMA - Fast (9), Slow (21), Trend (50)
• RSI - Length (14), Overbought (70), Oversold (30)
• MACD - Fast (12), Slow (26), Signal (9)
• Bollinger Bands - Length (20), Multiplier (2.0)
• ATR - Length (14) for volatility measurement
• Volume Threshold - 1.5x average volume
Best Practices:
🎯 Works best in trending markets
📊 Use as overlay on main chart
⚡ Combine with price action analysis
🛡️ Always use proper risk management
🔍 Watch for divergence signals
⚠️ Pay attention to warning signals
Pro Tips:
• Green background = Strong uptrend, Red background = Strong downtrend
• Orange background = Risk zone (high volatility/RSI extremes)
• × marks indicate divergence opportunities
• ⚠️ warnings signal potential trend reversals
• Use multi-timeframe analysis for confirmation
• Monitor the information table for comprehensive market view
Alerts:
• BUY Alert - "BUY signal detected"
• SELL Alert - "SELL signal detected"
• Divergence Alert - "Divergence detected"
• Warning Alert - "Trend warning"
Version 3.2 Improvements:
• Enhanced multi-indicator analysis
• Improved divergence detection with strength calculation
• Advanced dynamic timeframe adaptation
• Comprehensive risk management system
• Professional visual presentation
• Weighted scoring system for better accuracy
Created with ❤️ for the trading community
This indicator is free to use for both commercial and non-commercial purposes.

Multiplied and Divided Moving Average ### Multiplied and Divided Moving Average Indicator
**Description**:
The "Multiplied and Divided Moving Average" indicator is a customizable tool for TradingView users, designed to create dynamic bands around a user-selected moving average (MA). It calculates a moving average (SMA, EMA, WMA, VWMA, or RMA) and generates a user-defined number of lines above and below it by multiplying and dividing the MA by linearly spaced factors. These bands serve as potential support and resistance levels, aiding in trend identification, mean reversion strategies, or breakout detection. Optional Buy/Sell labels appear when the price crosses below the divided MAs (Buy) or above the multiplied MAs (Sell), providing clear visual cues for trading opportunities.
**Key Features**:
- **Flexible MA Types**: Choose from Simple (SMA), Exponential (EMA), Weighted (WMA), Volume-Weighted (VWMA), or Running (RMA) moving averages.
- **Customizable Bands**: Set the number of lines (0–10) above and below the MA, allowing tailored analysis for any market or timeframe.
- **Dynamic Factors**: Bands are created using factors that scale linearly from 1 to a user-defined maximum (default: 5.0), creating intuitive overbought/oversold zones.
- **Buy/Sell Signals**: Optional labels highlight potential entry (Buy) and exit (Sell) points when the price crosses the bands.
- **Clear Visuals**: The main MA is plotted in blue, with green (multiplied) and red (divided) lines using graduated transparency for easy differentiation.
**Inputs**:
- **MA Type**: Select the moving average type (default: SMA).
- **MA Length**: Set the MA period (default: 14).
- **Number of Lines Above/Below**: Choose how many bands to plot above and below the MA (default: 4, range: 0–10).
- **Max Factor**: Define the largest multiplier/divisor for the outermost bands (default: 5.0).
- **Source**: Select the price data for the MA (default: close).
- **Show Buy/Sell Labels**: Enable or disable Buy/Sell labels (default: true).
**How It Works**:
1. Calculates the chosen moving average based on user inputs.
2. Creates up to 10 lines above the MA (e.g., MA × 2, ×3, ×4, ×5 for `numLines=4`, `maxFactor=5`) and 10 below (e.g., MA ÷ 2, ÷3, ÷4, ÷5).
3. Plots the main MA in blue, multiplied lines in green, and divided lines in red, with transparency increasing for outer bands.
4. If enabled, displays "Buy" labels when the price crosses below any divided MA and "Sell" labels when it crosses above any multiplied MA, positioned at the outermost band.
**Use Cases**:
- **Trend Analysis**: Use the bands as dynamic support/resistance to confirm trend direction or reversals.
- **Mean Reversion**: Identify overbought (near multiplied MAs) or oversold (near divided MAs) conditions.
- **Breakout Trading**: Monitor price crossovers of the outermost bands for potential breakout signals.
- **Signal Confirmation**: Use Buy/Sell labels for swing trading or to complement other indicators.
**How to Use**:
1. Copy the script into TradingView’s Pine Editor.
2. Compile and apply it to your chart (e.g., stocks, forex, crypto).
3. Adjust inputs like `numLines`, `maxFactor`, or `maType` to fit your strategy.
4. Enable `Show Buy/Sell Labels` to visualize trading signals.
5. Test on various timeframes (e.g., 1H, 4H, 1D) and assets to optimize settings.
**Example Settings**:
- **Swing Trading**: Use `numLines=3`, `maxFactor=4`, `maType=EMA`, `maLength=20` on a 4-hour chart.
- **Intraday**: Try `numLines=2`, `maxFactor=3`, `maType=SMA`, `maLength=10` on a 15-minute chart.
**Notes**:
- **Performance**: Supports up to 20 bands (10 above, 10 below), staying within TradingView’s 64-plot limit.
- **False Signals**: In choppy markets, frequent crossovers may occur. Combine with trend filters (e.g., ADX, higher-timeframe MA) to reduce noise.
- **Enhancements**: Add alerts via TradingView’s alert system for Buy/Sell signals, or experiment with different `maxFactor` values for volatility.
**Limitations**:
- Bands are reactive, as they’re based on a moving average, so confirm signals with other indicators.
- High `numLines` values may clutter the chart; use 2–4 for clarity.
- Signals may lag in fast-moving markets due to the MA’s smoothing effect.
This indicator is perfect for traders seeking a customizable, visually clear tool to enhance technical analysis on TradingView. For support, feature requests (e.g., alerts, custom colors), or community discussion, visit TradingView’s forums or contact the script author.

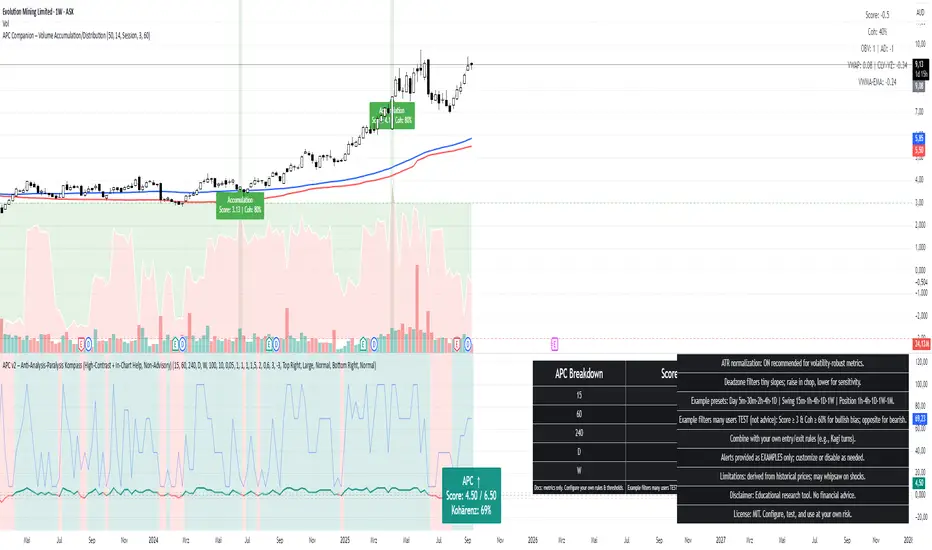
APC Companion – Volume Accumulation/DistributionIndicator Description (TradingView – Open Source)
APC Companion – Volume Accumulation/Distribution Filter
(Designed to work standalone or together with the APC Compass)
What this indicator does
The APC Companion measures whether markets are under Accumulation (buying pressure) or Distribution (selling pressure) by combining:
Chaikin A/D slope – volume flow into price moves
On-Balance Volume momentum – confirms trend strength
VWAP spread – price vs. fair value by traded volume
CLV × Volume Z-Score – detects intrabar absorption / selling pressure
VWMA vs. EMA100 – confirms whether weighted volume supports price action
The result is a single Acc/Dist Score (−5 … +5) and a Coherence % showing how many signals agree.
How to interpret
Score ≥ +3 & Coherence ≥ 60% → Accumulation (green) → market supported by buyers
Score ≤ −3 & Coherence ≥ 60% → Distribution (red) → market pressured by sellers
Anything in between = neutral (no strong bias)
Using with APC Compass
Long trades: Only take Compass Long signals when Companion shows Accumulation.
Short trades: Only take Compass Short signals when Companion shows Distribution.
Neutral Companion: Skip or reduce size if there is no confirmation.
This filter greatly reduces false signals and improves trade quality.
Best practice
Swing trading: 4H / 1D charts, lenZ 40–80, lenSlope 14–20
Intraday: 5m–30m charts, lenZ 20–30, lenSlope 10–14
Position sizing: Increase with higher Coherence %, reduce when below 60%
Exits: Reduce or close if Score drops back to neutral or flips opposite
Disclaimer
This script is published open source for educational purposes only.
It is not financial advice. Test thoroughly before using in live trading.
Universal MA Playground🔥 Universal MA Playground — Test Any Moving Average Combo With Style
Experiment with 14 moving average types, crossovers, and themes in one flexible indicator
What it is
A universal moving average playground with 14 MA types, customizable auto/manual lengths, and multiple color themes.
It highlights crossovers with glowing lines, background tint, and theme-based styling. Intended as a flexible exploration tool, not a standalone trading system.
Why combine multiple MAs?
Each moving average has unique strengths:
EMA (Exponential) → reacts faster to price changes.
SMA (Simple) → smooth, classic trend measure.
HMA (Hull) → reduces lag, sharper turns.
TEMA/DEMA → smoother than EMA, responsive to reversals.
ALMA, McGinley, LSMA → adaptive, less noisy.
VWAP & Rolling VWAP → volume-weighted trend with session or rolling lookback.
By testing crossovers between any two types, traders can see where different smoothing methods align, helping filter weak or lagging signals.
How it works
MA1 & MA2: Choose any type (SMA, EMA, HMA, VWAP, etc.).
Lengths: Each MA defaults to its standard (e.g. EMA=21, SMA=20, HMA=21). Manual override option available.
Visuals:
Lines change color by theme.
Fill between MAs highlights when MA1 > MA2 (bull) or MA1 < MA2 (bear).
Optional background glow reinforces bias.
Themes: Classic, Neon, Dark Glow, Ice & Fire, Minimalist, Cyberpunk, Nature.
What’s original here
Full library of 14 MA types in one script.
Auto-length detection with manual override toggle.
Theme engine for line, fill, and glow styles.
VWAP handling: true session VWAP intraday, fallback VWMA on higher timeframes.
Clean visual crossover highlights without extra clutter.
Inputs & settings
MA Types: SMA, EMA, WMA, VWMA, RMA, DEMA, TEMA, T3, HMA, ALMA, McGinley, LSMA, VWAP, Rolling VWAP.
Lengths: Auto (standard defaults) or manual override.
Theme selector: 7 presets.
Background glow: ON/OFF.
How to read
Two selected MAs are plotted.
Fill between them shows bias (green for MA1 above, red for MA1 below).
Triangle markers show crossover points.
Background glow (optional) highlights overall state.
Suggested use
Test different MA pairs (e.g. EMA21 vs HMA50, VWAP vs SMA20).
Use as trend confirmation or visual exploration, not a standalone system.
Works on all timeframes; useful both intraday and swing.
Limitations
VWAP only works intraday; on higher TF it falls back to VWMA(20).
Not a trading system by itself. Use with structure, risk management, and confluence.
Signals may lag in sideways markets.
Credits
Standard MAs are public domain (SMA, EMA, HMA, VWAP, etc.).
Universal combination, auto/manual logic, and theme design: NICK789.
Disclaimer
Educational use only; not financial advice.
No guarantees of accuracy or profitability.
Markets involve risk; past performance does not guarantee results.

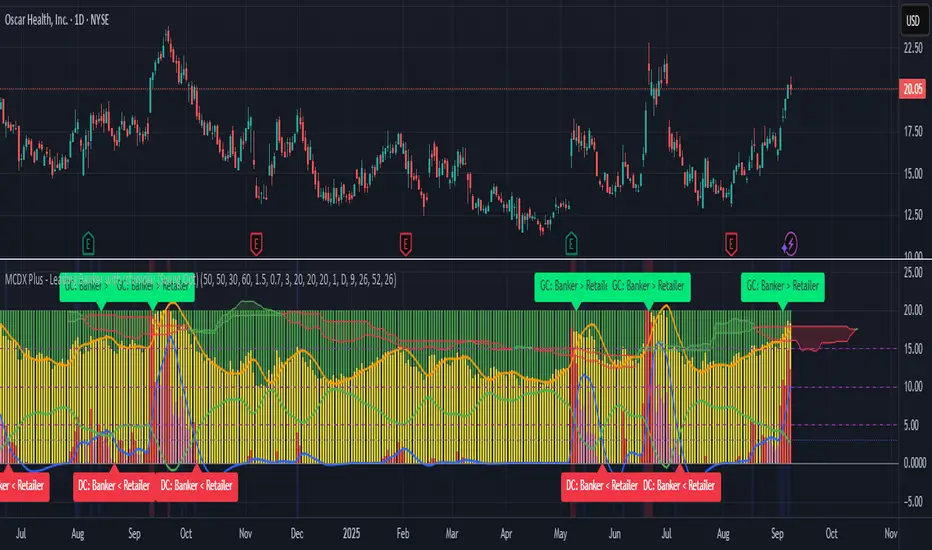
MCDX Plus - Leading Banker with Ichimoku (Swing Opt)Understanding the Indicator
Components:
Green Bars (Retailer): Inverse on top (stacked from 20 downward), represent retail momentum. High values (>15) with a lime background signal retail dominance—often a sell or avoid zone.
Yellow Bars (Hot Money): Middle layer, indicate speculative momentum. Useful as a secondary confirmation.
Red/Fuchsia Bars (Banker): Bottom layer, show institutional (banker/hedge fund) momentum. Red when RSI_Banker ≥ BankerMA, fuchsia otherwise. Crossings above 5, 10, 15 are key buy signals.
Blue Line (Banker MA): Hull Moving Average (HMA) of Banker RSI, tracks institutional trend with minimal lag.
Orange Line (Hot Money MA): HMA of Hot Money RSI.
Green Line (Retailer MA): HMA of Retailer RSI.
Reference Lines: 0 (base), 5 (25% Banker Entry), 10 (50% Banker Building), 15 (75% Banker Control), buildThreshold (2.0 for early signals).
Backgrounds: Red (RSI_Banker > 15, strong buy), Lime (RSI_Retailer > 15, sell/avoid), Blue (earlyBuildSignal, potential entry).
Precision Features:
HMAs reduce lag for faster cross signals.
Shortened MA periods (default 8) align with quick price moves.
PriceEMA (50-period) filters entries/exits with trend confirmation.
Pro-Level Usage Strategy
1. Master Entry Timing
Signal: Look for a Golden Cross (Banker MA crosses above Retailer MA or Hot Money MA) + red bars >5 + price > priceEMA (50-period EMA of close) + blue background (earlyBuildSignal).
Why It Works: The HMA’s low lag catches early institutional buying (red bars rising), while price > priceEMA confirms an uptrend. The blue background (RSI_Banker > 2, positive ROC, volume > volMA) flags pre-breakout accumulation.
Pro Action:
Enter a small position on the Golden Cross with blue background.
Add to the position as red bars hit 10, confirmed by volume spikes (volume > volMA).
Set a stop-loss 2-3% below the recent low or the 20-period price EMA.
Target a take-profit at 10-15% or when red bars approach 15.
2. Nail Exit Timing
Signal: Look for a Dead Cross (Banker MA crosses below Retailer MA or Hot Money MA) + green bars >15 + price < priceEMA + lime background.
Why It Works: The HMA’s precision flags waning institutional interest (red bars falling), while green bars >15 and a lime background indicate retail overextension—a classic reversal point. Price < priceEMA confirms a downtrend.
Pro Action:
Exit partial profits on the Dead Cross if red bars drop below 10.
Full exit when green bars >15 and lime background appear, with a stop-loss moved to break-even.
Target a re-entry on the next Golden Cross if red bars recover.
3. Use Cross Signals as Triggers
Golden Cross (Buy): Banker MA > Retailer MA or Hot Money MA. Confirm with red bars >5 and price > priceEMA.
Dead Cross (Sell/Avoid): Banker MA < Retailer MA or Hot Money MA. Confirm with green bars >15 and price < priceEMA.
Pro Action:
Set TradingView alerts for these conditions (e.g., "GC: Banker > Retailer MA and Price > EMA50" for buy).
Use multiple timeframes (e.g., 1H for entry, 4H for exit) to filter noise.
Combine with candlestick patterns (e.g., bullish engulfing for entry) for confirmation.
4. Leverage Backgrounds for Momentum
Red Background (RSI_Banker > 15): Strong institutional control—hold or add to longs.
Lime Background (RSI_Retailer > 15): Retail dominance—exit or short (if your broker allows).
Blue Background (earlyBuildSignal): Early banker accumulation—prepare for entry, watch for Golden Cross.
Pro Action:
Scale into trades during red zones, scale out in lime zones.
Use blue zones to anticipate breakouts, entering only after cross confirmation.
5. Optimize with Volume and Price
Volume Confirmation: Enter only when volume > volMA (10-period SMA) during Golden Cross or red bar rises.
Price Action: Align entries with support/resistance breaks, exits with trendline breaks.
Pro Action:
Add a volume oscillator (e.g., OBV) to your chart to confirm spikes.
Use Fibonacci retracement (e.g., 50% level) with MCDX signals for precise targets.
6. Pro Risk Management
Position Sizing: Risk 1-2% of capital per trade, adjusting based on red bar height (e.g., larger size at 15).
Stop-Loss: Dynamic—below recent low for entries, above recent high for exits, or trailing 2% below price EMA.
Take-Profit: Scale out at 5-10-15 red bar levels or key price targets (e.g., 20% gain).
Risk-Reward: Aim for 1:3 or better, validated by backtesting.
Ichimoku Cloud
What It Does: Combines five lines—Tenkan-sen (conversion line), Kijun-sen (base line), Senkou Span A/B (cloud edges), and Chikou Span (lagging span)—to provide trend direction, support/resistance, and momentum. The cloud (area between Span A and B) acts as a dynamic zone to filter trades.
Benefits for MCDX Plus:
Trend Confirmation: Entry is stronger when a Golden Cross (Banker MA > Retailer MA) occurs above the cloud (bullish), or exit on Dead Cross below the cloud (bearish). This aligns with priceEMA (50-period) filtering.
Support/Resistance: The cloud’s edges (e.g., Senkou Span B) can act as profit targets or stop-loss levels, enhancing precision on CleanSpark’s sharp moves.
Leading Edge: The Tenkan-sen (default 9-period) and Kijun-sen (default 26-period) cross can signal momentum shifts before MCDX crosses, complementing the blue earlyBuildSignal.
Visual Clarity: Adds a contextual layer to your chart, making it easier to see if red bars >5 align with a bullish cloud breakout.
Drawbacks:
Complexity: Requires learning (e.g., cloud thickness indicates strength), which might clutter your workflow if you’re focused solely on red bars.
Lag in Volatile Markets: The cloud’s 26-period base can lag in fast reversals
Best For: Swing traders or those wanting a holistic trend filter. Backtests on similar scripts (e.g., Smart Money Flow Pro + Ichimoku) show 70-80% accuracy when cloud aligns with MCDX signals.
Bank Strategy v1 Pro # Bank Strategy v1 Pro - Advanced Institutional Trading System
## Overview
Bank Strategy v1 Pro is a sophisticated institutional-grade trading indicator designed for professional traders who understand advanced market microstructure concepts. This system implements the precise methodologies used by institutional traders to identify high-probability reversal opportunities through liquidity manipulation patterns.
## Core Methodology
### 🏦 **Institutional Trading Framework**
This strategy is built upon the fundamental principle that institutional players (banks, hedge funds, market makers) create specific patterns when accumulating or distributing positions. The indicator identifies these patterns through:
- **Liquidity Manipulation Sequences** - Detection of deliberate stop-loss hunting
- **False Move (FU) Patterns** - Identification of engineered price movements
- **Order Block Analysis** - Recognition of institutional accumulation/distribution zones
- **Imbalance Trading** - Exploitation of price inefficiencies
- **Market Structure Context** - Trend-based signal filtering
### 📊 **Advanced Signal Components**
#### 1. **Liquidity Zone Identification**
- Automated detection of swing highs/lows where retail stops accumulate
- Dynamic liquidity level tracking with 30-bar extension
- Real-time monitoring of liquidity sweeps and hunts
#### 2. **False Move (FU) Pattern Recognition**
- **Bullish FU**: High manipulation → Close below previous low (bearish trap)
- **Bearish FU**: Low manipulation → Close above previous high (bullish trap)
- Institutional reversal confirmation after liquidity grab
#### 3. **Order Block Detection**
- Bullish Engulfing: Strong institutional buying after bearish candle
- Bearish Engulfing: Strong institutional selling after bullish candle
- 20-bar forward projection for order block validity
#### 4. **Price Imbalance Analysis**
- Bullish Imbalance: Gap up indicating buying pressure
- Bearish Imbalance: Gap down indicating selling pressure
- 15-bar tracking with automatic labeling
## Signal Generation Logic
### 🎯 **Entry Criteria**
**Buy Signal Requirements:**
- Bearish FU pattern detected (liquidity grab below previous low)
- Price above 200 SMA (bullish market context)
- Liquidity lows available for targeting
- Signal confirmation enabled
**Sell Signal Requirements:**
- Bullish FU pattern detected (liquidity grab above previous high)
- Price below 200 SMA (bearish market context)
- Liquidity highs available for targeting
- Signal confirmation enabled
### 📈 **Advanced Entry Management**
- **Entry Level**: 50% retracement of manipulation candle body
- **Stop Loss**: 20% extension below/above manipulation range
- **Take Profit**: Configurable risk-reward ratio (1:1 to 1:5)
- **Timeout**: 15-bar automatic signal expiry
## Professional Features
### 🔧 **Customizable Parameters**
- **Signal Control**: Independent buy/sell signal toggles
- **Visual Elements**: Modular display of order blocks, imbalances, liquidity zones
- **Risk Management**: Adjustable risk-reward ratios up to 1:5
- **Market Structure**: Configurable swing length (3-20 periods)
- **MA Filter**: Optional 200 SMA trend context
### 📊 **Real-Time Status Monitoring**
Professional status table displaying:
- Current market trend direction
- Liquidity availability status
- Active entry waiting status
- Risk-reward configuration
- System health indicators
### 🚨 **Professional Alert System**
- **Signal Alerts**: Instant notification of buy/sell opportunities
- **Entry Alerts**: Confirmation when entry levels are reached
- **Custom Messages**: Detailed alert descriptions for trade management
## Advanced Visual Analysis
### 🎨 **Color-Coded Elements**
- **Green Boxes**: Bullish order blocks (institutional buying zones)
- **Red Boxes**: Bearish order blocks (institutional selling zones)
- **Blue/Orange Boxes**: Price imbalances requiring fill
- **Purple Boxes**: FU patterns with directional labels
- **Dotted Lines**: Key liquidity levels with labels
- **Yellow Lines**: Pending entry levels
### 📍 **Professional Labeling**
- Clear identification of all pattern types
- Directional bias indicators
- Entry confirmation markers
- Liquidity level annotations
## Risk Management Framework
### ⚠️ **Professional Trading Guidelines**
- **Timeframe Recommendation**: 4H+ for institutional signal reliability
- **Position Sizing**: Risk no more than 1-2% per signal
- **Confirmation**: Wait for entry level hits before position entry
- **Context**: Always consider overall market structure and sentiment
### 🛡️ **Built-in Protections**
- Automatic signal timeout prevents stale entries
- Trend context filtering reduces counter-trend risks
- Liquidity requirement ensures sufficient market depth
- Risk-reward enforcement maintains positive expectancy
## Performance Optimization
### ⚡ **Technical Specifications**
- **Pine Script v5**: Latest version compatibility
- **Resource Limits**: Optimized for 500 bars, 200 lines, 100 boxes, 200 labels
- **Processing**: Efficient array management for liquidity tracking
- **Memory**: Automatic cleanup of expired signals and objects
### 🎯 **Signal Quality**
- High-probability setups through multi-factor confirmation
- Institutional pattern recognition reduces retail noise
- Trend context filtering improves win rate
- Professional entry timing reduces slippage
## Educational Framework
### 📚 **Institutional Concepts**
This indicator teaches professional trading concepts:
- Market microstructure understanding
- Institutional order flow analysis
- Liquidity-based trading strategies
- Professional risk management techniques
### 🎓 **Skill Development**
- Pattern recognition training
- Market structure analysis
- Trade timing optimization
- Risk management discipline
## Disclaimer
This indicator is designed for professional traders with experience in institutional trading concepts. It requires understanding of market microstructure, liquidity dynamics, and professional risk management. Past performance does not guarantee future results. Always implement proper risk management and consider multiple analysis factors before making trading decisions.
## Compatibility
- **Markets**: Forex, Indices, Cryptocurrencies, Commodities
- **Timeframes**: Optimized for 1H and above (4H+ recommended)
- **Platform**: TradingView Pine Script v5
- **Features**: Full alert integration, customizable display options

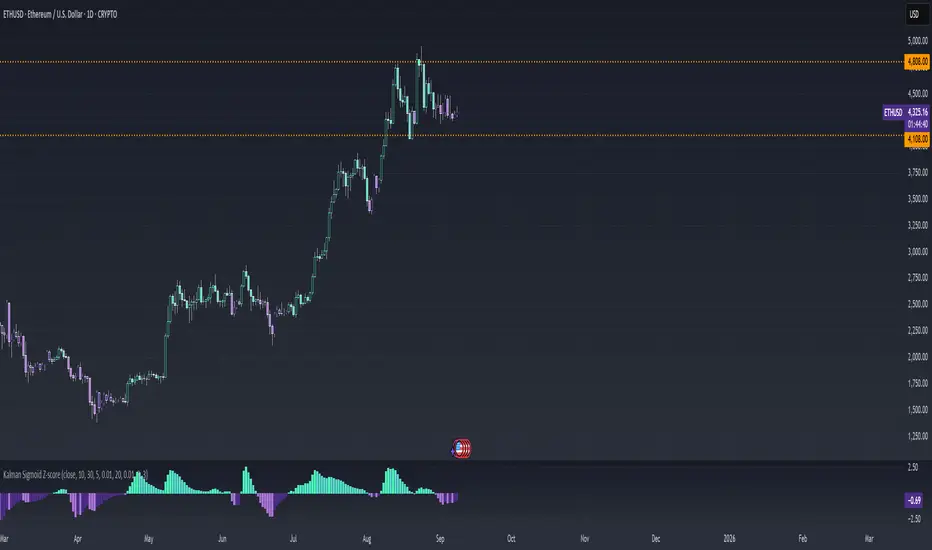
Kalman Sigmoid Z-score | SurgeQuantTitle: Kalman Sigmoid Z-score Indicator
The Kalman Sigmoid Z-score indicator is a sophisticated tool designed to identify market momentum and potential trend changes using a combination of Kalman filtering, sigmoid-weighted averaging, and Z-score calculations. By processing price data through a Kalman filter and applying adaptive sigmoid weighting, this indicator provides clear visual signals for bullish and bearish market conditions. The Z-score output and price bars are dynamically colored to highlight momentum shifts, aiding traders in identifying potential trading opportunities.
How It Works
Kalman Filter Calculation
Computes a smoothed price series using a Kalman filter based on a user-selected price source (Close, High, Low, or Open) with configurable parameters for process noise, measurement noise, and filter order (default: 3).
The Kalman filter reduces noise in the price data, providing a stable foundation for further analysis.
Sigmoid-Weighted Averaging
Applies a sigmoid function to calculate adaptive weights based on price comparisons over a user-defined lookback period (default: 10).
Weights are adjusted dynamically using a volatility ratio (standard deviation over ATR) to account for market conditions, enhancing signal reliability.
Z-score Calculation
Calculates the Z-score of the Kalman-filtered price relative to a sigmoid-weighted moving average over a user-defined period (default: 20).
Bullish Signal: Triggered when the Z-score crosses above 0, indicating potential upward momentum.
Bearish Signal: Triggered when the Z-score crosses below 0, indicating potential downward momentum.
Visual Representation
The indicator provides a clear and customizable visual interface:
Z-score Histogram: Displayed as colored columns, with distinct colors for bullish (Z-score > 0) and bearish (Z-score < 0) conditions.
Bright green (#4DFFBE) for rising Z-score above 0.
Light green (#56DFCF) for falling Z-score above 0.
Dark purple (#AE75DA) for falling Z-score below 0.
Light purple (#4D2D8C) for rising Z-score below 0.
Price Bar Coloring: Synchronizes with the Z-score colors to reflect momentum on the main chart.
Reference Line: A zero line is plotted on the Z-score panel for easy reference.
Customization & Parameters
The Kalman Sigmoid Z-score indicator offers flexible parameters to suit various trading styles:
Source: Select the input price (default: Close; options: Close, High, Low, Open).
Lookback Period: Set the period for sigmoid weight calculations (default: 10).
Volatility Period: Adjust the period for volatility ratio calculation (default: 30).
Base Steepness: Control the sigmoid function’s sensitivity (default: 5).
Base Midpoint: Set the sigmoid function’s midpoint (default: 0.01).
Z-score Period: Define the period for Z-score calculation (default: 20).
Kalman Parameters:
Process Noise (default: 0.01).
Measurement Noise (default: 3).
Filter Order (default: 3).
Color Settings: Predefined colors with distinct shades for bullish and bearish states, ensuring clear visual differentiation.
Trading Applications
This indicator is versatile and can be applied across various markets and strategies:
Momentum Trading: Highlights strong bullish or bearish momentum for potential entry or exit points based on Z-score crossings.
Trend Confirmation: Use bar coloring to confirm Z-score signals with price action on the main chart.
Reversal Detection: Identify potential reversals when the Z-score crosses the zero line.
Scalping and Swing Trading: Adjust parameters (e.g., lookback, Z-score period) to suit short-term or longer-term strategies.
Final Note
The Kalman Sigmoid Z-score indicator is a powerful tool for traders seeking to leverage advanced filtering and statistical analysis for momentum and trend-based opportunities. Its combination of Kalman-filtered price smoothing, sigmoid-weighted averaging, dynamic Z-score signals, and synchronized bar coloring offers a robust framework for informed trading decisions. As with all indicators, backtest thoroughly and integrate into a comprehensive trading strategy for optimal results. This indicator is provided for educational and informational purposes and should not be considered financial advice.
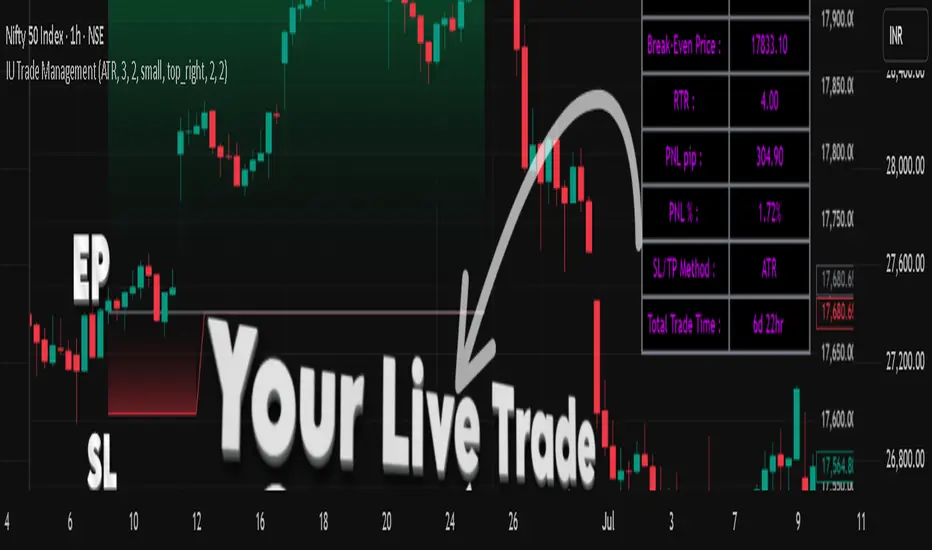
IU Trade ManagementDESCRIPTION
IU Trade Management is a powerful utility tool designed to help traders manage their trades with precision and clarity. It provides automated Stop Loss, Take Profit, and Break Even calculations using multiple customizable methods. Along with clear SL/TP plotting on the chart, it also displays a detailed trade status table that tracks every important detail including entry price, SL/TP levels, break-even, PNL, and trade duration. This tool is perfect for traders who want to manage risk and rewards visually and systematically.
USER INPUTS :
-Entry Candle Time: Default 20 Jul 2021 00:00 +0300 (select the candle from which the trade begins)
- Entry Price: Default 2333 (define the price at which the trade is executed)
- Trade Direction: Default Long (choose between Long or Short)
- SL/TP Method: Default ATR (options: ATR, Points/Pips, Percentage %, Standard Deviation, Highest/Lowest, Previous High/Low)
- Risk to Reward: Default 3 (set custom risk-to-reward ratio)
- Use Break Even: Default false (option to enable break-even)
- Plot Break Even Line: Default false (option to display BE line)
- RTR of Break Even Point: Default 2 (factor used for BE calculation)
SL/TP Method Specific Inputs:
- ATR Length: Default 14
- ATR Factor: Default 2
- Points/Pips: Default 100
- Percentage: Default 1%
- Standard Deviation Length: Default 20
- Standard Deviation Factor: Default 2
- Highest/Lowest Length: Default 10
Trade Status Table Settings:
- Show Trade Status: Default true
- Table Size: Default small (options: normal, tiny, small, large)
- Table Position: Default top right
- Frame Width: Default 2
- Table Color: Default black
- Frame Color: Default gray
- Border Width: Default 2
- Border Color: Default gray
- Text Color: Default purple (RGB 212, 0, 255)
HOW TO USE THE INDICATOR:
1. Set the entry candle time and entry price manually.
2. Select whether the trade is Long or Short.
3. Choose the preferred SL/TP calculation method (ATR, Percentage, Points, STD, High/Low, Previous High/Low).
4. Define your risk-to-reward ratio and enable break-even if required.
5. The indicator will automatically plot your Entry, Stop Loss, Take Profit, and Break Even levels on the chart.
6. A detailed trade management table will appear, showing trade direction, SL, TP, PNL (points and %), SL/TP method, and total trade time.
WHY IT IS UNIQUE:
- Offers multiple methods to calculate SL and TP (ATR, Percentage, Points, Standard Deviation, High/Low, Previous High/Low)
- Built-in Break Even functionality for risk-free trade management
- Real-time PNL tracking in both points and percentage
- Trade status table for complete transparency on all trade details
- Visual plotting of SL, TP, and Entry with color-coded zones for clarity
HOW USER CAN BENEFIT FROM IT :
- Helps traders manage risk and reward with discipline
- Eliminates guesswork by automating SL and TP levels
- Provides clear visual guidance on trade exits and risk management
- Enhances decision-making with live trade tracking and performance statistics
- Suitable for manual traders as a trade manager and for strategy developers as a risk management reference
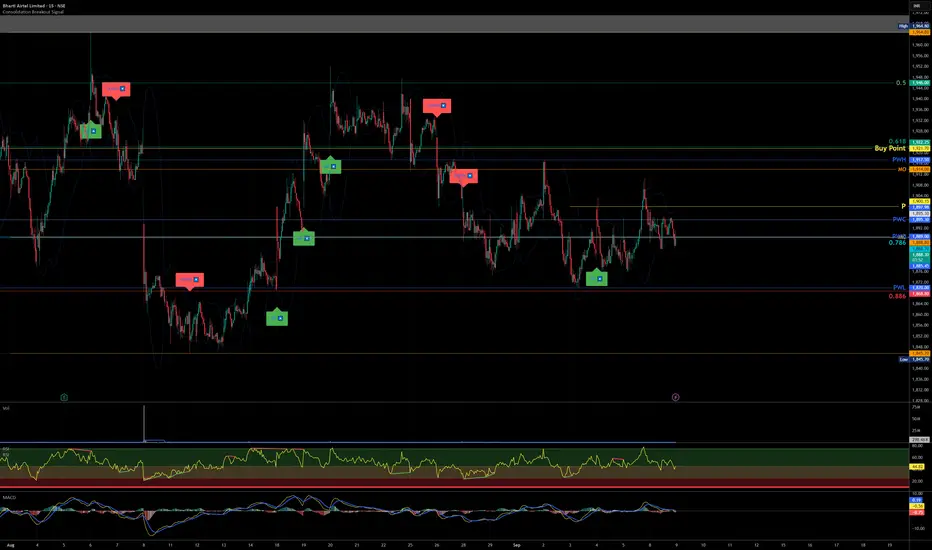
Consolidation Breakout Signal//@version=5
indicator("Consolidation Breakout Signal", overlay=true, timeframe="")
// Inputs
length = input.int(20, "Consolidation Lookback")
atrMult = input.float(1.5, "ATR Breakout Multiplier")
bbLength = input.int(20, "Bollinger Band Length")
bbMult = input.float(2.0, "Bollinger Band Width Multiplier")
// ATR for volatility
atr = ta.atr(length)
// Bollinger Bands for consolidation
basis = ta.sma(close, bbLength)
dev = bbMult * ta.stdev(close, bbLength)
upperBB = basis + dev
lowerBB = basis - dev
bbWidth = (upperBB - lowerBB) / basis * 100
// Define consolidation as narrow BB width
consolidation = bbWidth < ta.sma(bbWidth, length)
// Breakout conditions
breakUp = consolidation and close > upperBB and close > close + atrMult * atr
breakDown = consolidation and close < lowerBB and close < close - atrMult * atr
// Plot Bollinger Bands
plot(upperBB, "Upper BB", color=color.new(color.blue, 70))
plot(lowerBB, "Lower BB", color=color.new(color.blue, 70))
// Plot signals
plotshape(breakUp, title="Breakout Up", style=shape.labelup, color=color.green, text="UP 🔼", size=size.large, location=location.belowbar)
plotshape(breakDown, title="Breakout Down", style=shape.labeldown, color=color.red, text="DOWN 🔽", size=size.large, location=location.abovebar)
// Alerts
alertcondition(breakUp, title="Breakout Up Alert", message="Big Up Move Likely 🚀")
alertcondition(breakDown, title="Breakout Down Alert", message="Big Down Move Likely 📉")
ATAI Volume analysis with price action V 1.00ATAI Volume Analysis with Price Action
1. Introduction
1.1 Overview
ATAI Volume Analysis with Price Action is a composite indicator designed for TradingView. It combines per‑side volume data —that is, how much buying and selling occurs during each bar—with standard price‑structure elements such as swings, trend lines and support/resistance. By blending these elements the script aims to help a trader understand which side is in control, whether a breakout is genuine, when markets are potentially exhausted and where liquidity providers might be active.
The indicator is built around TradingView’s up/down volume feed accessed via the TradingView/ta/10 library. The following excerpt from the script illustrates how this feed is configured:
import TradingView/ta/10 as tvta
// Determine lower timeframe string based on user choice and chart resolution
string lower_tf_breakout = use_custom_tf_input ? custom_tf_input :
timeframe.isseconds ? "1S" :
timeframe.isintraday ? "1" :
timeframe.isdaily ? "5" : "60"
// Request up/down volume (both positive)
= tvta.requestUpAndDownVolume(lower_tf_breakout)
Lower‑timeframe selection. If you do not specify a custom lower timeframe, the script chooses a default based on your chart resolution: 1 second for second charts, 1 minute for intraday charts, 5 minutes for daily charts and 60 minutes for anything longer. Smaller intervals provide a more precise view of buyer and seller flow but cover fewer bars. Larger intervals cover more history at the cost of granularity.
Tick vs. time bars. Many trading platforms offer a tick / intrabar calculation mode that updates an indicator on every trade rather than only on bar close. Turning on one‑tick calculation will give the most accurate split between buy and sell volume on the current bar, but it typically reduces the amount of historical data available. For the highest fidelity in live trading you can enable this mode; for studying longer histories you might prefer to disable it. When volume data is completely unavailable (some instruments and crypto pairs), all modules that rely on it will remain silent and only the price‑structure backbone will operate.
Figure caption, Each panel shows the indicator’s info table for a different volume sampling interval. In the left chart, the parentheses “(5)” beside the buy‑volume figure denote that the script is aggregating volume over five‑minute bars; the center chart uses “(1)” for one‑minute bars; and the right chart uses “(1T)” for a one‑tick interval. These notations tell you which lower timeframe is driving the volume calculations. Shorter intervals such as 1 minute or 1 tick provide finer detail on buyer and seller flow, but they cover fewer bars; longer intervals like five‑minute bars smooth the data and give more history.
Figure caption, The values in parentheses inside the info table come directly from the Breakout — Settings. The first row shows the custom lower-timeframe used for volume calculations (e.g., “(1)”, “(5)”, or “(1T)”)
2. Price‑Structure Backbone
Even without volume, the indicator draws structural features that underpin all other modules. These features are always on and serve as the reference levels for subsequent calculations.
2.1 What it draws
• Pivots: Swing highs and lows are detected using the pivot_left_input and pivot_right_input settings. A pivot high is identified when the high recorded pivot_right_input bars ago exceeds the highs of the preceding pivot_left_input bars and is also higher than (or equal to) the highs of the subsequent pivot_right_input bars; pivot lows follow the inverse logic. The indicator retains only a fixed number of such pivot points per side, as defined by point_count_input, discarding the oldest ones when the limit is exceeded.
• Trend lines: For each side, the indicator connects the earliest stored pivot and the most recent pivot (oldest high to newest high, and oldest low to newest low). When a new pivot is added or an old one drops out of the lookback window, the line’s endpoints—and therefore its slope—are recalculated accordingly.
• Horizontal support/resistance: The highest high and lowest low within the lookback window defined by length_input are plotted as horizontal dashed lines. These serve as short‑term support and resistance levels.
• Ranked labels: If showPivotLabels is enabled the indicator prints labels such as “HH1”, “HH2”, “LL1” and “LL2” near each pivot. The ranking is determined by comparing the price of each stored pivot: HH1 is the highest high, HH2 is the second highest, and so on; LL1 is the lowest low, LL2 is the second lowest. In the case of equal prices the newer pivot gets the better rank. Labels are offset from price using ½ × ATR × label_atr_multiplier, with the ATR length defined by label_atr_len_input. A dotted connector links each label to the candle’s wick.
2.2 Key settings
• length_input: Window length for finding the highest and lowest values and for determining trend line endpoints. A larger value considers more history and will generate longer trend lines and S/R levels.
• pivot_left_input, pivot_right_input: Strictness of swing confirmation. Higher values require more bars on either side to form a pivot; lower values create more pivots but may include minor swings.
• point_count_input: How many pivots are kept in memory on each side. When new pivots exceed this number the oldest ones are discarded.
• label_atr_len_input and label_atr_multiplier: Determine how far pivot labels are offset from the bar using ATR. Increasing the multiplier moves labels further away from price.
• Styling inputs for trend lines, horizontal lines and labels (color, width and line style).
Figure caption, The chart illustrates how the indicator’s price‑structure backbone operates. In this daily example, the script scans for bars where the high (or low) pivot_right_input bars back is higher (or lower) than the preceding pivot_left_input bars and higher or lower than the subsequent pivot_right_input bars; only those bars are marked as pivots.
These pivot points are stored and ranked: the highest high is labelled “HH1”, the second‑highest “HH2”, and so on, while lows are marked “LL1”, “LL2”, etc. Each label is offset from the price by half of an ATR‑based distance to keep the chart clear, and a dotted connector links the label to the actual candle.
The red diagonal line connects the earliest and latest stored high pivots, and the green line does the same for low pivots; when a new pivot is added or an old one drops out of the lookback window, the end‑points and slopes adjust accordingly. Dashed horizontal lines mark the highest high and lowest low within the current lookback window, providing visual support and resistance levels. Together, these elements form the structural backbone that other modules reference, even when volume data is unavailable.
3. Breakout Module
3.1 Concept
This module confirms that a price break beyond a recent high or low is supported by a genuine shift in buying or selling pressure. It requires price to clear the highest high (“HH1”) or lowest low (“LL1”) and, simultaneously, that the winning side shows a significant volume spike, dominance and ranking. Only when all volume and price conditions pass is a breakout labelled.
3.2 Inputs
• lookback_break_input : This controls the number of bars used to compute moving averages and percentiles for volume. A larger value smooths the averages and percentiles but makes the indicator respond more slowly.
• vol_mult_input : The “spike” multiplier; the current buy or sell volume must be at least this multiple of its moving average over the lookback window to qualify as a breakout.
• rank_threshold_input (0–100) : Defines a volume percentile cutoff: the current buyer/seller volume must be in the top (100−threshold)%(100−threshold)% of all volumes within the lookback window. For example, if set to 80, the current volume must be in the top 20 % of the lookback distribution.
• ratio_threshold_input (0–1) : Specifies the minimum share of total volume that the buyer (for a bullish breakout) or seller (for bearish) must hold on the current bar; the code also requires that the cumulative buyer volume over the lookback window exceeds the seller volume (and vice versa for bearish cases).
• use_custom_tf_input / custom_tf_input : When enabled, these inputs override the automatic choice of lower timeframe for up/down volume; otherwise the script selects a sensible default based on the chart’s timeframe.
• Label appearance settings : Separate options control the ATR-based offset length, offset multiplier, label size and colors for bullish and bearish breakout labels, as well as the connector style and width.
3.3 Detection logic
1. Data preparation : Retrieve per‑side volume from the lower timeframe and take absolute values. Build rolling arrays of the last lookback_break_input values to compute simple moving averages (SMAs), cumulative sums and percentile ranks for buy and sell volume.
2. Volume spike: A spike is flagged when the current buy (or, in the bearish case, sell) volume is at least vol_mult_input times its SMA over the lookback window.
3. Dominance test: The buyer’s (or seller’s) share of total volume on the current bar must meet or exceed ratio_threshold_input. In addition, the cumulative sum of buyer volume over the window must exceed the cumulative sum of seller volume for a bullish breakout (and vice versa for bearish). A separate requirement checks the sign of delta: for bullish breakouts delta_breakout must be non‑negative; for bearish breakouts it must be non‑positive.
4. Percentile rank: The current volume must fall within the top (100 – rank_threshold_input) percent of the lookback distribution—ensuring that the spike is unusually large relative to recent history.
5. Price test: For a bullish signal, the closing price must close above the highest pivot (HH1); for a bearish signal, the close must be below the lowest pivot (LL1).
6. Labeling: When all conditions above are satisfied, the indicator prints “Breakout ↑” above the bar (bullish) or “Breakout ↓” below the bar (bearish). Labels are offset using half of an ATR‑based distance and linked to the candle with a dotted connector.
Figure caption, (Breakout ↑ example) , On this daily chart, price pushes above the red trendline and the highest prior pivot (HH1). The indicator recognizes this as a valid breakout because the buyer‑side volume on the lower timeframe spikes above its recent moving average and buyers dominate the volume statistics over the lookback period; when combined with a close above HH1, this satisfies the breakout conditions. The “Breakout ↑” label appears above the candle, and the info table highlights that up‑volume is elevated relative to its 11‑bar average, buyer share exceeds the dominance threshold and money‑flow metrics support the move.
Figure caption, In this daily example, price breaks below the lowest pivot (LL1) and the lower green trendline. The indicator identifies this as a bearish breakout because sell‑side volume is sharply elevated—about twice its 11‑bar average—and sellers dominate both the bar and the lookback window. With the close falling below LL1, the script triggers a Breakout ↓ label and marks the corresponding row in the info table, which shows strong down volume, negative delta and a seller share comfortably above the dominance threshold.
4. Market Phase Module (Volume Only)
4.1 Concept
Not all markets trend; many cycle between periods of accumulation (buying pressure building up), distribution (selling pressure dominating) and neutral behavior. This module classifies the current bar into one of these phases without using ATR , relying solely on buyer and seller volume statistics. It looks at net flows, ratio changes and an OBV‑like cumulative line with dual‑reference (1‑ and 2‑bar) trends. The result is displayed both as on‑chart labels and in a dedicated row of the info table.
4.2 Inputs
• phase_period_len: Number of bars over which to compute sums and ratios for phase detection.
• phase_ratio_thresh : Minimum buyer share (for accumulation) or minimum seller share (for distribution, derived as 1 − phase_ratio_thresh) of the total volume.
• strict_mode: When enabled, both the 1‑bar and 2‑bar changes in each statistic must agree on the direction (strict confirmation); when disabled, only one of the two references needs to agree (looser confirmation).
• Color customisation for info table cells and label styling for accumulation and distribution phases, including ATR length, multiplier, label size, colors and connector styles.
• show_phase_module: Toggles the entire phase detection subsystem.
• show_phase_labels: Controls whether on‑chart labels are drawn when accumulation or distribution is detected.
4.3 Detection logic
The module computes three families of statistics over the volume window defined by phase_period_len:
1. Net sum (buyers minus sellers): net_sum_phase = Σ(buy) − Σ(sell). A positive value indicates a predominance of buyers. The code also computes the differences between the current value and the values 1 and 2 bars ago (d_net_1, d_net_2) to derive up/down trends.
2. Buyer ratio: The instantaneous ratio TF_buy_breakout / TF_tot_breakout and the window ratio Σ(buy) / Σ(total). The current ratio must exceed phase_ratio_thresh for accumulation or fall below 1 − phase_ratio_thresh for distribution. The first and second differences of the window ratio (d_ratio_1, d_ratio_2) determine trend direction.
3. OBV‑like cumulative net flow: An on‑balance volume analogue obv_net_phase increments by TF_buy_breakout − TF_sell_breakout each bar. Its differences over the last 1 and 2 bars (d_obv_1, d_obv_2) provide trend clues.
The algorithm then combines these signals:
• For strict mode , accumulation requires: (a) current ratio ≥ threshold, (b) cumulative ratio ≥ threshold, (c) both ratio differences ≥ 0, (d) net sum differences ≥ 0, and (e) OBV differences ≥ 0. Distribution is the mirror case.
• For loose mode , it relaxes the directional tests: either the 1‑ or the 2‑bar difference needs to agree in each category.
If all conditions for accumulation are satisfied, the phase is labelled “Accumulation” ; if all conditions for distribution are satisfied, it’s labelled “Distribution” ; otherwise the phase is “Neutral” .
4.4 Outputs
• Info table row : Row 8 displays “Market Phase (Vol)” on the left and the detected phase (Accumulation, Distribution or Neutral) on the right. The text colour of both cells matches a user‑selectable palette (typically green for accumulation, red for distribution and grey for neutral).
• On‑chart labels : When show_phase_labels is enabled and a phase persists for at least one bar, the module prints a label above the bar ( “Accum” ) or below the bar ( “Dist” ) with a dashed or dotted connector. The label is offset using ATR based on phase_label_atr_len_input and phase_label_multiplier and is styled according to user preferences.
Figure caption, The chart displays a red “Dist” label above a particular bar, indicating that the accumulation/distribution module identified a distribution phase at that point. The detection is based on seller dominance: during that bar, the net buyer-minus-seller flow and the OBV‑style cumulative flow were trending down, and the buyer ratio had dropped below the preset threshold. These conditions satisfy the distribution criteria in strict mode. The label is placed above the bar using an ATR‑based offset and a dashed connector. By the time of the current bar in the screenshot, the phase indicator shows “Neutral” in the info table—signaling that neither accumulation nor distribution conditions are currently met—yet the historical “Dist” label remains to mark where the prior distribution phase began.
Figure caption, In this example the market phase module has signaled an Accumulation phase. Three bars before the current candle, the algorithm detected a shift toward buyers: up‑volume exceeded its moving average, down‑volume was below average, and the buyer share of total volume climbed above the threshold while the on‑balance net flow and cumulative ratios were trending upwards. The blue “Accum” label anchored below that bar marks the start of the phase; it remains on the chart because successive bars continue to satisfy the accumulation conditions. The info table confirms this: the “Market Phase (Vol)” row still reads Accumulation, and the ratio and sum rows show buyers dominating both on the current bar and across the lookback window.
5. OB/OS Spike Module
5.1 What overbought/oversold means here
In many markets, a rapid extension up or down is often followed by a period of consolidation or reversal. The indicator interprets overbought (OB) conditions as abnormally strong selling risk at or after a price rally and oversold (OS) conditions as unusually strong buying risk after a decline. Importantly, these are not direct trade signals; rather they flag areas where caution or contrarian setups may be appropriate.
5.2 Inputs
• minHits_obos (1–7): Minimum number of oscillators that must agree on an overbought or oversold condition for a label to print.
• syncWin_obos: Length of a small sliding window over which oscillator votes are smoothed by taking the maximum count observed. This helps filter out choppy signals.
• Volume spike criteria: kVolRatio_obos (ratio of current volume to its SMA) and zVolThr_obos (Z‑score threshold) across volLen_obos. Either threshold can trigger a spike.
• Oscillator toggles and periods: Each of RSI, Stochastic (K and D), Williams %R, CCI, MFI, DeMarker and Stochastic RSI can be independently enabled; their periods are adjustable.
• Label appearance: ATR‑based offset, size, colors for OB and OS labels, plus connector style and width.
5.3 Detection logic
1. Directional volume spikes: Volume spikes are computed separately for buyer and seller volumes. A sell volume spike (sellVolSpike) flags a potential OverBought bar, while a buy volume spike (buyVolSpike) flags a potential OverSold bar. A spike occurs when the respective volume exceeds kVolRatio_obos times its simple moving average over the window or when its Z‑score exceeds zVolThr_obos.
2. Oscillator votes: For each enabled oscillator, calculate its overbought and oversold state using standard thresholds (e.g., RSI ≥ 70 for OB and ≤ 30 for OS; Stochastic %K/%D ≥ 80 for OB and ≤ 20 for OS; etc.). Count how many oscillators vote for OB and how many vote for OS.
3. Minimum hits: Apply the smoothing window syncWin_obos to the vote counts using a maximum‑of‑last‑N approach. A candidate bar is only considered if the smoothed OB hit count ≥ minHits_obos (for OverBought) or the smoothed OS hit count ≥ minHits_obos (for OverSold).
4. Tie‑breaking: If both OverBought and OverSold spike conditions are present on the same bar, compare the smoothed hit counts: the side with the higher count is selected; ties default to OverBought.
5. Label printing: When conditions are met, the bar is labelled as “OverBought X/7” above the candle or “OverSold X/7” below it. “X” is the number of oscillators confirming, and the bracket lists the abbreviations of contributing oscillators. Labels are offset from price using half of an ATR‑scaled distance and can optionally include a dotted or dashed connector line.
Figure caption, In this chart the overbought/oversold module has flagged an OverSold signal. A sell‑off from the prior highs brought price down to the lower trend‑line, where the bar marked “OverSold 3/7 DeM” appears. This label indicates that on that bar the module detected a buy‑side volume spike and that at least three of the seven enabled oscillators—in this case including the DeMarker—were in oversold territory. The label is printed below the candle with a dotted connector, signaling that the market may be temporarily exhausted on the downside. After this oversold print, price begins to rebound towards the upper red trend‑line and higher pivot levels.
Figure caption, This example shows the overbought/oversold module in action. In the left‑hand panel you can see the OB/OS settings where each oscillator (RSI, Stochastic, Williams %R, CCI, MFI, DeMarker and Stochastic RSI) can be enabled or disabled, and the ATR length and label offset multiplier adjusted. On the chart itself, price has pushed up to the descending red trendline and triggered an “OverBought 3/7” label. That means the sell‑side volume spiked relative to its average and three out of the seven enabled oscillators were in overbought territory. The label is offset above the candle by half of an ATR and connected with a dashed line, signaling that upside momentum may be overextended and a pause or pullback could follow.
6. Buyer/Seller Trap Module
6.1 Concept
A bull trap occurs when price appears to break above resistance, attracting buyers, but fails to sustain the move and quickly reverses, leaving a long upper wick and trapping late entrants. A bear trap is the opposite: price breaks below support, lures in sellers, then snaps back, leaving a long lower wick and trapping shorts. This module detects such traps by looking for price structure sweeps, order‑flow mismatches and dominance reversals. It uses a scoring system to differentiate risk from confirmed traps.
6.2 Inputs
• trap_lookback_len: Window length used to rank extremes and detect sweeps.
• trap_wick_threshold: Minimum proportion of a bar’s range that must be wick (upper for bull traps, lower for bear traps) to qualify as a sweep.
• trap_score_risk: Minimum aggregated score required to flag a trap risk. (The code defines a trap_score_confirm input, but confirmation is actually based on price reversal rather than a separate score threshold.)
• trap_confirm_bars: Maximum number of bars allowed for price to reverse and confirm the trap. If price does not reverse in this window, the risk label will expire or remain unconfirmed.
• Label settings: ATR length and multiplier for offsetting, size, colours for risk and confirmed labels, and connector style and width. Separate settings exist for bull and bear traps.
• Toggle inputs: show_trap_module and show_trap_labels enable the module and control whether labels are drawn on the chart.
6.3 Scoring logic
The module assigns points to several conditions and sums them to determine whether a trap risk is present. For bull traps, the score is built from the following (bear traps mirror the logic with highs and lows swapped):
1. Sweep (2 points): Price trades above the high pivot (HH1) but fails to close above it and leaves a long upper wick at least trap_wick_threshold × range. For bear traps, price dips below the low pivot (LL1), fails to close below and leaves a long lower wick.
2. Close break (1 point): Price closes beyond HH1 or LL1 without leaving a long wick.
3. Candle/delta mismatch (2 points): The candle closes bullish yet the order flow delta is negative or the seller ratio exceeds 50%, indicating hidden supply. Conversely, a bearish close with positive delta or buyer dominance suggests hidden demand.
4. Dominance inversion (2 points): The current bar’s buyer volume has the highest rank in the lookback window while cumulative sums favor sellers, or vice versa.
5. Low‑volume break (1 point): Price crosses the pivot but total volume is below its moving average.
The total score for each side is compared to trap_score_risk. If the score is high enough, a “Bull Trap Risk” or “Bear Trap Risk” label is drawn, offset from the candle by half of an ATR‑scaled distance using a dashed outline. If, within trap_confirm_bars, price reverses beyond the opposite level—drops back below the high pivot for bull traps or rises above the low pivot for bear traps—the label is upgraded to a solid “Bull Trap” or “Bear Trap” . In this version of the code, there is no separate score threshold for confirmation: the variable trap_score_confirm is unused; confirmation depends solely on a successful price reversal within the specified number of bars.
Figure caption, In this example the trap module has flagged a Bear Trap Risk. Price initially breaks below the most recent low pivot (LL1), but the bar closes back above that level and leaves a long lower wick, suggesting a failed push lower. Combined with a mismatch between the candle direction and the order flow (buyers regain control) and a reversal in volume dominance, the aggregate score exceeds the risk threshold, so a dashed “Bear Trap Risk” label prints beneath the bar. The green and red trend lines mark the current low and high pivot trajectories, while the horizontal dashed lines show the highest and lowest values in the lookback window. If, within the next few bars, price closes decisively above the support, the risk label would upgrade to a solid “Bear Trap” label.
Figure caption, In this example the trap module has identified both ends of a price range. Near the highs, price briefly pushes above the descending red trendline and the recent pivot high, but fails to close there and leaves a noticeable upper wick. That combination of a sweep above resistance and order‑flow mismatch generates a Bull Trap Risk label with a dashed outline, warning that the upside break may not hold. At the opposite extreme, price later dips below the green trendline and the labelled low pivot, then quickly snaps back and closes higher. The long lower wick and subsequent price reversal upgrade the previous bear‑trap risk into a confirmed Bear Trap (solid label), indicating that sellers were caught on a false breakdown. Horizontal dashed lines mark the highest high and lowest low of the lookback window, while the red and green diagonals connect the earliest and latest pivot highs and lows to visualize the range.
7. Sharp Move Module
7.1 Concept
Markets sometimes display absorption or climax behavior—periods when one side steadily gains the upper hand before price breaks out with a sharp move. This module evaluates several order‑flow and volume conditions to anticipate such moves. Users can choose how many conditions must be met to flag a risk and how many (plus a price break) are required for confirmation.
7.2 Inputs
• sharp Lookback: Number of bars in the window used to compute moving averages, sums, percentile ranks and reference levels.
• sharpPercentile: Minimum percentile rank for the current side’s volume; the current buy (or sell) volume must be greater than or equal to this percentile of historical volumes over the lookback window.
• sharpVolMult: Multiplier used in the volume climax check. The current side’s volume must exceed this multiple of its average to count as a climax.
• sharpRatioThr: Minimum dominance ratio (current side’s volume relative to the opposite side) used in both the instant and cumulative dominance checks.
• sharpChurnThr: Maximum ratio of a bar’s range to its ATR for absorption/churn detection; lower values indicate more absorption (large volume in a small range).
• sharpScoreRisk: Minimum number of conditions that must be true to print a risk label.
• sharpScoreConfirm: Minimum number of conditions plus a price break required for confirmation.
• sharpCvdThr: Threshold for cumulative delta divergence versus price change (positive for bullish accumulation, negative for bearish distribution).
• Label settings: ATR length (sharpATRlen) and multiplier (sharpLabelMult) for positioning labels, label size, colors and connector styles for bullish and bearish sharp moves.
• Toggles: enableSharp activates the module; show_sharp_labels controls whether labels are drawn.
7.3 Conditions (six per side)
For each side, the indicator computes six boolean conditions and sums them to form a score:
1. Dominance (instant and cumulative):
– Instant dominance: current buy volume ≥ sharpRatioThr × current sell volume.
– Cumulative dominance: sum of buy volumes over the window ≥ sharpRatioThr × sum of sell volumes (and vice versa for bearish checks).
2. Accumulation/Distribution divergence: Over the lookback window, cumulative delta rises by at least sharpCvdThr while price fails to rise (bullish), or cumulative delta falls by at least sharpCvdThr while price fails to fall (bearish).
3. Volume climax: The current side’s volume is ≥ sharpVolMult × its average and the product of volume and bar range is the highest in the lookback window.
4. Absorption/Churn: The current side’s volume divided by the bar’s range equals the highest value in the window and the bar’s range divided by ATR ≤ sharpChurnThr (indicating large volume within a small range).
5. Percentile rank: The current side’s volume percentile rank is ≥ sharp Percentile.
6. Mirror logic for sellers: The above checks are repeated with buyer and seller roles swapped and the price break levels reversed.
Each condition that passes contributes one point to the corresponding side’s score (0 or 1). Risk and confirmation thresholds are then applied to these scores.
7.4 Scoring and labels
• Risk: If scoreBull ≥ sharpScoreRisk, a “Sharp ↑ Risk” label is drawn above the bar. If scoreBear ≥ sharpScoreRisk, a “Sharp ↓ Risk” label is drawn below the bar.
• Confirmation: A risk label is upgraded to “Sharp ↑” when scoreBull ≥ sharpScoreConfirm and the bar closes above the highest recent pivot (HH1); for bearish cases, confirmation requires scoreBear ≥ sharpScoreConfirm and a close below the lowest pivot (LL1).
• Label positioning: Labels are offset from the candle by ATR × sharpLabelMult (full ATR times multiplier), not half, and may include a dashed or dotted connector line if enabled.
Figure caption, In this chart both bullish and bearish sharp‑move setups have been flagged. Earlier in the range, a “Sharp ↓ Risk” label appears beneath a candle: the sell‑side score met the risk threshold, signaling that the combination of strong sell volume, dominance and absorption within a narrow range suggested a potential sharp decline. The price did not close below the lower pivot, so this label remains a “risk” and no confirmation occurred. Later, as the market recovered and volume shifted back to the buy side, a “Sharp ↑ Risk” label prints above a candle near the top of the channel. Here, buy‑side dominance, cumulative delta divergence and a volume climax aligned, but price has not yet closed above the upper pivot (HH1), so the alert is still a risk rather than a confirmed sharp‑up move.
Figure caption, In this chart a Sharp ↑ label is displayed above a candle, indicating that the sharp move module has confirmed a bullish breakout. Prior bars satisfied the risk threshold — showing buy‑side dominance, positive cumulative delta divergence, a volume climax and strong absorption in a narrow range — and this candle closes above the highest recent pivot, upgrading the earlier “Sharp ↑ Risk” alert to a full Sharp ↑ signal. The green label is offset from the candle with a dashed connector, while the red and green trend lines trace the high and low pivot trajectories and the dashed horizontals mark the highest and lowest values of the lookback window.
8. Market‑Maker / Spread‑Capture Module
8.1 Concept
Liquidity providers often “capture the spread” by buying and selling in almost equal amounts within a very narrow price range. These bars can signal temporary congestion before a move or reflect algorithmic activity. This module flags bars where both buyer and seller volumes are high, the price range is only a few ticks and the buy/sell split remains close to 50%. It helps traders spot potential liquidity pockets.
8.2 Inputs
• scalpLookback: Window length used to compute volume averages.
• scalpVolMult: Multiplier applied to each side’s average volume; both buy and sell volumes must exceed this multiple.
• scalpTickCount: Maximum allowed number of ticks in a bar’s range (calculated as (high − low) / minTick). A value of 1 or 2 captures ultra‑small bars; increasing it relaxes the range requirement.
• scalpDeltaRatio: Maximum deviation from a perfect 50/50 split. For example, 0.05 means the buyer share must be between 45% and 55%.
• Label settings: ATR length, multiplier, size, colors, connector style and width.
• Toggles : show_scalp_module and show_scalp_labels to enable the module and its labels.
8.3 Signal
When, on the current bar, both TF_buy_breakout and TF_sell_breakout exceed scalpVolMult times their respective averages and (high − low)/minTick ≤ scalpTickCount and the buyer share is within scalpDeltaRatio of 50%, the module prints a “Spread ↔” label above the bar. The label uses the same ATR offset logic as other modules and draws a connector if enabled.
Figure caption, In this chart the spread‑capture module has identified a potential liquidity pocket. Buyer and seller volumes both spiked above their recent averages, yet the candle’s range measured only a couple of ticks and the buy/sell split stayed close to 50 %. This combination met the module’s criteria, so it printed a grey “Spread ↔” label above the bar. The red and green trend lines link the earliest and latest high and low pivots, and the dashed horizontals mark the highest high and lowest low within the current lookback window.
9. Money Flow Module
9.1 Concept
To translate volume into a monetary measure, this module multiplies each side’s volume by the closing price. It tracks buying and selling system money default currency on a per-bar basis and sums them over a chosen period. The difference between buy and sell currencies (Δ$) shows net inflow or outflow.
9.2 Inputs
• mf_period_len_mf: Number of bars used for summing buy and sell dollars.
• Label appearance settings: ATR length, multiplier, size, colors for up/down labels, and connector style and width.
• Toggles: Use enableMoneyFlowLabel_mf and showMFLabels to control whether the module and its labels are displayed.
9.3 Calculations
• Per-bar money: Buy $ = TF_buy_breakout × close; Sell $ = TF_sell_breakout × close. Their difference is Δ$ = Buy $ − Sell $.
• Summations: Over mf_period_len_mf bars, compute Σ Buy $, Σ Sell $ and ΣΔ$ using math.sum().
• Info table entries: Rows 9–13 display these values as texts like “↑ USD 1234 (1M)” or “ΣΔ USD −5678 (14)”, with colors reflecting whether buyers or sellers dominate.
• Money flow status: If Δ$ is positive the bar is marked “Money flow in” ; if negative, “Money flow out” ; if zero, “Neutral”. The cumulative status is similarly derived from ΣΔ.Labels print at the bar that changes the sign of ΣΔ, offset using ATR × label multiplier and styled per user preferences.
Figure caption, The chart illustrates a steady rise toward the highest recent pivot (HH1) with price riding between a rising green trend‑line and a red trend‑line drawn through earlier pivot highs. A green Money flow in label appears above the bar near the top of the channel, signaling that net dollar flow turned positive on this bar: buy‑side dollar volume exceeded sell‑side dollar volume, pushing the cumulative sum ΣΔ$ above zero. In the info table, the “Money flow (bar)” and “Money flow Σ” rows both read In, confirming that the indicator’s money‑flow module has detected an inflow at both bar and aggregate levels, while other modules (pivots, trend lines and support/resistance) remain active to provide structural context.
In this example the Money Flow module signals a net outflow. Price has been trending downward: successive high pivots form a falling red trend‑line and the low pivots form a descending green support line. When the latest bar broke below the previous low pivot (LL1), both the bar‑level and cumulative net dollar flow turned negative—selling volume at the close exceeded buying volume and pushed the cumulative Δ$ below zero. The module reacts by printing a red “Money flow out” label beneath the candle; the info table confirms that the “Money flow (bar)” and “Money flow Σ” rows both show Out, indicating sustained dominance of sellers in this period.
10. Info Table
10.1 Purpose
When enabled, the Info Table appears in the lower right of your chart. It summarises key values computed by the indicator—such as buy and sell volume, delta, total volume, breakout status, market phase, and money flow—so you can see at a glance which side is dominant and which signals are active.
10.2 Symbols
• ↑ / ↓ — Up (↑) denotes buy volume or money; down (↓) denotes sell volume or money.
• MA — Moving average. In the table it shows the average value of a series over the lookback period.
• Σ (Sigma) — Cumulative sum over the chosen lookback period.
• Δ (Delta) — Difference between buy and sell values.
• B / S — Buyer and seller share of total volume, expressed as percentages.
• Ref. Price — Reference price for breakout calculations, based on the latest pivot.
• Status — Indicates whether a breakout condition is currently active (True) or has failed.
10.3 Row definitions
1. Up volume / MA up volume – Displays current buy volume on the lower timeframe and its moving average over the lookback period.
2. Down volume / MA down volume – Shows current sell volume and its moving average; sell values are formatted in red for clarity.
3. Δ / ΣΔ – Lists the difference between buy and sell volume for the current bar and the cumulative delta volume over the lookback period.
4. Σ / MA Σ (Vol/MA) – Total volume (buy + sell) for the bar, with the ratio of this volume to its moving average; the right cell shows the average total volume.
5. B/S ratio – Buy and sell share of the total volume: current bar percentages and the average percentages across the lookback period.
6. Buyer Rank / Seller Rank – Ranks the bar’s buy and sell volumes among the last (n) bars; lower rank numbers indicate higher relative volume.
7. Σ Buy / Σ Sell – Sum of buy and sell volumes over the lookback window, indicating which side has traded more.
8. Breakout UP / DOWN – Shows the breakout thresholds (Ref. Price) and whether the breakout condition is active (True) or has failed.
9. Market Phase (Vol) – Reports the current volume‑only phase: Accumulation, Distribution or Neutral.
10. Money Flow – The final rows display dollar amounts and status:
– ↑ USD / Σ↑ USD – Buy dollars for the current bar and the cumulative sum over the money‑flow period.
– ↓ USD / Σ↓ USD – Sell dollars and their cumulative sum.
– Δ USD / ΣΔ USD – Net dollar difference (buy minus sell) for the bar and cumulatively.
– Money flow (bar) – Indicates whether the bar’s net dollar flow is positive (In), negative (Out) or neutral.
– Money flow Σ – Shows whether the cumulative net dollar flow across the chosen period is positive, negative or neutral.
The chart above shows a sequence of different signals from the indicator. A Bull Trap Risk appears after price briefly pushes above resistance but fails to hold, then a green Accum label identifies an accumulation phase. An upward breakout follows, confirmed by a Money flow in print. Later, a Sharp ↓ Risk warns of a possible sharp downturn; after price dips below support but quickly recovers, a Bear Trap label marks a false breakdown. The highlighted info table in the center summarizes key metrics at that moment, including current and average buy/sell volumes, net delta, total volume versus its moving average, breakout status (up and down), market phase (volume), and bar‑level and cumulative money flow (In/Out).
11. Conclusion & Final Remarks
This indicator was developed as a holistic study of market structure and order flow. It brings together several well‑known concepts from technical analysis—breakouts, accumulation and distribution phases, overbought and oversold extremes, bull and bear traps, sharp directional moves, market‑maker spread bars and money flow—into a single Pine Script tool. Each module is based on widely recognized trading ideas and was implemented after consulting reference materials and example strategies, so you can see in real time how these concepts interact on your chart.
A distinctive feature of this indicator is its reliance on per‑side volume: instead of tallying only total volume, it separately measures buy and sell transactions on a lower time frame. This approach gives a clearer view of who is in control—buyers or sellers—and helps filter breakouts, detect phases of accumulation or distribution, recognize potential traps, anticipate sharp moves and gauge whether liquidity providers are active. The money‑flow module extends this analysis by converting volume into currency values and tracking net inflow or outflow across a chosen window.
Although comprehensive, this indicator is intended solely as a guide. It highlights conditions and statistics that many traders find useful, but it does not generate trading signals or guarantee results. Ultimately, you remain responsible for your positions. Use the information presented here to inform your analysis, combine it with other tools and risk‑management techniques, and always make your own decisions when trading.

Parabolic Move Indicator for catching moves with Penny Stocks.
Catch the day’s first big moves! Track premarket gap-ups or gap-downs, then spot early momentum shifts using volume, RSI, VWAP, EMAs, and breakout levels—perfect for acting on strong intraday setups right at market open.
**Description:**
The Parabolic Move Scanner + VWAP Bands + EMAs indicator helps traders identify **high-probability intraday moves**, particularly immediately after market open. It is ideal for stocks that **gap up or down premarket, pull back slightly, and then show renewed strength or weakness** once regular trading begins.
The indicator combines multiple components for precise signals:
* **Relative Volume Filter: ** Highlights bars with unusually high activity to ensure signals are backed by real participation.
* **RSI Momentum Change: ** Detects sudden momentum shifts to identify early strength or weakness.
* **Recent Highs/Lows Breakout: ** Confirms price is breaking short-term resistance or support.
* **VWAP & Standard Deviation Bands: ** Provides intraday trend reference points, with optional daily reset.
* **Exponential Moving Averages (EMAs): ** Tracks trend across short, medium, and long-term intraday periods.
* **Visual Signals: ** Background highlights and horizontal breakout lines make it easy to spot key bars.
* **Alerts: ** Configurable alerts notify you of bullish or bearish parabolic moves.
**Optimal Use Case: **
Use in the first 15–30 minutes after market open at 1 minute Time Frame. Best for **stocks showing a premarket gap followed by a pullback**, then resuming strength (bullish) or weakness (bearish). The combination of **volume, RSI, breakouts, VWAP, and EMAs** ensures you identify the **day’s biggest marktet open moves especially with penny stocks moves** with higher confidence.
---
### **Recommended Settings**
**Component** | **Recommended Setting** | **Description / Purpose**
| **Volume Average Length** | 20 bars | Period for calculating average volume to detect relative spikes. |
| **Volume Multiplier** | 2.0 | Current bar volume must exceed 2× average to signal high activity. |
| **RSI Length** | 7 bars | Short-term RSI period to measure momentum changes. |
| **RSI Change Threshold** | 7 | Minimum RSI change required to trigger momentum signal. |
| **Recent Highs Lookback** | 5 bars | Number of bars to check for short-term breakout levels. |
| **Horizontal Line Length** | 10 bars | Length of horizontal breakout line drawn on the chart. |
| **Horizontal Line Color** | Green (bullish) / Red (bearish) | Visual identification of breakout levels. |
| **Horizontal Line Thickness** | 1 | Line width for breakout visualization. |
| **VWAP Source** | hlc3 | Price source for VWAP calculation. |
| **VWAP Bands Multipliers** | 1×, 2×, 3× | Standard deviation multiples for intraday bands.
| **VWAP Daily Reset** | Enabled | Resets VWAP at the start of each trading day.
| **EMA Lengths** | 9, 13, 20, 33, 50 | Short, medium, and long-term EMAs to track intraday trend. |
| **Enable Bearish Signals** | True | Allows detection of bearish parabolic moves. |
|

MAxRSI Signals [KedArc Quant]Description
Indicator Shows fast/slow moving averages on the chart and prints LONG/SHORT signals when they cross. You can add an RSI filter to confirm signals. Optional higher-timeframe (HTF) smoothing and alert conditions are included.
How signals are made
* LONG: Fast MA crosses above Slow MA and (if enabled) RSI ≥ your “RSI Long Min”.
* SHORT: Fast MA crosses below Slow MA and (if enabled) RSI ≤ your “RSI Short Max”.
* If “Repaint-Safe” is ON, signals confirm at bar close to avoid repainting.
Inputs
* Fast MA / Slow MA Length
* MA Type: SMA / EMA / WMA / HMA
* RSI Filter (length + thresholds)
* Source: Usually close
* Optional HTF for MAs & RSI
* Show MAs / Show Signals toggles
* Repaint-Safe confirmation
* RSI Overlay (visual only)
* Alert Options
On the chart
* Green line = Fast MA, Red line = Slow MA
* Green “LONG” arrow below bar; Red “SHORT” arrow above bar
* Optional bar coloring in trend direction
* Optional RSI overlay line + thresholds
Alerts
* MAxRSI Long / Short fire on crossovers with RSI check
* Bullish/Bearish State fire when the trend flips
Tips
* If no signals appear, check that Fast < Slow and test with RSI filter off
* EMA/HMA often give smoother results
* Use larger MA lengths or HTF for swing setups
Notes & Usage
* Intraday trading: EMA(9–20) as Fast, EMA(50) as Slow is a common setup.
* Swing trading: EMA(20) as Fast, EMA(200) as Slow helps capture broader trend shifts.
* RSI filter works well with default 14 length and 50 level, but you can adjust (e.g., 55/45) for stricter confirmation.
* This script is flexible — test and adapt the settings to your asset and timeframe.
Acknowledgements
This indicator is built on TradingView’s built-in Pine Script v6 functions and features, including:
* `ta.sma`, `ta.ema`, `ta.wma` for moving averages
* Custom Hull MA formula built using `ta.wma`
* `ta.rsi` for Relative Strength Index filtering
* `ta.crossover`, `ta.crossunder` for signal logic
* `request.security` for higher-timeframe (HTF) data
* `plot`, `plotshape`, `barcolor` for visuals
* `alertcondition` for alerts
* General Pine Script v6 features: `input.*` controls, `math.*` helpers, `color.*` utilities
⚠️ Disclaimer
This script is provided for educational purposes only.
Past performance does not guarantee future results.
Trading involves risk, and users should exercise caution and use proper risk management when applying this strategy.

% of Average Volume% of Average Volume (RVOL)
What it is
This indicator measures cumulative volume during pre market and separately during the first 10 minutes of trading and compares it to the average 30 day volume. This matters as a high ratio of volume within the premarket and then during the first 10 minutes of trading can correlate to a stock that has a higher probability of trending in that direction throughout the day.
What it’s meant to do
Identify abnormally high or low participation early in the day.
Normalize volume by time of session, so 9:40 volume is compared to past 9:40 volume—not to the full-day total.
Provide consistent RVOL across 1–5–15–60 minute charts (the same market state yields similar readings).
Handle pre-market cleanly (optional) without inflating RVOL.
How it works (plain English)
Cumulative Intraday Volume: Adds up all bars from the session (or pre-market, if enabled) up to “now.”
Time-Matched Baseline: For each prior day in your lookback, it accumulates only up to the same intraday minute and averages those values.
RVOL %: RVOL = (Today cumulative / Average cumulative at same time) × 100.
This “like-for-like” approach prevents the classic mistakes that overstate RVOL in pre-market or make it drift with timeframe changes.
Works best on
Intraday charts: 1, 2, 3, 4, 5, 10, 15, 30, 45, 60 min
Regular & extended hours: NYSE/Nasdaq equities, futures, ETFs
Daily/weekly views are supported for reference, but the edge comes from intraday time-matched analysis.
Tip: For thin names or very early pre-market, expect more variability—lower liquidity increases noise.
Customization (Inputs → Settings)
Lookback Sessions (e.g., 20): How many prior trading days to build the average.
Include Pre-Market (on/off): If on, RVOL accumulates from pre-market start and compares to historical pre-market at the same time; if off, it begins at the regular session open only.
Session Timezone / Exchange Hours: Choose the session definition that matches your market (e.g., NYSE) so “time-matched” means the same thing every day.
Cutoff Minute (Optional): Fix a reference minute (e.g., 6:40 a.m. PT / 9:40 a.m. ET) to evaluate RVOL at a standard check-in time.
Smoothing (Optional): Apply a short moving average to the RVOL line to reduce jitter.
Thresholds & Colors: Set levels (e.g., 150%, 300%) to color the plot/labels and trigger alerts.
Show Labels/Debug: Toggle on-chart labels (current RVOL%, baseline vols) for quick audits.
On-chart visuals & alerts
RVOL% Line/Histogram: Color-coded by thresholds (e.g., >300% “exceptional”, >150% “elevated”).
Session Markers: Optional vertical lines for pre-market/regular open.
Alerts:
RVOL Crosses Above X% (e.g., 150%, 300%)
RVOL Crosses Below X%
RVOL Rising/Falling (slope-based, optional)
Good defaults to start
Lookback: 20 sessions
Pre-market: Off for large caps, On for momentum screens
Thresholds: 150% (notable), 300% (exceptional)
Smoothing: 0–3 bars (or off for fastest response)
Notes & best practices
Timeframe consistency: Because calculations are time-matched, RVOL should remain directionally consistent across intraday timeframes. If you see divergences, confirm your session hours & timezone match your instrument’s exchange.
Holiday/half days: These are included in history; you can shorten lookback or exclude such sessions if your workflow prefers.
Low-float names: Consider a slightly longer lookback to reduce outlier effects.
TL;DR
A time-matched RVOL that treats pre-market correctly, stays stable across intraday timeframes, and is fully customizable for your exchange hours, thresholds, and alerts—so you can spot real participation when it matters.
