boot2thrill - EMA 20/50 & SMA 50/200//Notes:
//Version by boot2thrill on 05-20-2019.
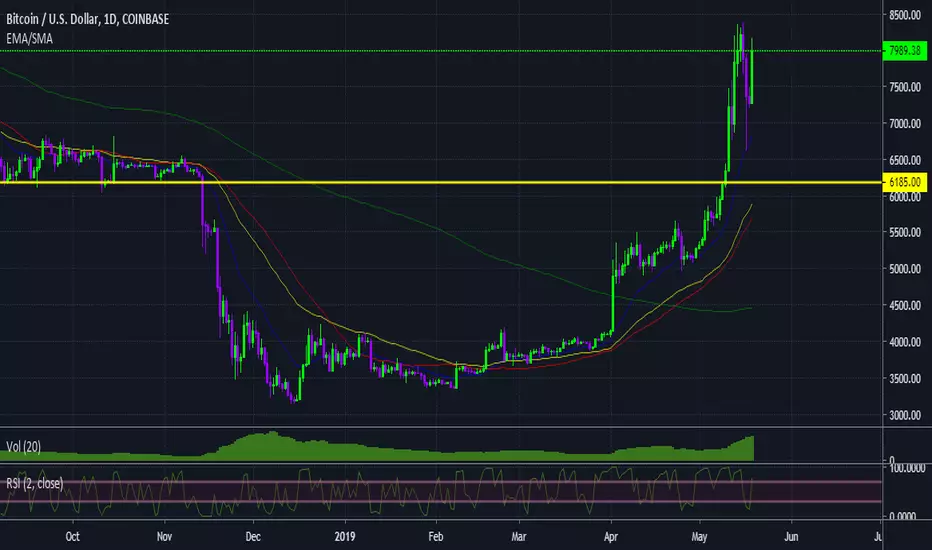
//Version includes combined Exponential Moving Averages (EMA) for 20/50 periods and Simple Moving Averages (SMA) for 50/200 periods.
//***Recommended use on BTCUSD 1h/4h/1d chart.***
Search in scripts for "20蒙古币兑换人民币"
Combo Backtest 123 Reversal and 2/20 EMA This is combo strategies for get
a cumulative signal. Result signal will return 1 if two strategies
is long, -1 if all strategies is short and 0 if signals of strategies is not equal.
First strategy
This System was created from the Book "How I Tripled My Money In The
Futures Market" by Ulf Jensen, Page 183. This is reverse type of strategies.
The strategy buys at market, if close price is higher than the previous close
during 2 days and the meaning of 9-days Stochastic Slow Oscillator is lower than 50.
The strategy sells at market, if close price is lower than the previous close price
during 2 days and the meaning of 9-days Stochastic Fast Oscillator is higher than 50.
Secon strategy
This indicator plots 2/20 exponential moving average. For the Mov
Avg X 2/20 Indicator, the EMA bar will be painted when the Alert criteria is met.
Please, use it only for learning or paper trading. Do not for real trading.
WARNING:
- For purpose educate only
- This script to change bars colors.

Combo Strategies 123 Reversal and 2/20 EMA This is combo strategies for get
a cumulative signal. Result signal will return 1 if two strategies
is long, -1 if all strategies is short and 0 if signals of strategies is not equal.
First strategy
This System was created from the Book "How I Tripled My Money In The
Futures Market" by Ulf Jensen, Page 183. This is reverse type of strategies.
The strategy buys at market, if close price is higher than the previous close
during 2 days and the meaning of 9-days Stochastic Slow Oscillator is lower than 50.
The strategy sells at market, if close price is lower than the previous close price
during 2 days and the meaning of 9-days Stochastic Fast Oscillator is higher than 50.
Secon strategy
This indicator plots 2/20 exponential moving average. For the Mov
Avg X 2/20 Indicator, the EMA bar will be painted when the Alert criteria is met.
Please, use it only for learning or paper trading. Do not for real trading.

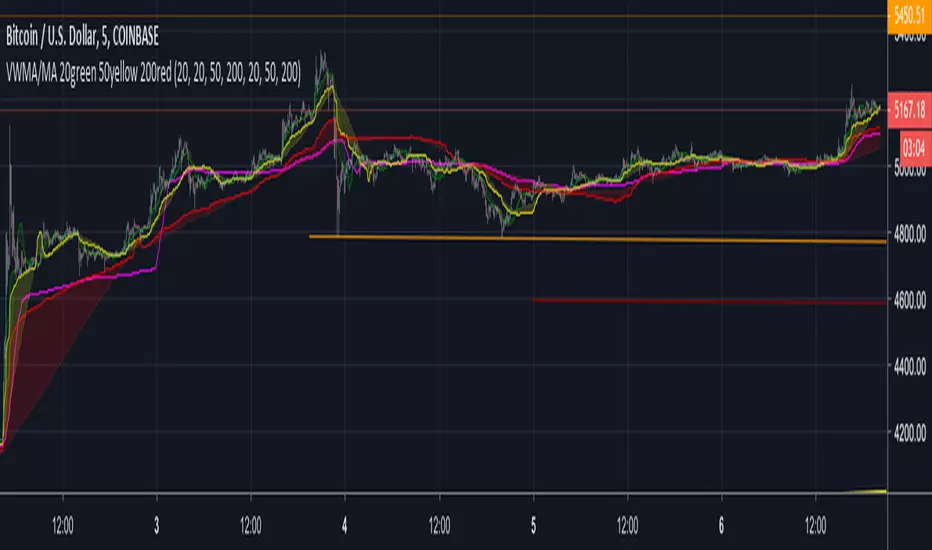
VWMA : 20 50 200Plots 20, 50 and 200 tick Volume Weighted MA and Simple MA.
The Volume Weighted MA tends to move before the SMA. I am seeing significant price movements on crypto charts near 50 VWMA crosses. As well, the 20-50 VWMA crosses. When the thicker lines ( VWMA ) are above or below the same color SMA, this divergence can also signal changes in trends.
This is my first script and likely be updated. Feedback is welcome.
5-8 EMA Cross with added 20 EMAThis is a simple EMA cross script to get into trades early using a 5/8 EMA cross but also allows you to filter out risky trades using the 20 EMA. For long trades the cross is not a valid signal if it occurs below the 20 EMA and vice versa.

EMA CROSS (20,55) S6Hthis indicator gives you a buy and sell signal when the (20) ema crosses (50) ema then that is an buy signal
when the (50) ema crosses (20) ema then that is an sell signal
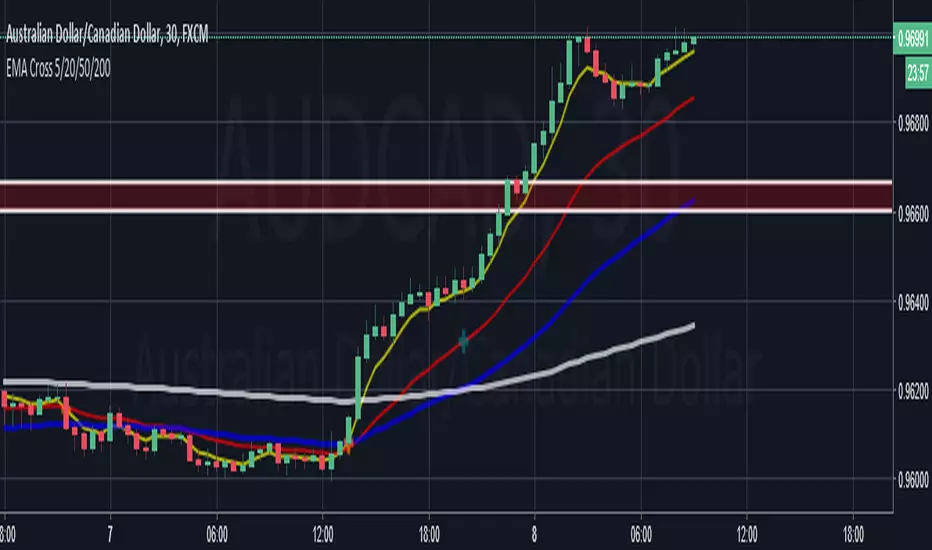
Delphiguy EMA Cross 5/20/50/200A simple Indicator for EMA 5, 20, 50, 200.
It shows gives potential trades on the crossover of the 5/20, and 50/200
It also shows price trend via the 200EMA
2/20 Exponential Moving Average Backtest Strategy
This indicator plots 2/20 exponential moving average. For the Mov
Avg X 2/20 Indicator, the EMA bar will be painted when the Alert criteria is met.
You can use in the xPrice any series: Open, High, Low, Close, HL2, HLC3, OHLC4 and ect...
You can change long to short in the Input Settings
Please, use it only for learning or paper trading. Do not for real trading.

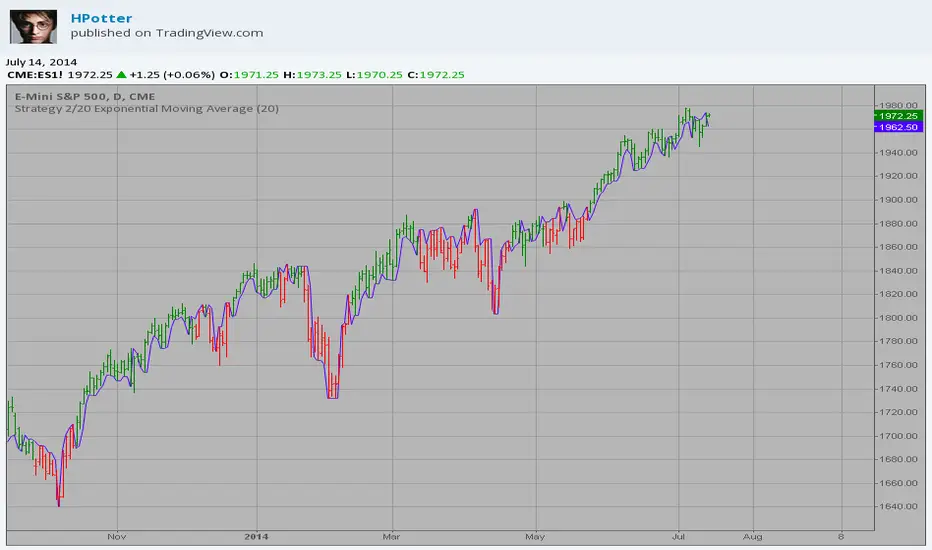
2/20 Exponential Moving Average StrategyThis indicator plots 2/20 exponential moving average. For the Mov
Avg X 2/20 Indicator, the EMA bar will be painted when the Alert criteria is met.
Please, use it only for learning or paper trading. Do not for real trading.
Trend MA 20Simple to use for anyone trading a 20 length moving average.
Crossover is signaled once 20 MA crosses 1 MA at close of selected time interval.

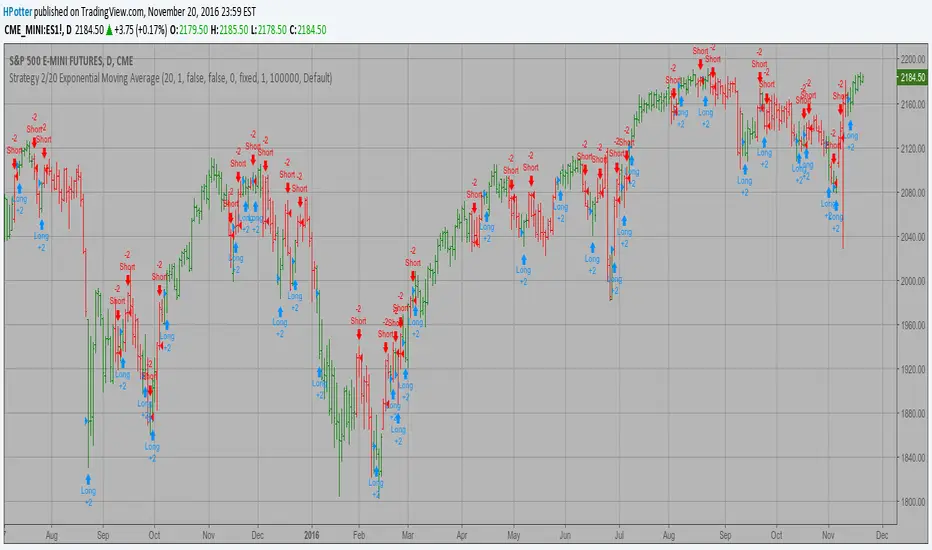
Strategy 2/20 Exponential Moving Average Strategy.
This indicator plots 2/20 exponential moving average. For the Mov
Avg X 2/20 Indicator, the EMA bar will be painted when the Alert criteria is met.
You can use in the xPrice any series: Open, High, Low, Close, HL2, HLC3, OHLC4 and ect...
2/20 Exponential Moving Average This indicator plots 2/20 exponential moving average. For the Mov
Avg X 2/20 Indicator, the EMA bar will be painted when the Alert criteria is met.
You can use in the xPrice any series: Open, High, Low, Close, HL2, HLC3, OHLC4 and ect...

ORB + SMA 20/50 Crossover BUY/SELL by Yuvaraj Veppampattu Plots ORB High & Low lines for the first X minutes.
Adds SMA 20 & SMA 50 lines on chart.
Shows BUY arrow when SMA20 crosses ABOVE SMA50.
Shows SELL arrow when SMA20 crosses BELOW SMA50.
Adds alerts for both ORB breakouts & SMA crossovers.

ikrit : EMA Cross 3/5/20 + Stochastic (Shift=1)EMA 3 5 20 Shift1
Stochastic 35 3 3
It is an indicator used to run trends and find entry points according to the trend by considering the trend on TF H1 and above and entering orders when the EMA lines intersect on M5.

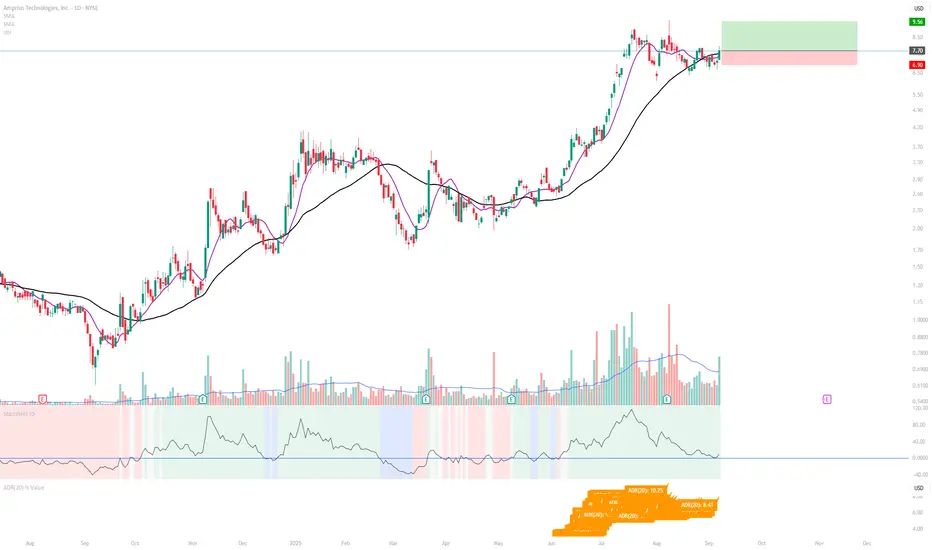
ADR(20) % ValueDisplays the 20-day Average Daily Range (ADR) as a % of price, following the method popularized by Kristjan Qullamägi (Qullamaggie). The ADR value updates dynamically and is printed directly on the chart for quick reference.
9 EMA / 20 EMA Crossover with alert for DUKE9 EMA / 20 EMA Crossover with alert for DUKE
has built in alerts to make your life easier

EMAs 20/50/200 with Trend ColoringIt calculates EMA 20, 50, and 200.
For each EMA, it compares the current value with the previous bar (ema > ema ).
If rising → green, if falling → red.
All three EMAs are plotted with different colors dynamically changing by slope.


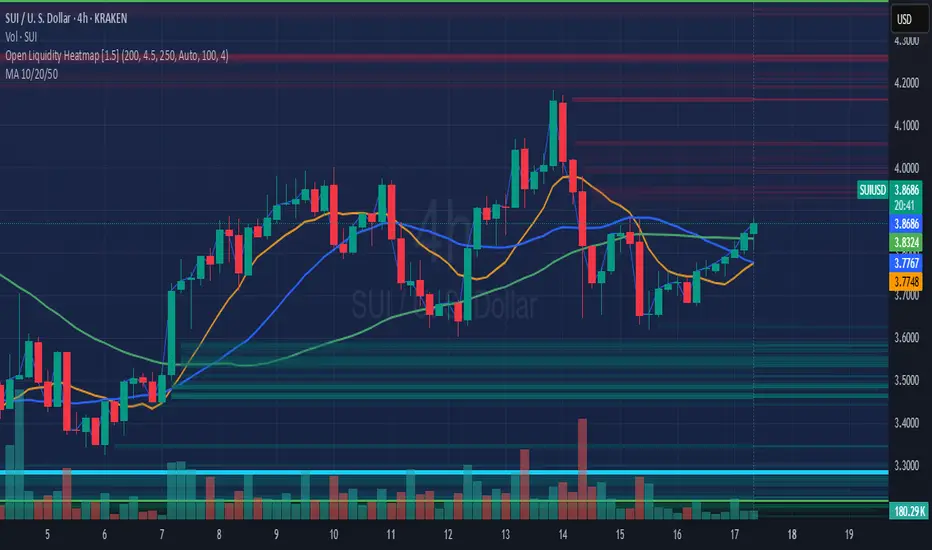
MA 10/20/50A Simple MA array including 10, 20, and 50 day.
Used primarily for determining crypto bullish or bearish technical trending primarily on the 1-day chart.
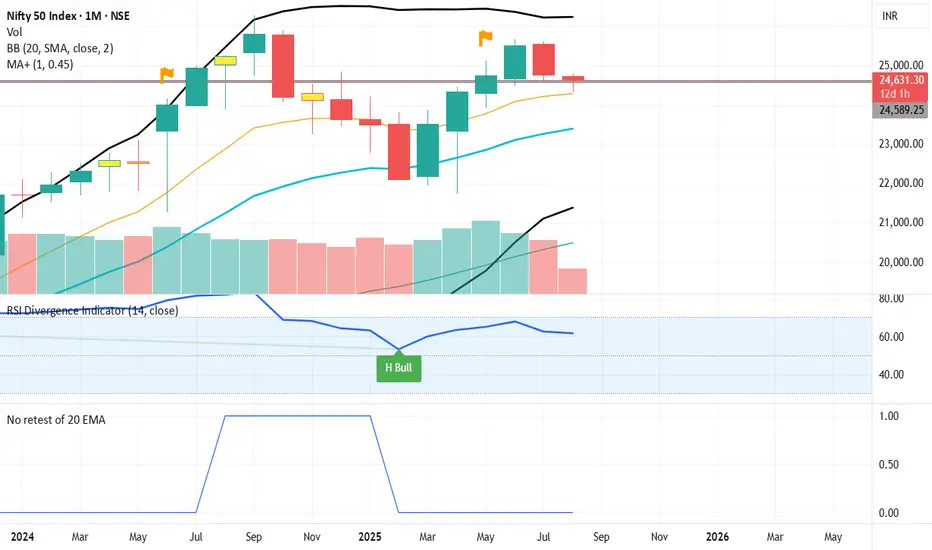
Noretest of 20 EMA since 50 dayits an indicator which represents that price is away from 20 EMA for very long interval of price movement

9 EMA & 20 EMA with Fill9 and 20 EMAs with fill to identify easily when in dynamic up trend, green when bullish, red when bearish
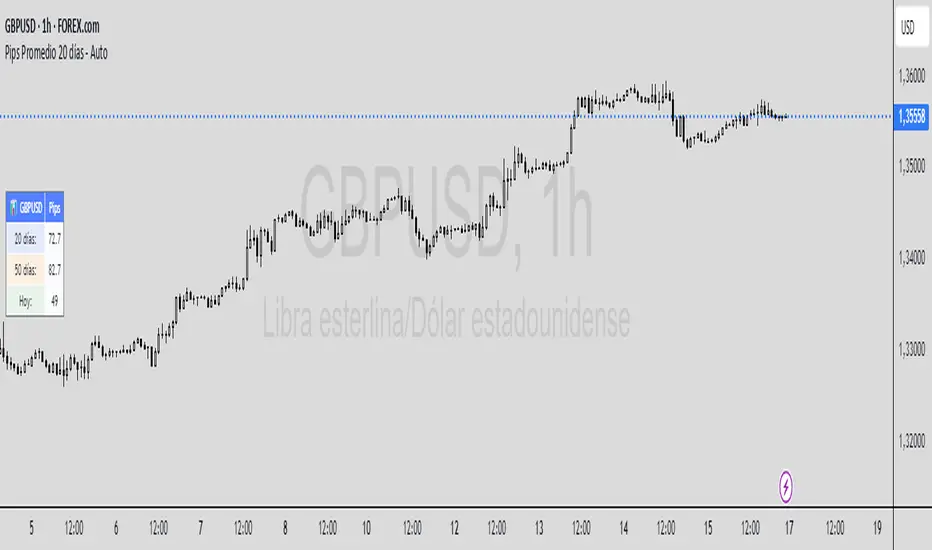
Pips Promedio 20 días - AutoEste indicador muestra la media diaria que mueve un par en pips en los ultimos 20 dias .