TSF 20What kind of traders/investors are we?
We are trend followers. We look for assets that are outperforming the market. Our scripts are designed to be used on the higher timeframes (weekly/daily) to catch the large moves/trends in the market.
Our scripts have been designed to help you follow the trend in an asset.
What does this script do?
This script is designed to colour candles on a chart based on their position relative to two sets of Bollinger Bands. Here's a breakdown of how it functions:
Bollinger Bands Setup:
The script uses two sets of Bollinger Bands, both with a length of 20 and based on the closing prices of candles.
The first set of Bollinger Bands uses a standard deviation (StdDev) of 1.
The second set uses a standard deviation of 2.
Neither set of bands is displayed on the chart.
Coloring Candles:
Green Candle: A candle is coloured green if its close is above the upper Bollinger Band with StdDev 1 but below the upper Bollinger Band with StdDev 2. This indicates a moderately bullish sentiment.
Dark Green Candle: A candle is colored dark green when its close is above the upper Bollinger Band with StdDev 2. This implies a stronger bullish sentiment.
Red Candle: A candle is coloured red if its close is below the lower Bollinger Band with StdDev 1 but above the lower Bollinger Band with StdDev 2. This indicates a moderately bearish sentiment.
Dark Red Candle: A candle is colored dark red if its close is below the lower Bollinger Band with StdDev 2, indicating a stronger bearish sentiment.
Grey Candle: A candle is coloured grey if it closes between the upper and lower Bollinger Bands with StdDev 1. This usually signifies a neutral market condition or periods of consolidation.
In summary, this script is an analytical tool that visually represents the market's bullishness or bearishness relative to the Bollinger Bands, without displaying the bands themselves. It's designed to help investors quickly assess market conditions and sentiment based on the colour-coded representation of price action in relation to these volatility bands.
What makes this script unique?
Innovative Color-Coding System: Candles are colored in varying shades of green and red, providing an immediate visual cue about the market's bullish or bearish tendencies. A neutral grey is also used, offering a quick assessment of market indecision or consolidation phases.
Dual Bollinger Band Analysis: Utilizes two sets of Bollinger Bands (StdDev 1 and StdDev 2) to gauge market volatility and sentiment. This dual-band approach enhances the precision of sentiment analysis compared to using a single standard deviation.
Customizable and Non-Obtrusive: Designed to keep your charts clean and readable. The Bollinger Bands themselves are not displayed, reducing visual clutter and allowing for a focus on price action.
Versatile and Adaptable: Suitable for various trading styles and timeframes. Whether you are a short-term or long-term investor, this indicator can be seamlessly integrated into your analysis toolkit.
Valuable Addition to Market Analysis: Enhances traditional candlestick analysis and complements other technical indicators and strategies. It offers an additional layer of understanding market dynamics and can be used to confirm or question other signals.
How It Adds Value:
Enhanced Visual Analysis: By colour-coding candles based on Bollinger Band positioning, it simplifies the interpretation of market sentiment and volatility, making it easier to spot trends and reversals.
Strategic Decision Making: Helps traders make more informed decisions by clearly highlighting bullish and bearish strength, or lack thereof, in the market.
Time Efficiency: Reduces the time spent analyzing charts by providing an immediate visual representation of market conditions.
Originality: Offers a fresh perspective and an innovative approach to using Bollinger Bands, making it a unique addition to the community's toolbox.
Search in scripts for "20蒙古币兑换人民币"

9-20 sma multi timeframe indicatorThis is an indicator to help visualizing the 9 and the 20 sma on 3 different timeframes.
When they cross, you will see a cross on the band representing the timeframe.
When a trade is favorable the band will color in green for up trend and in red for downtrend:
- Conditions in uptrend: Start after the first green candle closed above the 9 sma, Stop after the first red candle closed under the 9 sma
- Conditions in downtrend: Start after the first red candle closed below the 9 sma, Stop after the first green candle closed above the 9 sma
Adjusted Volume - 20 to 18-dayScript based off the definition Adjusted Volume means the sum of trading volume for a period of 20 consecutive trading days ending on the day preceding the date of determination; provided, however, that the day with the highest volume and the day with the lowest volume shall be eliminated and only the remaining 18 days summed.

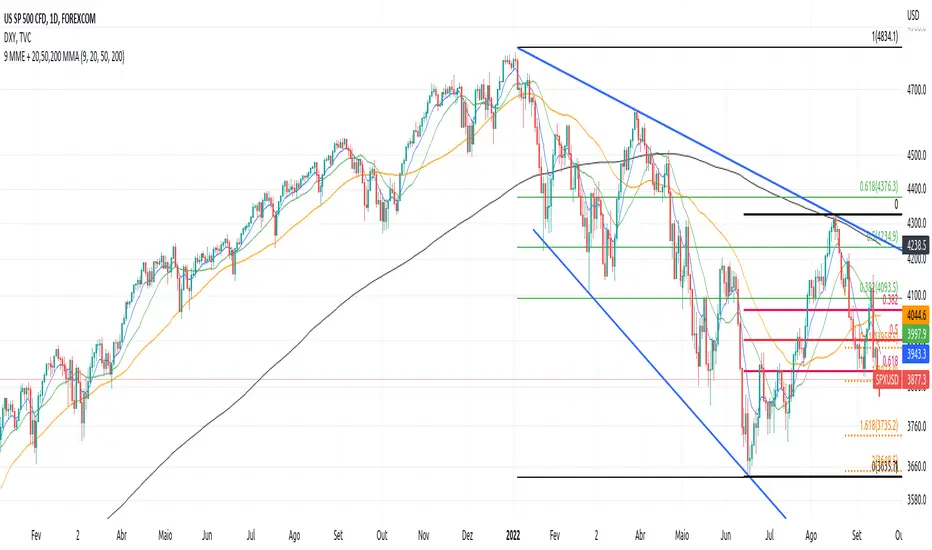
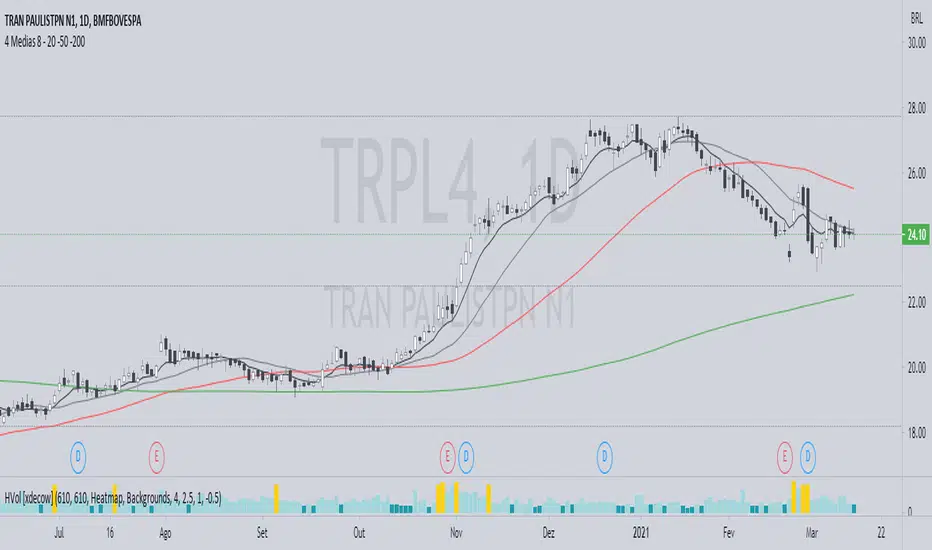
LuizinTradezone - 9 MME + 20,50,200 MMAScript que inclui a média móvel de 9 (exponencial), e as médias aritméticas de 20, 50 e 200
Simple and Exponential Moving Averages (20, 50, 200)Displays the 20, 50, and 200 simple and exponential moving averages in 1 indicator.
Simple Moving Averages (20, 50, 200)Allows you to plot 20 day, 50 day, and 200 day simple moving averages using only 1 indicator.
ln(close/20 sma) adjusted for time (BTC)(This indicator was designed for the BTC index chart)
Designed for Bitcoin. Plots the log of the close/20W SMA with a linear offset m*t, where m is the gradient I've chosen and t is the candle index. Anything above 1 is a mania phase/market cycle top. If it peaks around 0.92 and rolls over, it could be a local/market cycle top.
This will obviously not work at all in the long term as Bitcoin will not continue following the trend line on the log plot (you can even see it start to deviate in the Jan-Feb 2021 peaks where the indicator went to 1.15).
It identifies the 2011, 2013 (both of them), 2017 tops as being just above 1. It also identifies the 2019 local peak and 2021 market cycle top at ~0.94.
Feel free to change the gradient or even add a function to curve the straight line eventually. I made this for fun, feel free to use it as you wish.

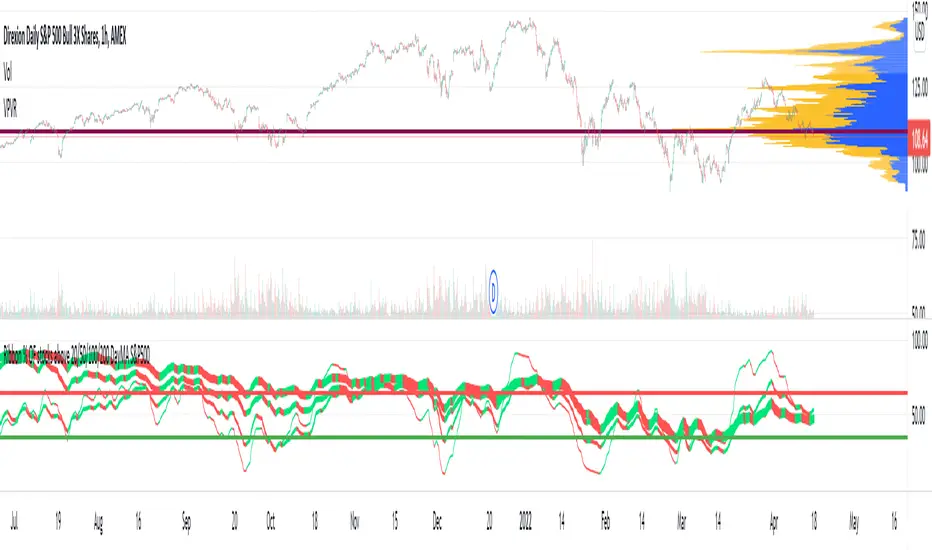
Ribbon % OF stocks above 20/50/100/200 DayMA S&P500Moving average ribbon of % stocks above 20/50/100/200 Day moving average in th S&P500. Directional color. Pretty good indicator for big bottoms. Tops - not so much. use 1D timeframe.

Simple Moving Averages (10 & 20 & 50 & 200) for ScalpingSimple Moving Averages for Scalping (10 / 20 / 50 / 200 SMAs)

EMA 9 & 20 Cross StrategyThis is for 9 and 20 Exponential Moving Averages to identify buy and sell opportunities

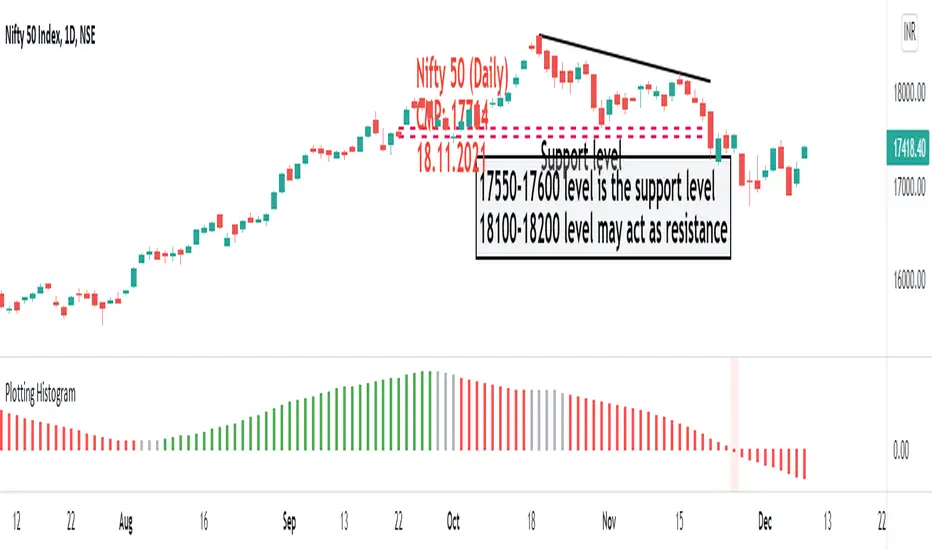
DMA Histogram (20/50)This script plots the distance between two moving averages in the form of histogram. In this case, I am using 20 day moving average and 50 day moving average.
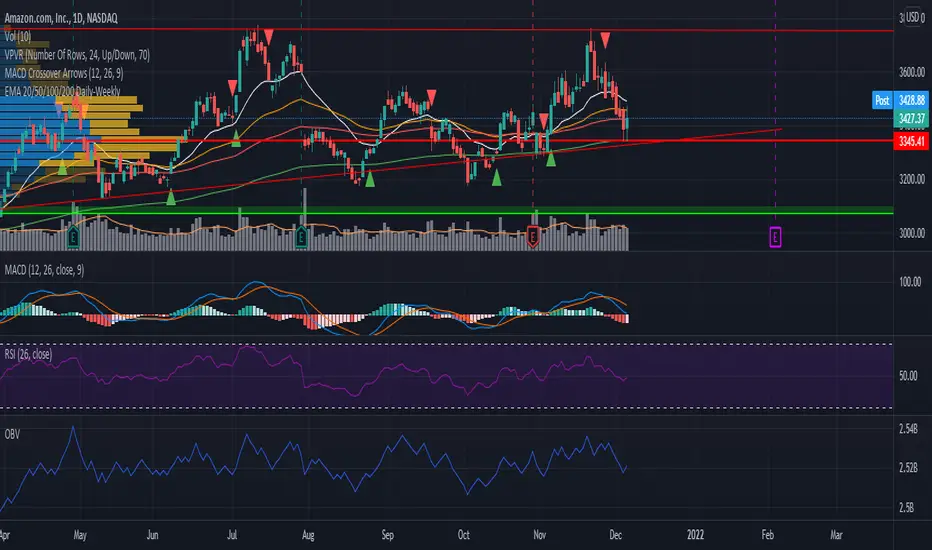
EMA 20/50/100/200 Daily-WeeklyHello!
In case this helps others when using EMA's on multiple timeframes, I decided to publish this script I modified.
It adds the EMA for 20/50/100/200 timeframes and gives them the color white, orange, red, green respectively.
The weekly timeframe will get the corresponding weekly EMA.
The monthly timeframe will get the corresponding monthly EMA.
The daily timeframe, and all timeframes below this, will get the daily timeframe. The idea that that a ticker symbol might respect with strength the daily EMA's - you'll be able to move to a smaller timeframe and still view the daily EMA's in an effort to better view how close the ticker came to taking a specific EMA.
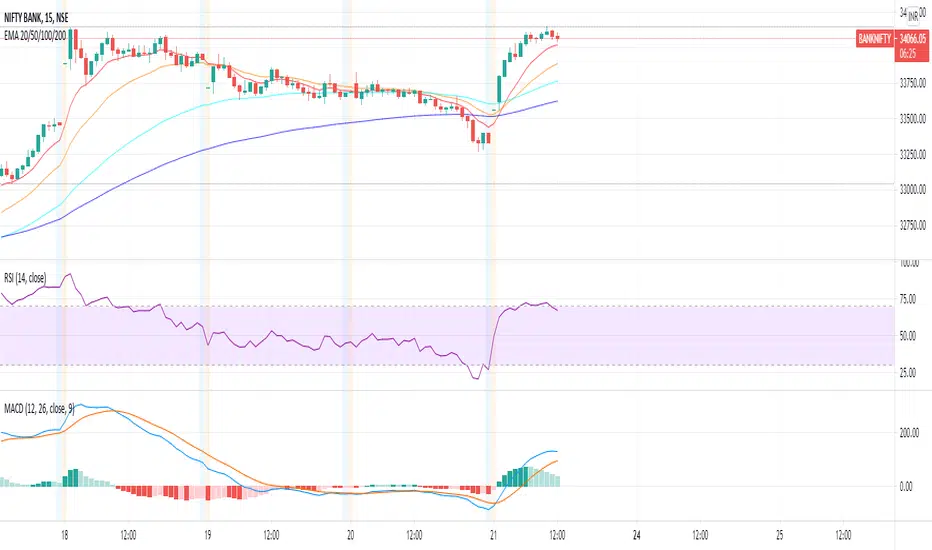
EMA 9/20/50/100 by electroNIKThis script plots EMAs at interval of 9 , 20, 50, 100 for any timer interval which is selected by user. This script doesn't give any signals, it is just to make life easy of users instead of adding too many EMAs to chart and manage their setting explicitly.
Nifty 20 VolumeThis script computes the volume for Nifty 50 index. I am using top 20 stocks here that constitute about 75% of the Nifty 50. I had used the script created by @shijithlal as a base for this. He has used all 45-50 stocks in his script. You can look that up if you want a more accurate volume.

EMA (10,20,60) + Bollinger BandsCombination of bollinger bands and exponential moving averages (10, 20, 60)
The coloring is optimized for dark background, and it is editable
This indicator combined 3 exponential moving average lines and bollinger bands . The EMA lines can be add or deleted in pine editor, and its parameters can be changed too. Same to the bollinger bands . Defaulted value for BB is 20SMA with 2 standard deviations.
Useful as a supplmentary indicators

Simple Moving Average (5,10,20,30,50,100,150,200,250)Simple Moving Average (5, 10, 20, 30, 50, 100, 150, 200, 250)
For those who want a combo of simple moving average
You can edit the color of each line when in use