[c3s] CWS - M2 Global Liquidity Index & BTC Correlation CWS - M2 Global Liquidity Index with Offset BTC Correlation
This custom indicator visualizes and analyzes the relationship between the global M2 money supply and Bitcoin (BTC) price movements. It calculates the correlation between these two variables to provide insights into how changes in global liquidity may impact Bitcoin’s price over time.
Key Features:
Global M2 Liquidity Index Calculation:
Fetches M2 money supply data from multiple economies (China, US, EU, Japan, UK) and normalizes using currency exchange rates (e.g., CNY/USD, EUR/USD).
Combines all M2 data points and normalizes by dividing by 1 trillion (1e12) for easier visualization.
Offset for M2 Data:
The offset parameter allows users to shift the M2 data by a specified number of days, helping track the influence of past global liquidity on Bitcoin.
BTC Price Correlation:
Computes the correlation between shifted global M2 liquidity and Bitcoin (BTC) price, using a 52-day lookback period by default.
Correlation Quality Display:
Categorizes correlation quality as:
Excellent : Correlation >= 0.8
Good : Correlation >= 0.6 and < 0.8
Weak : Correlation >= 0.4 and < 0.6
Very Weak : Correlation < 0.4
Displays correlation quality as a label on the chart for easy assessment.
Visual Enhancements:
Labels : Displays dynamic labels on the chart with metrics like M2 value and correlation.
Plot Shapes : Uses shapes to indicate data availability for global M2 and correlation.
Data Table : Optionally shows a data table in the top-right corner summarizing:
Global M2 value (in trillions)
The correlation between global M2 and BTC
The correlation quality
Optional Debugging:
Debug plots help identify when data is missing for M2 or correlation, ensuring transparency and accurate functionality.
Inputs:
Offset: Shift the M2 data (in days) to see past liquidity effects on Bitcoin.
Lookback Period: Number of periods (default 52) used to calculate the correlation.
Show Labels: Toggle to show or hide labels for M2 and correlation values.
Show Table: Toggle to show or hide the data table in the top-right corner.
Usage:
Ideal for traders and analysts seeking to understand the relationship between global liquidity and Bitcoin price. The offset and lookback period can be adjusted to explore different timeframes and correlation strengths, aiding more informed trading decisions.
Search in scripts for "BTC"

Z-Score + Valuation BTC | JeffreyTimmermansBTC Valuation Indicator with Z-Score Analysis
The BTC Valuation Indicator is a sophisticated tool designed to offer traders and analysts a deeper understanding of Bitcoin’s market valuation, empowering them to make more informed decisions. By utilizing a combination of key moving averages and a logarithmic trendline, along with advanced statistical analysis through the Z-Score Indicator, this tool provides a comprehensive view of Bitcoin’s potential undervaluation or overvaluation.
Key Features:
200MA/P (200-Day Moving Average to Price Ratio)
This component compares Bitcoin’s current price to its 200-day Simple Moving Average (SMA), offering insights into the long-term trend. A positive value signals a potential undervaluation of Bitcoin, while a negative value may indicate overvaluation.
Use case: Identifying long-term price trends to forecast potential buying or selling opportunities.
50MA/P (50-Day Moving Average to Price Ratio)
This ratio focuses on the short-term dynamics of Bitcoin’s price, comparing it to its 50-day SMA. It helps traders detect bullish or bearish trends in the immediate future.
Use case: Spotting short-term market movements and adjusting strategies accordingly.
LTL/P (Logarithmic TrendLine to Price Ratio)
This ratio incorporates Bitcoin’s historical age, using a logarithmic trendline to measure price movements against long-term expectations. A divergence from this trendline can signal potential overvaluation or undervaluation, assisting in aligning trading decisions with broader market trends.
Use case: Evaluating the overall trajectory of Bitcoin’s value over time and predicting significant market shifts.
Z-Score Indicator Integration:
The BTC Valuation Indicator utilizes the Z-Score, a powerful statistical measure, to assess how far each of the aforementioned ratios deviates from the mean. Z-Scores help standardize these ratios, allowing traders to gauge the severity of under or overvaluation compared to historical averages.
What is a Z-Score?
A Z-score measures how far a data point is from the mean in terms of standard deviations. A Z-score of 0 indicates the value is exactly at the mean, while a positive or negative score shows how much the value deviates from it. A higher Z-score signals a more significant deviation, potentially pointing to a market anomaly, while a Z-score near 0 indicates normal conditions.
For instance:
A Z-score above +2 indicates that Bitcoin may be overvalued, with the likelihood of a market correction or reversion to the mean.
A Z-score below -2 signals possible undervaluation, suggesting an upward trend may be on the horizon.
Z-Score and Market Volatility
The Z-Score Indicator can be used in conjunction with volatility measures, such as the CBOE Volatility Index (VIX), to forecast potential market volatility. Just as a Z-scored VIX above +2 suggests decreasing volatility and the possibility of an upward trend, a Z-scored VIX below -2 indicates increasing volatility and a potential downward trend. This parallel can be used to predict Bitcoin’s potential movements in times of market uncertainty.
How to Use:
The BTC Valuation Indicator, when paired with the Z-Score, provides a more refined statistical framework to analyze Bitcoin’s market conditions. This integration allows traders to assess the severity of potential trends and price anomalies, assisting in the identification of profitable entry and exit points.
Important Considerations:
No Guarantee of Market Predictions: While this indicator is a valuable tool for assessing market conditions, no indicator can guarantee future performance. Always consider multiple factors and use the indicator as part of a comprehensive strategy.
Market Dynamics:
As market conditions evolve, continuously refine your approach. Historical performance may not be indicative of future results, and traders should remain vigilant to changing trends and developments.
By combining the power of moving averages, logarithmic trend lines, and Z-scores, the BTC Valuation Indicator equips investors with a robust, data-driven approach to Bitcoin valuation, enhancing decision-making and enabling a more nuanced understanding of market dynamics.
-Jeffrey

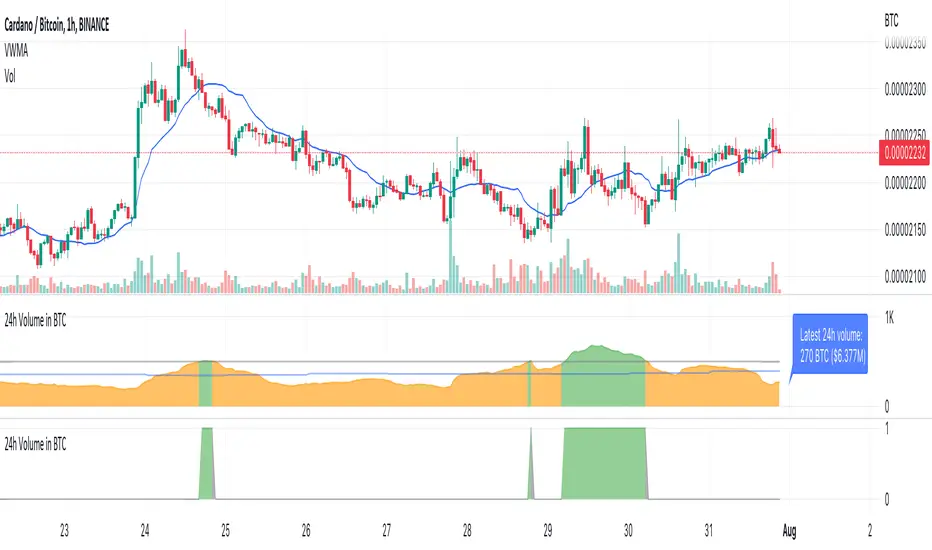
TTP Volume in BTCThis indicator shows you the volume of the last 24 hours of the current asset converted into BTC
The classic way to measure volume is by the base units of the asset itself being bought and sold in the selected timeframe. When trading crypto with bots it can be useful to filter out which assets/altcoins to trade by analysing the 24 hours-volume of the asset converted into Bitcoin instead of in the asset itself. By using Volume in BTC as a reference between assets you can rate and identify key levels of volume using the same reference and identify if an assets has enough liquidity for your personal requirements. You can also ensure assets are only traded when the volume is above your set threshold if you set this in your bots.
The volume is measured from the sum of the last 24 hourly closed candles multiplied with the average price during this period → 24h Vol * VWMA (Volume Weighted Moving Average).
What it does?
Measures the asset volume for the last 24 hrs converted to BTC
Regardless of chart timeframe it always shows you the last 24 hrs volume
Does not repaint, it uses only confirmed data by candle close
Shows the latest 24 hours of volume in BTC counted from the bar
Shows the latest 24 hours volume in BTC and USD as a label on the latest bar
It is color coded to show when it’s above or below your threshold visually
How to use it?
Use the Volume Threshold to identify periods when the volume is above or below your threshold
Set alerts to get alerted when the volume crosses your threshold in either direction
[BCT] Can BTC be predicted or is it purely random?Variance Ratio**This indicator can be applied to the ticker of your choice (not just BTC)**
Markets are said to be "efficient". An efficient market is by definition unpredictable - no matter the amount of ML, computation, or indicators thrown at it. In particular, in an efficient market, TA will not be of help.
An illustration of efficient markets is the WSJ's longstanding monkey vs. human contest:Blindfolded Monkey Beats Humans With Stock Picks, granted there are several flaws to it.
BTC is a relatively new market. New markets are typically highly inefficient (easier to make money) and become more and more efficient over time (harder to make money). How much more efficient is BTC becoming?
We apply the Variance Ratio method and apply it to BTC.
BACKGROUND ON THE VARIANCE RATIO METHOD
Based on 1988 MacKinlay's seminal paper "Stock Market Prices do not Follow a Random Walk", the idea is to exploit a phenomenon called "variance scaling".
For those keen on looking into the math, the short version of it is under the assumption of iid (random walk) we have the following:
H0: Var(Sum(returns over K bars))=Sum(Var(returns over 1 bar))=k*Var(return over 1 bar)
We look to reject or not H0 depending on the observations.
In this script, we compare the variance of the (log) returns for the chart selected between:
(1) The (average) variance over k bars (call this Vk)
(2) The (average) variance over 1 bar (call this V1)
H0 simply says that Vk=k*V1 if the stock follows a random walk.
We compute the Variance Ratio VR(k)=Variance(returns over k bar)/(Sum(Var(returns over 1 bar)))-1
We then compute the associated Z-score which we chart out for a configurable k number of bars.
HOW TO INTERPRET THE CHART
The line drawn is the Z-Score for VR(k). It represents the number of standard deviations of VR(k) from 0 - the further out, the less random.
- If the line is close / hovers around 0, the ticker appears to follow a random walk (i.e. may not be predictable)
- If the line is consistently > 2 or <-2, the ticker likely does not follow a random walk (i.e. may have predictable features)
- If the line is positive, it means that the Variance on the k bars is larger than the variance on 1 bar (more variance on longer timeframes)
- If the line is negative, it means that the Variance on the k bars is smaller than the variance on 1 bar (more variance on smaller timeframes)
USE CASES
- Identify timeframes where you won't be able to make money
- Identify whether a stock cannot be predicted (forget about TA, indicators etc. -- a random walk is not predictable)
- Identify whether a stock is becoming less and less predictable (Z-score amplitude will decrease over time)
FEATURES
- select the number of K bar to compare vs. 1 bar (default = 16) - ideally a power of 2 but any other number will work. The chart is based off this selection
- select the lookback period for the analysis (500 bars by default)
- select the source to analyze (default = close, but you may select other inputs to calculate the returns from)
- results form the statistical tests on different K's in the table on the right/bottom side of the chart (H0 rejected = not random walk; H0 not rejected = it essentially looks rather random and we can't conclude that it's not a random walk)
COMMENTARY ON BTC
- It appears BTC's absolute value of the ZScore on the Variance Ratio is declining year after year - corroborating an increasingly efficient market as new participants join.
- However, we can still detect a fair amount of potential inefficiency using this simple test.
As usual, this is not investment advice. DYOR.
With love,
🐵BCT🐵

BTC期现基差指标 RTA-V1.2BTC期现基差指标 RTA-V1.2 来自RTA学院,作者Ruomise Lin,感谢Cqz提供建议。
★私人指标.仅供RTA学员与付费圈成员使用★
该指标根据【RTA 课程4.2 永续合约资金费率分析法】 编写。
指标作用:
用于分析数字货币市场BTC,BTCUSD永续合约与BTCUSD之间的基差关系,从而判断市场上期货市场多空人数情况与杠杆率高低。
当蓝色线(基差值)位于以下区间代表对市场方向为
黄色——震荡
绿色深——看涨
绿色浅——强烈看涨
红色浅——看跌
红色深——强烈看跌
功能说明:
精度选择 1.1版本更新
该指标拥有4种精度模式,分别为
低精度——超长期时间框架
中精度——长期时间框架
标准精度——中时间框架
高精度——短期时间框架
趋势线 1.2版本更新
趋势线来判断市场在长期时间框架及以上BTC价格所处的价格位置。
有任何意见或者建议请联系作者,联系方式请看签名。
--------------------------------------------------------------------------------------
以下为英文谷歌翻译。
BTC futures basis indicator RTA-V1.2 comes from RTA Academy, author Ruomise Lin.
Private indicators. Only for RTA students and members of the paid circle.
This indicator is compiled according to .
Indicator function:
It is used to analyze the basis relationship between the digital currency market BTC, BTCUSD perpetual contract and BTCUSD, so as to determine the number of long and short positions in the futures market and the level of leverage.
When the blue line (basis value) is in the following interval, it means that the market direction is
Yellow-shock
Green deep-bullish
Light green-strongly bullish
Light red-bearish
Deep red-strong bearish
Function Description:
Precision selection
The indicator has 4 accuracy modes, namely
Low accuracy-ultra long time frame
Medium precision-long-term time frame
Standard accuracy-medium time frame
High precision-short time frame
Trendline
The trend line is used to determine the price position of the BTC price in the long-term time frame and above.

BITMEX Bybit binance HUOBI OKCOIN BTC DMI ATR DPO TREND AlertBITMEX Bybit binance HUOBI OKCOIN BTC DMI ATR DPO TREND Alert
This is a very effective trend strategy.
Strategy principle
HOW TO USE
set long position when a green arrow appears in the chart.
set short position when a red arrow appears in the chart.
For the long position and the short direction, you can set the stop profit & stop loss or trailing profit stop & trailing stop loss respectively.
When a purple arrow appears to close a position, an aggressive trader can go in the opposite direction when it is purple.
Strategy applicability
The default setting is for bitmex perpetual swap contract XBTUSD , bybit BTCUSD perpetual futures contract ,binance btcusdt Spot,Bitfinex BTCUSD Spot,bitflyer BTCJPY Spot,bithumb BTCKRW Spot,bitso BTCMXN Spot, bitstamp BTCUSD Spot,bittrex BTCUSDT Spot,Coinbase BTCUSD spot, deribit BTCPERP perpetual futures contract,gemini BTCUSD Spot,Hitbit BTCUSDT Spot,huobi BTCUSDT Spot KRAKEN XBTUSD spot,OKCOIN OKEX BTCUSD3M BTCUSD BTCUSD2W,Poloniex BTCUSDT Spot etc btc symbol with 30 minutes timeframe.
This indicator has broad applicability and can be applied to multiple different symbols.
This indicator also applies to the ETHUSD symbol etc, just adjust the default configuration.
Using the alert of the indicator, it can work well on the trading robot like Gunbot,autoview, without repaint false signals.
这是非常有效的趋势策略。
如何使用
在图表中出现绿色箭头就做多。
在图表中出现红色箭头就做空。
对于多头头寸和空头方向,您可以分别设置止损和止损或尾随利润止损和尾随止损;当出现紫色箭头时平仓,激进的交易者,可以在紫色时就做反方向。
策略适用性
默认设置是针对bitmex交易所 XBTUSD永久掉期合约,BYBIT交易所 BTCUSD永续期货合约,binance币安交易所 btcusdt现货,Bitfinex交易所 BTCUSD现货,bitflyer交易所 BTCJPY现货,bithumb交易所 BTCKRW现货,bitso交易所 BTCMXN现货,bitstamp交易所 BTCUSD现货,bittrex交易所 BTCUSDT现货,Coinbase交易所 BTCUSD现货,deribit交易所 BTCPERP永续期货合约,gemini双子星交易所 BTCUSD现货,Hitbit交易所 BTCUSDT现货,huobi火币交易所 BTCUSDT现货,KRAKEN交易所 XBTUSD现货,OKCOIN OKEX交易所 BTCUSD3M OK BTC季度合约 BTCUSD BTCUSD2W OK BTC次周合约,Poloniex BTCUSDT现货等2小时区间的btc交易。
Bitmex XBTUSD 30分钟 比特币期货 30 minutes Futures
这个指标具有广泛的适用性,可以适用多个不同交易品种。
该指标还适用于ETHUSD,ETHBTC,ADABTC,TRXBTC,XRPBTC交易品种等,只需调整默认配置即可。
Bitmex ETHUSD 30分钟 以太币期货 30 minutes Futures
使用该指标的警报设置,它可以在自动交易机器人上很好地工作,而无重绘错误的信号。

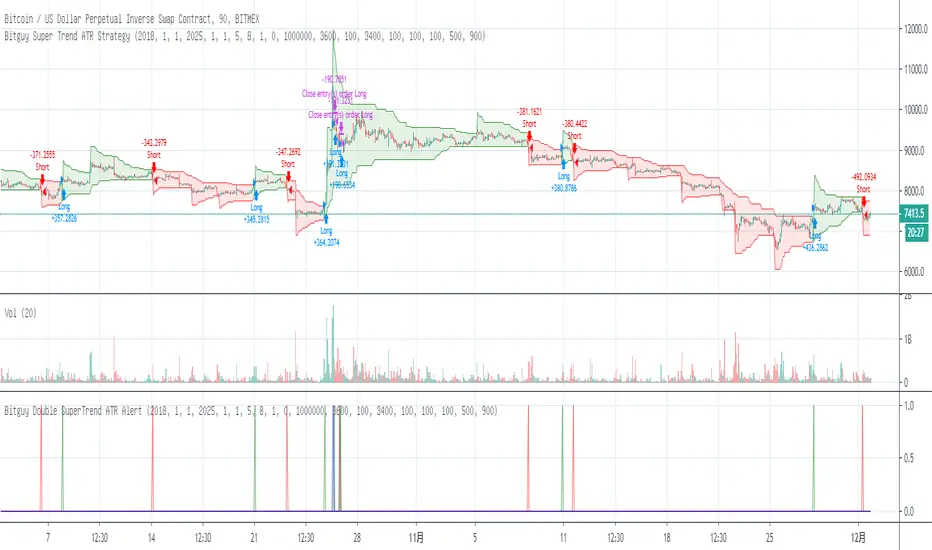
BITMEX Bybit binance HUOBI OKCOIN BTC ETH TREND ATR alertBITMEX Bybit binance HUOBI Coinbase OKCOIN BTC ETH TREND ATR alert
This is a very effective trend strategy.
Strategy principle
HOW TO USE
set long position when a green arrow appears in the chart.
set short position when a red arrow appears in the chart.
For the long position and the short direction, you can set the stop profit & stop loss or trailing profit stop & trailing stop loss respectively.
When a purple arrow appears to close a position, an aggressive trader can go in the opposite direction when it is purple.
Strategy applicability
The default setting is for bitmex perpetual swap contract XBTUSD , bybit BTCUSD perpetual futures contract ,binance btcusdt Spot,Bitfinex BTCUSD Spot,bitflyer BTCJPY Spot,bithumb BTCKRW Spot,bitso BTCMXN Spot, bitstamp BTCUSD Spot,bittrex BTCUSDT Spot,Coinbase BTCUSD spot, deribit BTCPERP perpetual futures contract,gemini BTCUSD Spot,Hitbit BTCUSDT Spot,huobi BTCUSDT Spot KRAKEN XBTUSD spot,OKCOIN OKEX BTCUSD3M BTCUSD BTCUSD2W,Poloniex BTCUSDT Spot etc btc symbol with 30 minutes timeframe.
This indicator has broad applicability and can be applied to multiple different symbols.
This indicator also applies to the ETHUSD symbol etc, just adjust the default configuration.
Using the alert of the indicator, it can work well on the trading robot like Gunbot,autoview, without repaint false signals.
这是非常有效的趋势策略。
如何使用
在图表中出现绿色箭头就做多。
在图表中出现红色箭头就做空。
对于多头头寸和空头方向,您可以分别设置止损和止损或尾随利润止损和尾随止损;当出现紫色箭头时平仓,激进的交易者,可以在紫色时就做反方向。
策略适用性
默认设置是针对bitmex交易所 XBTUSD永久掉期合约,BYBIT交易所 BTCUSD永续期货合约,binance币安交易所 btcusdt现货,Bitfinex交易所 BTCUSD现货,bitflyer交易所 BTCJPY现货,bithumb交易所 BTCKRW现货,bitso交易所 BTCMXN现货,bitstamp交易所 BTCUSD现货,bittrex交易所 BTCUSDT现货,Coinbase交易所 BTCUSD现货,deribit交易所 BTCPERP永续期货合约,gemini双子星交易所 BTCUSD现货,Hitbit交易所 BTCUSDT现货,huobi火币交易所 BTCUSDT现货,KRAKEN交易所 XBTUSD现货,OKCOIN OKEX交易所 BTCUSD3M OK BTC季度合约 BTCUSD BTCUSD2W OK BTC次周合约,Poloniex BTCUSDT现货等2小时区间的btc交易。
Bitmex XBTUSD 90分钟 比特币期货 90 minutes Bitcoin Futures
Bitmex XBTUSD 2H 比特币现货 2 hours Bitcoin Futures
Bitmex XBTUSD 16分钟 比特币期货 90 minutes Bitcoin Futures
这个指标具有广泛的适用性,可以适用多个不同交易品种。
该指标还适用于ETHUSD交易品种等,只需调整默认配置即可。
Bitmex ETHUSD 2H 以太币合约
Bitmex ETHUSD 30 以太币合约
Bybit ETHUSD 30分钟合约
使用该指标的警报设置,它可以在自动交易机器人上很好地工作,而无重绘错误的信号。
Pi Cycle BTC Top + Pre-Alert BandsPi Cycle BTC Top + Pre-Alert Bands is an advanced implementation of the classic Pi Cycle Top model, designed for Bitcoin cycle analysis on higher timeframes (especially 1D BTCUSD/BTCUSD·INDEX).
The original Pi Cycle Top uses two moving averages:
• 111-day SMA (short MA)
• 350-day SMA ×2 (long MA)
A Pi Top is signaled when the 111 SMA crosses above the 350×2 SMA. Historically, this has occurred near major BTC cycle highs.
This script extends that idea with a 3-step early-warning sequence:
• Pi Green – early compression: short/long MA ratio crosses upward into the green band (convergence from below is required).
• Pi Yellow – mid-cycle warning: only fires if a valid Green has already occurred in the same cycle.
• Pi Cycle Top – final top: the classic Pi Cycle cross, limited to one top signal per cycle. After a top, no new Yellow or Top signals can appear until a new Green event starts the next cycle.
Background shading shows the active phase (Green / Yellow / late-cycle zone), so you can see at a glance where BTC is within its Pi-based macro structure.
All logic is non-repainting: request.security() uses lookahead_off and no future data is accessed.
Typical use
This indicator is intended as a macro-cycle timing and risk-awareness tool, not a stand-alone entry system. Many traders use it to:
• Watch for Pi Green as the start of a potential late-cycle advance.
• Treat Pi Yellow as a rising-risk environment and tighten risk management.
• Use the Pi Cycle Top as a historical high-risk zone where large profit-taking or hedging may be considered.
Always combine this with your own analysis (trend, volume, on-chain, macro) before making decisions.
How to set alerts
Add the indicator to your chart (1D BTCUSD or BTCUSD·INDEX recommended).
Click Alerts → Condition → Pi Cycle BTC Top + Pre-Alert Bands.
Choose one of:
• Pi Cycle – Green Pre-Alert (early convergence)
• Pi Cycle – Yellow Pre-Alert (after Green only)
• Pi Cycle – TOP (Single per Cycle, after Green)
Use “Once per bar close” for higher-timeframe reliability.
Disclaimer
This tool is for educational and analytical purposes only. The Pi Cycle concept is based on historical behavior and does not guarantee future results. This is not financial advice; always do your own research and manage risk appropriately.

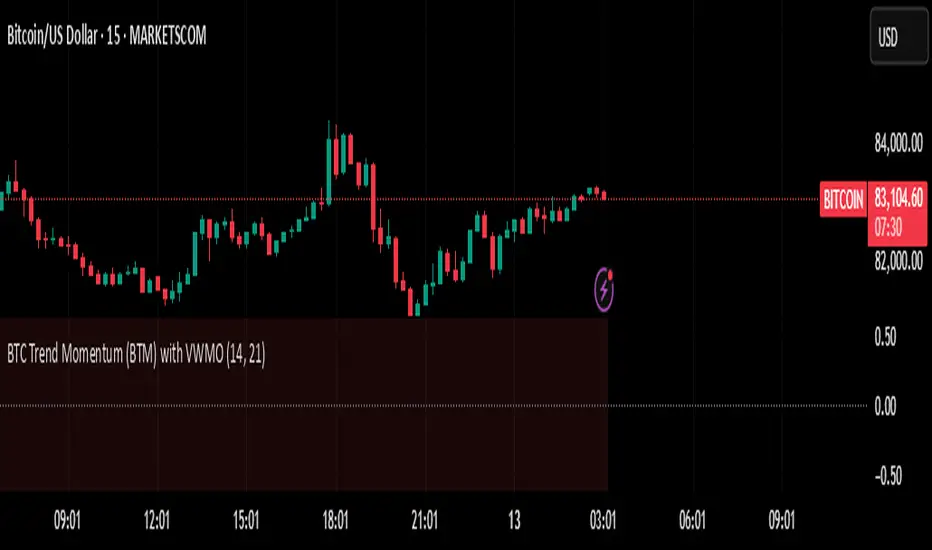
BTC Trend Momentum (BTM) with VWMOBTC Trend Momentum (BTM) with VWMO – A Smarter Way to Trade Bitcoin 🚀
Overview
Bitcoin price movements can be volatile, often leading to fake breakouts and whipsaws that mislead traders. BTC Trend Momentum (BTM), combined with Volume Weighted Moving Average (VWMO), helps smooth out market noise and provide clearer trend signals.
This script integrates momentum analysis, trend strength detection, and zero-line crossovers, allowing traders to make smarter entries and exits while avoiding false signals.
⸻
Why Use This Indicator?
✅ Momentum Histogram – Easily visualize trend strength with color-coded bars.
✅ Volume-Weighted Analysis – Uses VWMO to filter out weak price movements.
✅ Zero Line Crossover Alerts – Identifies major trend shifts in real-time.
✅ Dynamic Color Coding – Stronger trends highlighted in brighter colors.
✅ Background Shading – Differentiates bullish & bearish zones for easy trend reading.
✅ Built-in Alerts – Get notified of trade opportunities instantly.
⸻
How to Trade Using BTC Trend Momentum (BTM)
🔹 Buy Signal: When the momentum histogram (green bars) crosses above the EMA (orange line).
🔹 Sell Signal: When the momentum histogram (red bars) crosses below the EMA.
🔹 Strong Trend Confirmation: If histogram bars turn lime (bullish) or maroon (bearish), it indicates strong momentum.
🔹 Zero Line Crossovers: A bullish crossover above zero confirms an uptrend, while a bearish crossover below zero confirms a downtrend.
For better results, combine with RSI, MACD, or VWAP to confirm trend strength before entering trades.
⸻
Best Timeframes for Trading
📌 1H & 4H – Ideal for swing trading Bitcoin.
📌 5M & 15M – Perfect for scalping BTC with precision.
⸻
💡 Would you integrate BTC Trend Momentum (BTM) into your trading strategy? Let us know your thoughts below!
TOTAL3/BTC This Pine Script™ code, named "TOTAL3/BTC with Arrow," is designed for cryptocurrency analysis on TradingView.
This script essentially provides a visual tool for traders to gauge when altcoins might be gaining or losing ground relative to Bitcoin through moving average analysis and color-coded trend indication.
Intention was to help the community with a script based on classic TA only.
Use it with SASDv2r indicator.
Feel free to make it better. If you did so, please let me know.
Main elements:
Data Fetching: It retrieves market cap data for all cryptocurrencies excluding Bitcoin and Ethereum (TOTAL3) and for Bitcoin (BTC).
Ratio Calculation: The script calculates the ratio of TOTAL3 to BTC market caps, which indicates how altcoins (excluding ETH) are performing relative to Bitcoin.
Plotting the Ratio: This ratio is plotted on the chart with a blue line, allowing traders to see the relative performance visually.
Moving Averages: Two Simple Moving Averages (SMA) are calculated for this ratio, one for 20 periods (ma20) and another for 50 periods (ma50), though these are not plotted in the current version of the code.
Reference Lines: Horizontal lines are added at ratios of 0.3 and 0.8 to serve as visual equilibrium points or thresholds for analysis.
Complex Moving Average: The script uses constants (len, len2, cc, smoothe) from another script, suggesting it's adapting or simplifying another's logic for multi-timeframe analysis.
Average Calculation: Two SMAs (avg and avg2) are computed using the constants defined, focusing on different lengths for trend analysis.
Direction Determination: It checks if the moving average is trending up or down by comparing the current value with its value smoothe bars earlier.
Color Coding: The color of the plotted moving average changes based on its direction (lime for up, red for down, aqua if no clear direction), aiding in quick visual interpretation of trends.
Plotting: Finally, the script plots this multi-timeframe moving average with a dynamic color to reflect the current market trend of the TOTAL3/BTC ratio, with a thicker line for visibility.

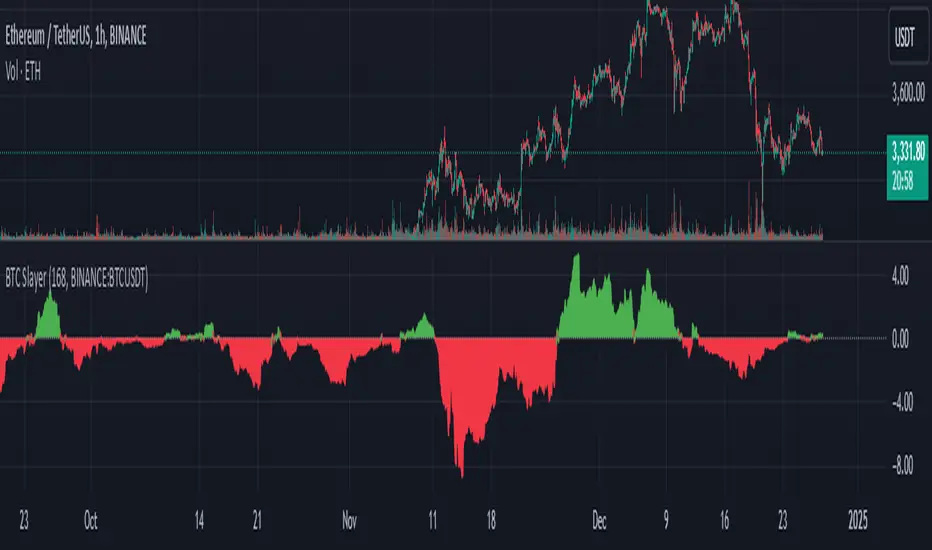
BTC Slayer 9000 - Relative Risk-adjusted performanceBTC Slayer 9000: Relative Risk-Adjusted Performance
Dear friends and fellow traders,
I am pleased to introduce the BTC Slayer 9000, a script designed to provide clear insights into risk-adjusted performance relative to a benchmark. Whether you're navigating the volatile world of cryptocurrencies or exploring opportunities in stocks, this tool helps you make informed decisions by comparing assets against your chosen benchmark.
What Does It Do?
This indicator is based on the Ulcer Index (UI), a metric that measures downside risk. It calculates the Ulcer Performance Index (UPI), which combines returns and downside risk, and compares it to a benchmark (like BTC/USDT, SPY500, or any trading pair).
The result is the Relative UPI (RUPI):
Positive RUPI (green area): The asset's risk-adjusted performance is better than the benchmark.
Negative RUPI (red area): The asset's risk-adjusted performance is worse than the benchmark.
Why Use It?
Risk vs. Reward: See if the extra risk of an asset is justified by its returns.
Customizable Benchmark: Compare any asset against BTC, SPY500, or another chart.
Dynamic Insights: Quickly identify outperforming assets for long positions and underperformers for potential shorts.
How to Use:
Inputs:
Adjust the lookback period to set the time frame for analysis. 720 Period is meant to represent 30 days. I like to use 168 period because I do not hold trades for long.
Choose your comparison chart (e.g., BTC/USDT, SPY500, AAPL, etc.).
Interpretation:
Green Area Above 0: The asset offers better risk-adjusted returns than the benchmark.
Red Area Below 0: The benchmark is a safer or more rewarding option.
Perfect for All Traders
Whether you:
Trade Cryptocurrencies: Compare altcoins to BTC.
Invest in Stocks: Compare individual stocks to indices like SPY500.
Evaluate Portfolio Options: Decide between assets like AAPL or TSLA.
This indicator equips you with a systematic way to evaluate "Is the extra risk worth it?".
The script was compiled in Collaboration with ChatGPT
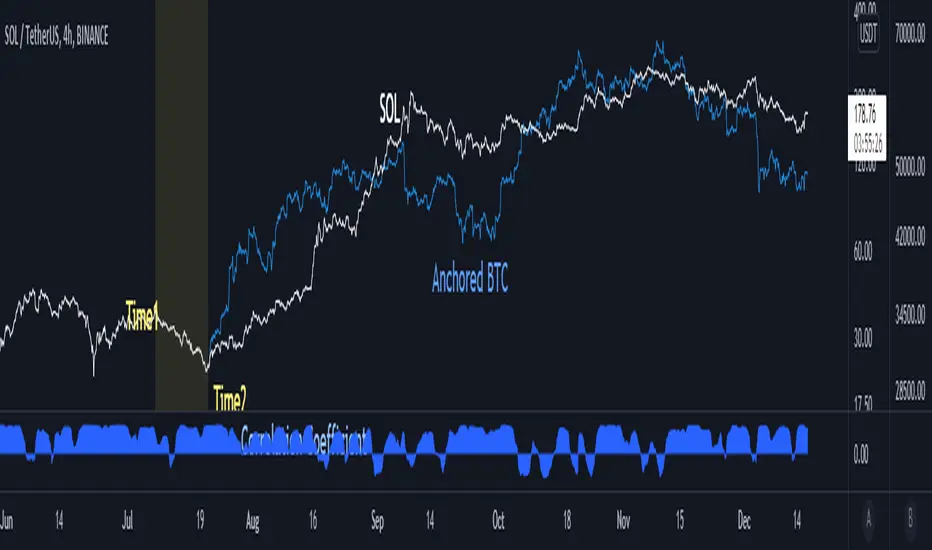
Anchored BTCIntroduce
When looking at altcoins and bitcoins together and seeing coupling and decoupling, we add a bitcoin chart in the "Compare" tab.
We checked where the coupling occurs in "Auto" mode, but if we move the chart, the overlapped position will change.
So I created the “Anchored BTC” indicator, which made the Bitcoin chart immovable.
How to use
First, add a bitcoin chart in the "Compare" tab and compare it with the altcoin chart.
And add the "Correlation Coefficient" built-in indicator to find the part where the correlation coefficient is 0.8 or higher.(it means finding well coupled part)
Among them, set the swing high or swing low part to Time1 and Time2.
Check if it looks the same as the existing BTC chart and you are done.
소개
알트코인과 비트코인을 함께 보며 커플링과 디커플링을 볼 때 우리는 비교 탭에서 비트코인 차트를 추가하여 봅니다.
"오토" 모드로 어느 부분에서 커플링이 일어나는지 체크했는데 차트를 옮기면 겹쳐놓아졌던 위치가 달라지게됩니다.
그래서 "Anchored BTC" 지표를 만들어, 비트코인 차트가 움직이지 못하게 만들었습니다.
사용법
우선 비교탭에서 비트코인차트를 추가하여 알트코인 차트와 비교해봅니다.
그리고 "상관계수" 빌트인 지표를 추가하여 상관계수가 0.8이상인 부분을 찾습니다.(커플링한 부분을 찾는겁니다)
이 중에서 스윙하이나 스윙로우인 부분을 Time1, Time2로 맞춰줍니다.
기존의 BTC차트와 동일하게 보여지는지 확인하면 끝납니다.
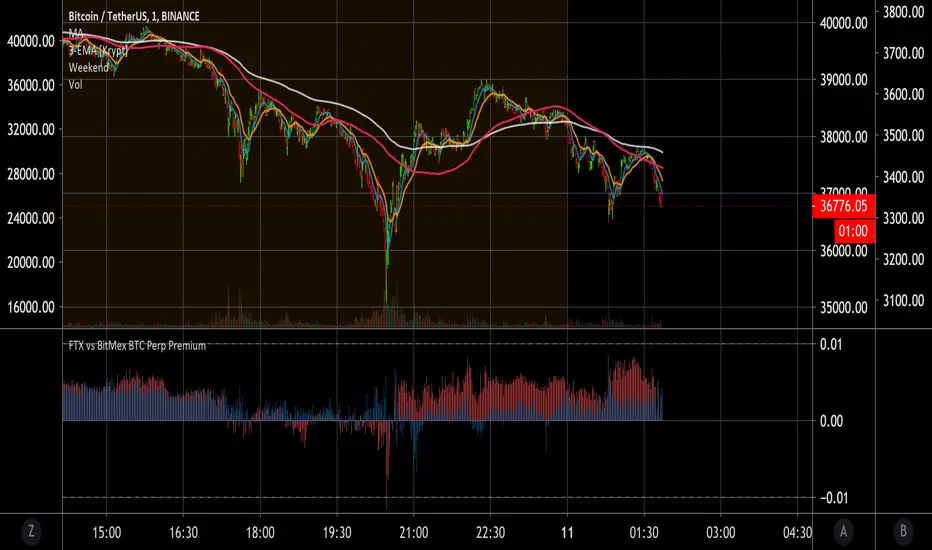
FTX vs BitMex BTC Perp PremiumThis script compares FTX BTC/PERP (BTC perpetual futures contract) price to Binance BTC/USDT spot and colors it red. It also plots Bitmex's BTC perpetual futures compared to Binance spot and colors it blue.
FTX = red
Bitmex = blue
Now you can easily see that you can get a 1% discount on FTX perpetuals when it is tanking. This tells you that you can set your limit buy orders extra low if you like to catch crashes. Also, you can see what your average trader on each platform is willing to pay above or below the spot premium. In general you want to do the opposite of what the average trading is doing on these exchanges unless you're in the main bull or mania phase of the Bitcoin cycle.
If you want to use Bitstamp or your favorite exchange it can be changed in the settings. Let me know if you find any settings that work well for you.
May you profit and enjoy! :)
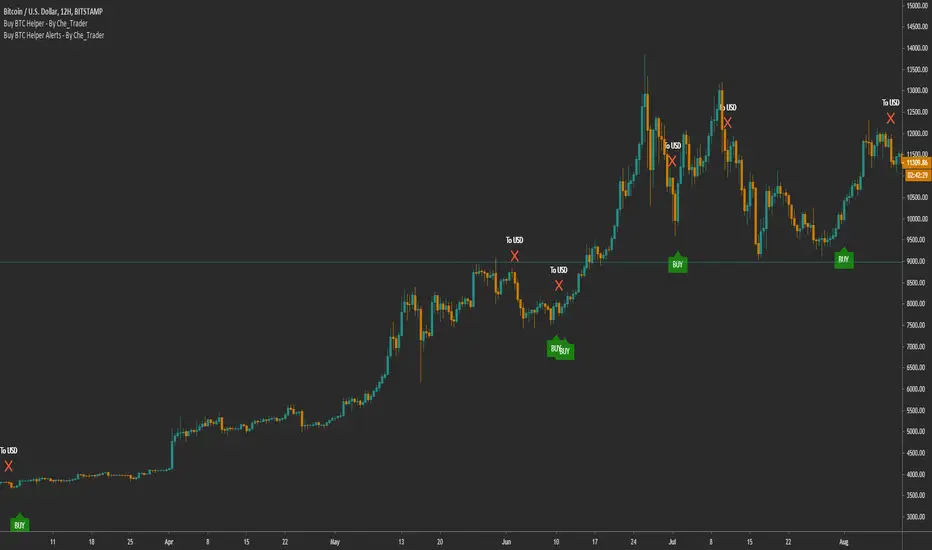
Buy BTC Helper -* Buy SPOT, sell to USD -Alerts- By Che_TraderThis is the alert version of my strategy
"Buy BTC Helper - Buy SPOT, sell to USD (BTC-ETH) - By Che_Trader"
For more information visit the link below
*****************************************************************************************************************************************************************************
To get access, you can send me a PM here or at a link in the tradingview profile.
*****************************************************************************************************************************************************************************
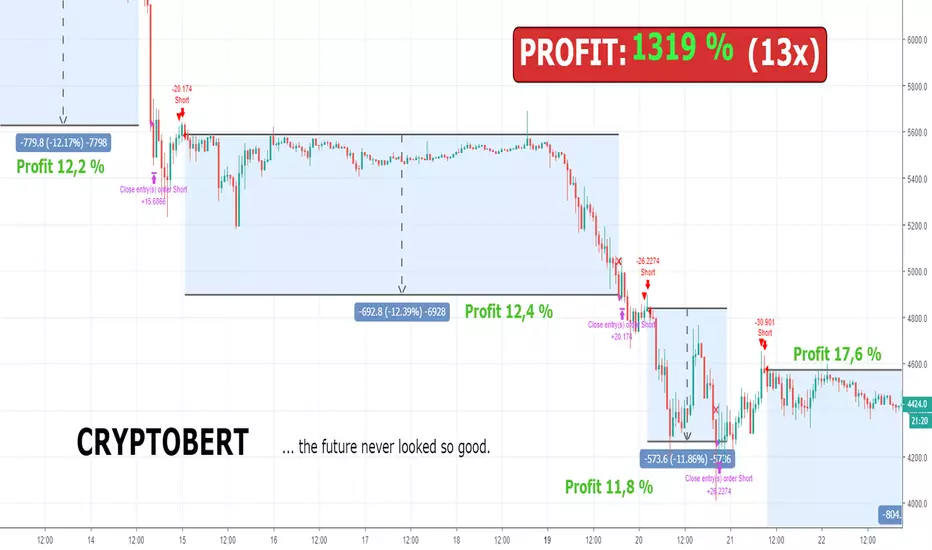
Bert LONG BTC Study (Alerts) - Profit 2018: 1319 % (no leverage)Bert LONG Term BTC study (BITMEX) - script for setting alerts and trading bots
This is a revolutionary strategy for bitcoin (XBT) trading. The strategy is perfectly configured for trading on the Bitmex exchange. No further configuration and setup is required.
The strategy itself recognizes a volatile period or whether the market is in downtrend, uptrend or sideways. Accordingly, it applies the appropriate orders to reach maximum profit.
The strategy can be handled manually, you can receive alerts (popup, email, sms) or can be fully automated by bot (works with: Autoview, Gunbot, Profitview, Jubot and others) without any manual intervention.
What is the minimum and maximum capital I can trade with?
You can trade with 0.0001BTC – 1000BTC. That is one of many advantages of using this strategy on XBT. There is enough liquidity to execute the order for the market price with a big investment amount.
What is the recommended setting?
Timeframe: 45m
Chart: Bitcoin/USD Dollar Perpetual Inverse Swap Contract (XBT)
Leverage: 2x
Orders: Long and Shorts
Why was this strategy created?
You have basically two option how to make money in crypto market. HODL (buy the coin and believe it will rise to the moon) and TRADING (only 3-5% traders are profitable, most of them are full time traders with 5+ years of experience in trading).
If you HODL btc in this year, you are -70 % this year
If you are TRADING, the results depend on how good you are (think about this, if you decide to be a heart surgeon, rocket star or NBA player, do you think you can be? Yes, you can but the chances are very small. The same probability you have that you will be in the 3-5% profitable traders 😊). It takes time, you need experience and still 96% all of you will never be a profitable traders!
If you use Bert BTC long term strategy, you are + 1319 % this year
How well the Bert BTC strategy performs?
Profit in 2018 was 1319 % / 13x (without leverage)
Profit in 2018 was 11 477 % / 115x (with leverage 2)
If you invested (with leverage 2) 1 000 USD you have now 114 766 USD
If you invested (with leverage 2) 10 000 USD you have now 1 147 660 USD
Detailed trades report for 2018 (you can calculate your own profit with specific investments and leverage) – download excel here
Notes:
You will hardly find better strategy on the market which achieves similar results with minimal risk and can operate in any market condition (downtrend, uptrend, sideways).
We guarantee the strategy does not repaint, and we use real candles (not heikin ashi or renko which does not reflect real prices).
We wish you to become financially independent and all your secret wishes to be fulfilled.
And in case if you still want to HODL or you want to be TRADING all the days watching to your monitors, consider to try our strategy at least with a minimum capital invested, you will see that you will not regret in long run. Be patient and the money will come to you!
For access to this strategy visit website: www.cryptobert.io
SSABU TOTAL / BTC / ETH / USDT Dominance
✅ TOTAL / BTC / ETH / USDT Dominance (total market cap / beat / ethernet / share) indicator.
This indicator is a supplementary indicator for the market share of TOTAL Market Cap / BTC / ETH / USDT.
You can check the above occupation rate in real time through the check box of the input. By default, only the dominance of the bit is set to come out.
If you want to see a different share of the bit, check the check box in the input box.
The above screen shot shows only the dominance of the default setting bit.
✅ TOTAL / BTC / ETH / USDT Dominance (총 마캣캡 / 비트 / 이더 / 유에스디티 점유율) 지표입니다.
본 지표는 TOTAL Market Cap / BTC / ETH / USDT의 점유율을 확인 할 수 있는 보조지표 입니다.
인풋의 체크박스를 통하여 위의 점유율을 실시간으로 확인 할 수 있고 기본으로는 비트의 도미넌스만 나오도록 설정하였습니다.
비트 외의 다른 점유율을 보고 싶으시면 인풋에서 체크박스 체크해주시면 확인 가능합니다.
위의 스크린샷은 기본설정인 비트의 도미넌스만 적용한 모습입니다.
✅ 매매에 도움되는 다른 보조지표
Basel ver 2.21

DepthHouse BTC Momentum Oscillator [BTC MO]NOTE: Only Works on BTC.
All testing was done on 1hr Timeframe
This is a experimental indicator - use at your own risk.
DepthHouse BTC Momentum Oscillator is an advanced tool to help determine Bitcoin Market Momentum.
---BTC MO SIgnals---
Signal Line: Generally, if the Signal Line is greater than 0, then there is more bullish momentum in the market
Tops & Bottoms: Signals used to help spot where BTC momentum may have topped or bottomed out
Possible Divergences: Used to help spot possible reversals on continuous trends
---oh92's Preset Setting---
Scalper: (20,11,17,6) Very reactive settings that I use while day trading. However, faster settings generally increase the chance of false signals(20,11,17,6)
Swing Trader: (5,25,55,10) Greatly reduces noise for my longer time trades. Generally makes 'tops' and 'bottoms' more accurate. Which can be a huge advantsge in spoting an earnly trend reversal
Custom: Allows user adjustments of all settings
---Built-in-Alerts---
Tops
Bottoms
Bearish Divergences
Bullish Divergences
Signal Line Crossovers
Try this indicator for FREE! Just leave a comment, or feel free to send me a PM

BTC GOD — DEFINITIVE BTC MULTI INDICATORBTC GOD — The Ultimate Bitcoin Cycle Indicator (2025 Edition)
The one indicator every serious BTC holder and trader has been waiting for.
A single script that perfectly combines the 5 most powerful and accurate Bitcoin indicators ever created — all 100 % official versions:
- Official Pi Cycle Top (LookIntoBitcoin) → in 2013, 2017 & 2021 (3/3 hits)
- Official MVRV Z-Score (Glassnode / LookIntoBitcoin) → every major bottom (2015, 2018–19, 2022)
- Dynamic Bull/Bear background (red bear-market when price drops X % from cycle ATH + monthly RSI filter)
- Monthly Golden/Death Cross (50-month EMA vs 200-week EMA) → huge, unmistakable signals
- SuperTrend + 200-week EMA + 50-month EMA
- Cycle ATH/ATL tracking with flashing alert in the table when new highs/lows are made
- Exact days to/from the next halving + optimal accumulation zone (200–750 days post-halving)
- Fully customizable inputs for experienced traders
Zero repainting. Zero errors. Works on every timeframe.
This is the indicator used by people who truly understand Bitcoin’s 4-year cycles.
If you could only keep ONE Bitcoin indicator for the rest of your life… this would be it.
Save it, test it, and you’ll instantly see why it’s called BTC GOD.
Built with love and obsession for Bitcoin cycles.
Last update: November 2025

BTC Spread: Coinbase Spot vs CME Futures (skullcap)BTC Spread: Coinbase Spot vs CME Futures
This indicator plots the real-time spread between Coinbase Spot BTC (COINBASE:BTCUSD) and CME Bitcoin Futures (CME:BTC1!).
It allows traders to monitor the premium or discount between spot and futures markets directly in one chart.
⸻
📊 How it Works
• The script pulls Coinbase spot BTC closing prices and CME front-month BTC futures prices on your selected timeframe.
• The spread is calculated as:
Spread = CME Price – Coinbase Spot Price
🔧 How to Use
1. Add the indicator to your chart (set to any timeframe you prefer).
2. The orange line represents the spread (USD difference).
3. The grey dashed line marks the zero level (parity between CME and Coinbase).
4. Use it to:
• Compare futures vs. spot market structure
• Track premium/discount cycles around funding or expiry
• Identify arbitrage opportunities or market dislocations
⸻
⚠️ Notes
• This indicator is informational only and does not provide trading signals.
• Useful for traders analysing derivatives vs spot price action.
• Works best when paired with order flow, funding rate, and open interest data.

BTC Coinbase Premium Index (Adjusted for USDC/USDT)BTC Coinbase Premium Index (Adjusted for USDC/USDT):
監測Coinbase(美國主流交易所)和Binance(全球最大交易所)之間的BTC價格溢價,讓你及時判斷美國投機者的市場情緒或趨勢轉向。與外面類似指標不同的是,它考慮了USDT的匯率波動(透過USDC/USDT調整),避免了USDT脫鉤導致的假訊號,讓數據更精準可靠。
BTC Coinbase Premium Index (Adjusted for USDC/USDT):
This index monitors the BTC price premium between Coinbase (a major US exchange) and Binance (the world's largest exchange), allowing you to promptly assess US speculator sentiment or trend shifts. Unlike similar indicators, it incorporates USDT exchange rate fluctuations (adjusted via USDC/USDT), avoiding false signals caused by USDT decoupling and ensuring more accurate and reliable data.

BTC & SPX vs Yield Curve: Recession Risk ZonesBTC & SPX vs Yield Curve – Recession Risk Zones
This tool helps you track Bitcoin (BTC) and the S&P 500 (SPX) against key macro signals from the U.S. yield curve to spot potential recession risks.
🟪 Color Legend:
🔴 Red = Yield curve is inverted (warning starts)
🟡 Yellow = Projected 6–18 month recession risk (if inversion still active)
🟠 Orange = Active 6–18 month risk window (after inversion ends)
💜 Fuchsia = Real historical U.S. recessions
📈 What’s Plotted:
🔵 BTCUSD (blue line) – Normalized price
🟢 S&P 500 (green line) – Normalized price
🟠 10Y–2Y Yield Spread – Macro signal for risk
✅ Use it to:
Spot macro pressure zones
See how BTC and SPX behave around economic stress
Stay cautious when red/orange/yellow areas appear
Let me know if you'd like to enable toggles to hide/show BTC or SPX independently!

Bitcoin PivotFind [BTC Cycle Tops & Bottoms Finder]What is PivotFind?
PivotFind is a custom indicator designed to track 30+ data points of different nature (technical, sentiment, macro, on-chain), and across multiple timeframes (from 1D to 60D), to detect the market conditions that may indicate the formation of potential Cycle Tops and Bottoms .
PivotFind's goal is to help you navigate Bitcoin's price movements and key happenings over its approximately 4-year cycles to help you craft a mid-term investment plan focused on the larger swings, rather than the shorter-term fluctuations.
What Does PivotFind Show/Do?
Market Phase Assessment and Visualization:
- Uses color-coded backgrounds (green for bull, red for bear, yellow for trend reversal) to show the current (assessed) market phase. Note that the price line itself changes color to reinforce the current phase identification.
- Helps you understand if we're in a uptrend, downtrend, or potentially changing direction (reversal), often an open question for traders, with a mid-term horizon
Cycle Top and Bottom Warnings:
- Places red dots above the price line to warn of potential cycle peaks.
- Shows green dots below the price line to indicate possible cycle bottoms.
These markers appear when multiple indicators reach certain thresholds, which historically have often coincided with significant market pivots (from bull to bear, or viceversa). Clusters of tops and bottom warnings are expected to appear at truly pivotal moments.
Parabolic Growth Signals:
- Displays upward arrows when conditions suggest potential for the rapid price increases that historically anticipated blow-off tops
- These signals are based on a combination of technical indicators and market sentiment reaching certain thresholds.
Altcoin Season Indicators:
- Marks with white diamonds the conditions that have historically led to "altseasons" (i.e. Altcoins overperforming BTC's growth rate).
- Based on factors like Bitcoin dominance decrease and certain altcoin performance metrics.
Fibonacci Retracement Bands:
Plots long-term support and resistance zones based on Fibonacci retracement levels.
These bands are calculated from previous major market highs and lows and shed light on the nature of short-term retracements in the context of major trends.
Price Scenario
PivotFind also provides reference price levels for the upcoming halving cycle, including potential thresholds for increased market interest (retail FOMO), possible overvaluation, and theoretical cycle peak ranges. These projections are based on historical data and should be considered as points of reference rather than definitive predictions.
Comprehensive Data Tables:
Right-side Table: Shows current cycle stage, Bitcoin/Altcoin market dominance percentages, and evaluates key economic factors (like inflation and interest rates) for their potential impact.
Bottom Table: Displays real-time values of over 30 key indicators, including RSI, MVRV ratio, and Fear & Greed Index.
Alerts
PivotFind offers you the ability to set up custom alerts (via the standard TradingView alert functionality) or receive automated notifications for significant market events. Despite its sophisticated analysis, PivotFind is designed to be user-friendly, with pre-set parameters that don't require complex adjustments.
How Does It Work?
PivotFind analyzes over 30 different indicators across multiple timeframes (from 1 day to 60 days), grouped into four main categories:
1. Technical Analysis:
Uses standard indicators like RSI, Stochastic RSI, Williams %R, Elliot Oscillator, TDI, and mean reversion concepts.
Looks for divergences between price and multiple indicators (like OBV, MFI, CCI, RSI, SRSI, MACD and others) to spot potential reversals.
2. Market Sentiment:
Incorporates the Crypto Fear & Greed Index (0-100 scale).
Tracks social media trends and influencer follower counts as a gauge of public interest.
3. Macroeconomic Factors:
Monitors inflation rates, interest rates, US rate yields, and money supply (M2) figures.
Tracks the U.S. Dollar Index (DXY) and bond market health through ETFs like TLT and HYG.
4. On-Chain Analytics:
Analyzes MVRV (Market Value to Realized Value) ratio to spot potential over/undervaluation.
Examines NUPL (Net Unrealized Profit/Loss) and active Bitcoin addresses.
PivotFind analyzes these indicators collectively, looking for significant correlations and confluences, to provide a view of the market's position within the 4-year cycle and spot the conditions for potential Cycle tops and bottoms (cycle pivots).
Who Is This For?
PivotFind may be particularly useful for:
- Long-term investors looking to optimize entry and exit points within the 4-year cycle
- Individuals who want to understand mid-term trends without engaging in daily analysis of multiple charts (due to lack of time and/or financial knowledge)
- Bitcoin Holders and miners planning their decisions around critical market pivot points
It's less suitable for scalpers, day-traders or those focused on short-term price movements.
Value Proposition
PivotFind simplifies market analysis by bringing together a wide range of indicators and data sources across different timeframes. It uses built-in logic to interpret these inputs within the context of Bitcoin's cycles, giving users an efficient way to spot potential major market shifts. This all-in-one approach helps make sense of complex market conditions and supports more informed decision-making.
Since Bitcoin’s broader cycle strongly influences the entire crypto market, PivotFind can also be useful for investors who are focused on Altcoins, not just Bitcoin.
Important Note (Disclaimer)
Past performance, and patterns, do not guarantee future results. Therefore, PivotFind should be used as one of many tools in your analysis. While the indicator provides a multi-faceted and multi-timeframe analysis of factors historically correlated with pivotal price shifts, it cannot predict future prices with certainty. It's a tool to help inform your decisions, not make them for you. Always conduct your own research and remember that all investments, especially in cryptocurrencies, involve risk.
Recommended Settings
PivotFinds works best on the 1D INDEX:BTCUSD chart (dark-mode, logarithmic scale).
This indicator is not publicly available and requires special access.

Current to BTC [Morty]This indicator helps you find strong bull altcoin, it shows the ratio of the current symbol to BTC.
Donchian Channels help to identify trends.
Alts Bull coins:
When BTC goes sideway, they pump first.
Alts Bear coins:
When BTC goes sideway, they move sideway.
When BTC goes down, they go down harder.
