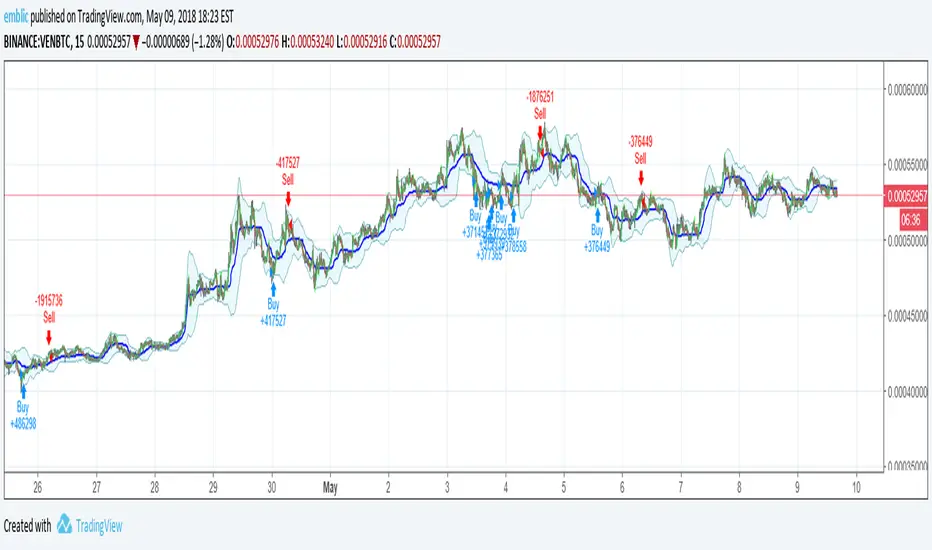
BoneDry Modified StrategyThis is a modified version of the BoneDry strategy (developed by BoneDryCalves), a popular strategy used with the Cryptohopper trading bot. The strategy uses DCA to make purchases, buying when the closing price falls below the lower bollinger band and a set RSI oversold threshold. It sells at a set % profit.
The original settings for BoneDry are as follows:
RSI period – 4
RSI Oversold Threshold – 37
Bollinger Bands Period – 22
Bollinger Band Upper Deviation – 2
Bollinger Band Lower Deviation – 2
Bollinger Band MA-Type – SMA (many use KAMA or TRIMA)
RSI Period – 4
RSI Oversold Threshold - 37
The differences with this script from the original strategy:
Instead of buying when the price drops below the lower bollinger band, it buys when a moving average crosses above it. This reduces the total amount of purchases and hopefully makes better buys.
Multiple moving average types for the Buy/Sell line are available, and the source of the MA can be changed.
Instead of selling at set percentage it sells when the MA crosses below the upper bollinger band. The intent of this is to exit out at better times for more profit and reduce losses.
The source for the bollinger band can be changed. It was hoped that by allowing this, an additional few percent profit could potentially be squeezed out.
Heikin-Ashi Candles are available as an option.
The displayed chart uses the following settings (there are likely better settings):
Length – 22
BB source – close
STDdev Upper-2.2
STDdev Lower-2.2
BB MA Type – KAMA
LMSA Offset – 1
RSI Period – 8
RSI Source – close
RSI Buy-In Value – 34
MA Type For Buy And Sell Line – LSMA
Buy and Sell Line Length – 2
Buy And Sell Line Source – close
The time period tested is from 4/20/2018 to 5/9/2019
Search in scripts for "Buy sell"
Volume Profile + VAH, VAL, and POCWhat it is
A clean, on-chart volume profile that approximates your visible range using a configurable Bars Back window. It builds a horizontal histogram of volume by price, splits each price bin into Buy vs Sell volume, draws POC, and computes Value Area High/Low (VAH/VAL). A Stealth Mode toggle switches to a subtle grayscale palette for low-key charts.
Why this instead of the built-in VPVR?
Buy/Sell split per bin: See which prices were defended by buyers vs sellers, not just total volume.
Value Area from POC outward: Classic expansion method until the selected % of total volume (default 70%).
Sleek borders & Stealth Mode: Crisp bin outlines and a one-click professional colorway.
Deterministic & fast: No sessions or anchors needed—set your Bars Back and go.
How it works (under the hood)
Window selection – Pine can’t read your viewport, so we approximate it with Bars Back (user input).
Binning – The window’s price range is divided into N bins.
Volume allocation – For each bar in the window:
Distribute Across Hi–Lo (optional): Spread volume across all bins the bar overlaps, weighted by overlap; or
Single-price mode: Assign all volume to one bin using a representative price (hlc3).
Buy/Sell split (two methods):
Body Proportional (recommended): Split by relative up/down body size (|close−open|).
Up/Down Candle: 100% buy if close ≥ open, else 100% sell.
POC & VA: Point of Control is the bin with max total volume. VAH/VAL expands from POC toward the higher-volume neighbor until the selected % of total volume is included.
Reading the visuals
Horizontal bars (right side): Total volume per price bin.
Left sub-segment = Sell volume
Right sub-segment = Buy volume
POC line: Price level with peak total volume.
VAH / VAL (dashed): Upper and lower bounds of the selected Value Area.
Borders: Each bin has a clean outer outline so the profile looks tight and organized.
Stealth Mode: Grayscale palette that preserves contrast without loud colors.
Key inputs (organized for clarity)
Theme
Stealth Mode: Toggles the grayscale look.
Core
Price Bins: Vertical resolution of the profile.
Lookback (Bars): Approximates your visible range.
Style
Profile Width (bars): How far the histogram extends to the right.
Bin Border Width: Outline thickness.
Markers & Lines
Show POC, Show VAH/VAL, Value Area %, VA line width.
Advanced
Distribute Volume Across Hi–Lo: More accurate, heavier compute.
Buy/Sell Split Method: Body Proportional (realistic) or Up/Down (simple).
Tips & best practices
Start with Body Proportional + Distribute Across ON for intraday accuracy.
If the chart lags, reduce Price Bins or Bars Back, or switch off distribution.
For small windows, fewer bins often looks cleaner (e.g., 30–60).
Stealth Mode plays nicely with both dark and light chart themes.
Limitations & notes
Viewport: Pine can’t access the actual visible bars; Bars Back is a practical stand-in.
Buy/Sell split: This is an approximation from candle bodies, not true bid/ask delta.
Designed for overlay; profile renders to the right of the latest bar.

CVD Polarity Indicator (With Rolling Smoothed)📊 CVD Polarity Indicator (with Rolling Smoothing)
Purpose
The CVD Polarity Indicator combines Cumulative Volume Delta (CVD) with price bar direction to measure whether buying or selling pressure is in agreement with price action. It then smooths that signal over time, making it easier to see underlying volume-driven market trends.
This indicator is essentially a volume–price agreement oscillator:
- It compares price direction with volume delta (CVD).
- Translates that into per-bar polarity.
- Smooths it into a rolling sum for clarity.
- Adds a short EMA to highlight turning points.
The end result: a tool that helps you see when price action is backed by real volume flows versus when it’s running on weak participation.
__________________________________________________________________________________
1. Cumulative Volume Delta (CVD)
What it is:
CVD is the cumulative sum of buying vs. selling pressure measured by volume.
- If a bar closes higher than it opens → that bar’s volume is treated as buying pressure (+volume).
- If a bar closes lower than it opens → that bar’s volume is treated as selling pressure (–volume).
Rolling version:
Instead of accumulating indefinitely (which just creates a line that trends forever), this indicator uses a rolling sum over a user-defined number of bars (cumulation_length, default 14).
- This shows the net delta in recent bars, making the CVD more responsive and localized.
2. Bar Direction vs. CVD Change
Each bar has two pieces of directional information:
1. Bar direction: Whether the candle closed above or below its open (close - open).
2. CVD change: Whether cumulative delta increased or decreased from the prior bar (cvd - cvd ).
By comparing these two:
- Agreement (both up or both down):
→ Polarity = +volume (if bullish) or –volume (if bearish).
- Disagreement (bar up but CVD down, or bar down but CVD up):
→ Polarity flips sign, signaling divergence between price and volume.
Thus, raw polarity = a per-bar measure of whether price action and volume delta are in sync.
3. Polarity Smoothing (Rolling Polarity)
- Problem with raw polarity:
It flips bar-to-bar and looks very jagged — not great for seeing trends.
- Solution:
The indicator applies a rolling sum over the past polarity_length bars (default 14).
- This creates a smoother curve, representing the net polarity over time.
- Positive values = net bullish alignment (buyers stronger).
- Negative values = net bearish alignment (sellers stronger).
Think of it like an oscillator showing whether buyers or sellers have had control recently.
4. EMA Smoothing
Finally, a 10-period EMA is applied on top of the rolling polarity line:
- This further reduces noise.
- It helps highlight shifts in the underlying polarity trend.
- Crossovers of the polarity line and its EMA can serve as trade signals (bullish/bearish inflection points).
________________________________________________________________________________
How to Read It
1. Polarity above zero → Recent bars show more bullish agreement between price and volume.
2. Polarity below zero → Recent bars show more bearish agreement.
3. Polarity diverging from price → If price goes up but polarity trends down, it signals weakening buying pressure (potential reversal).
4. EMA crossovers →
- Polarity crossing above its EMA = bullish momentum shift.
- Polarity crossing below its EMA = bearish momentum shift.
Practical Use Cases
- Trend Confirmation
Use polarity to confirm whether a price move is supported by volume. If price rallies but
polarity stays negative, the move is weak.
- Divergence Signals
Watch for divergences between price trend and polarity trend (e.g., higher highs in price but
lower highs in polarity).
- Momentum Shifts
Use EMA crossovers as signals that the underlying balance of buying/selling has flipped.

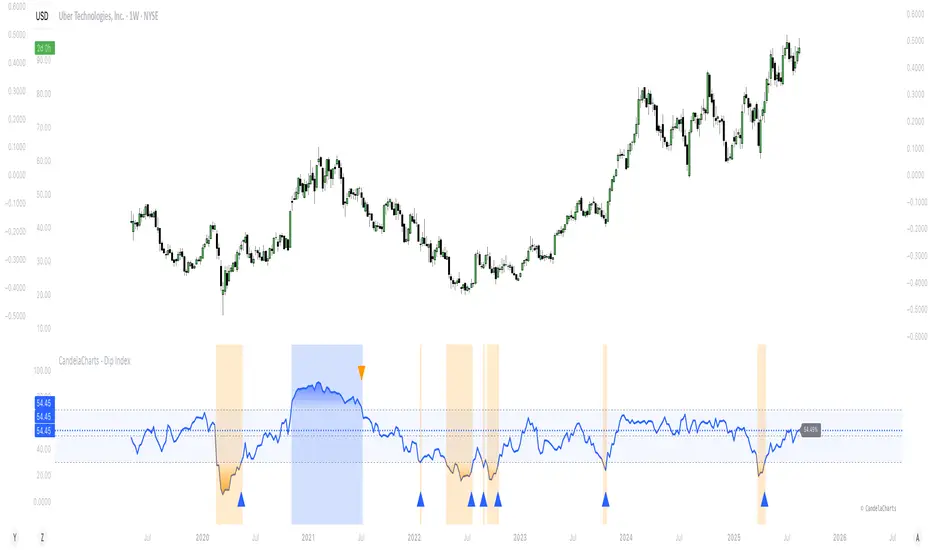
CandelaCharts - Dip Index 📝 Overview
The Dip Index (DIPX) is a market breadth oscillator designed to identify market dips by measuring the percentage of assets within a chosen index or asset class that are trading above a specified moving average (such as the 50, 100, 150, or 200-period).
By highlighting when fewer assets remain above their averages, DIPX helps traders detect potential dip opportunities and assess overall market strength or weakness.
While commonly applied to equities, the indicator is adaptable to various financial instruments, including exchange-traded funds (ETFs), commodities, cryptocurrencies, and even fixed-income securities.
Assess the overall health of a market by measuring internal participation in price moves.
Detect overbought or oversold conditions when momentum becomes concentrated or overly extended.
Generate actionable signals when the index exits extreme levels, suggesting renewed momentum or potential exhaustion.
📦 Features
Multiple Indices: Supports SP500, Nasdaq, DJI, Russel2000, and sector-specific S&P indices.
Dynamic MA Selection: Choose from SMA, EMA, RMA, WMA, VWMA with configurable lengths.
Visual Customization: Full control over colors, line styles, text size, and branding.
Signal Markers: Triangle markers appear when exiting overbought/oversold zones.
Gradient & Background Fill: Visual highlighting of extreme market conditions.
Overlay Mode Option: Can display OB/OS background as chart overlay.
⚙️ Settings
Market: Chooses the index or asset class to measure.
MA: Enables moving average filter; options include type (SMA, EMA, etc.) and period length.
Oversold: Defines the lower threshold (default: 20) with customizable color.
Overbought: Defines the upper threshold (default: 80) with customizable color.
DIPX Line: Sets the thickness and color of the Dip Index line.
Mode: Selects display type (Line, Cross, Circle, Stepline, etc.).
Signals: Toggles buy/sell signal markers with customizable colors.
OB/OS Zones: Enables highlighting of Overbought/Oversold zones.
OB/OS Overlay: Toggles overlay shading for Overbought/Oversold zones.
⚡️ Showcase
Overbought/Oversold
Modes
Overbought/Oversold Zones
Signals
Overlay
📒 Usage
How to use DIPX effectively in trading and analysis, including interpretation, signal usage, strategic applications, and best practices.
DIPX outputs values from 0% to 100%, reflecting how widely participation extends across the underlying assets in an index or basket.
1. Assessing Market Health
Use DIPX to evaluate whether price moves are supported by broad participation:
In a bull trend, confirm strength by checking if DIPX stays above 50%.
In a bear trend, watch for rebounds in DIPX to spot temporary relief rallies.
2. Detecting Divergences
Divergence occurs when the price trend and DIPX trend disagree — often a precursor to reversal.
Bearish Divergence: Price makes higher highs; DIPX makes lower highs -> Momentum weakening - potential top
Bullish Divergence: Price makes lower lows; DIPX makes higher lows -> Selling pressure fading - potential bottom
How to Spot It:
Overlay DIPX on the same chart as the index price.
Use trendlines or horizontal markers to compare swing points.
Focus on weekly or daily timeframes for reliability.
3. Signal-Based Entries/Exits
When enabled (Signals = true) , DIPX generates triangle markers when exiting extreme zones:
Bullish Triangle (▲): DIPX crosses above Oversold Value (e.g., 20%, 30%) -> Green upward triangle
Bearish Triangle (▼): DIPX crosses below Overbought Value (e.g., 80%, 70%) -> Red downward triangle
4. Timeframe Guidance
1m – 4h: ❌ Not Recommended - DIPX uses daily-aggregated data;
Daily (D): ✅ Strongly Recommended - Matches data frequency; clearest signals
Weekly (W): ✅ Acceptable - Ideal for macro analysis and long-term positioning
Monthly (M): ⚠️ Limited Use - Too slow for active trading; useful for big-picture context
By integrating DIPX into your analysis, you gain a powerful lens into market internals — helping you distinguish between broad-based strength and narrow leadership, regardless of asset class.
🚨 Alerts
The indicator does not provide any alerts!
⚠️ Disclaimer
These tools are exclusively available on the TradingView platform.
Our charting tools are intended solely for informational and educational purposes and should not be regarded as financial, investment, or trading advice. They are not designed to predict market movements or offer specific recommendations. Users should be aware that past performance is not indicative of future results and should not rely on these tools for financial decisions. By using these charting tools, the purchaser agrees that the seller and creator hold no responsibility for any decisions made based on information provided by the tools. The purchaser assumes full responsibility and liability for any actions taken and their consequences, including potential financial losses or investment outcomes that may result from the use of these products.
By purchasing, the customer acknowledges and accepts that neither the seller nor the creator is liable for any undesired outcomes stemming from the development, sale, or use of these products. Additionally, the purchaser agrees to indemnify the seller from any liability. If invited through the Friends and Family Program, the purchaser understands that any provided discount code applies only to the initial purchase of Candela's subscription. The purchaser is responsible for canceling or requesting cancellation of their subscription if they choose not to continue at the full retail price. In the event the purchaser no longer wishes to use the products, they must unsubscribe from the membership service, if applicable.
We do not offer reimbursements, refunds, or chargebacks. Once these Terms are accepted at the time of purchase, no reimbursements, refunds, or chargebacks will be issued under any circumstances.
By continuing to use these charting tools, the user confirms their understanding and acceptance of these Terms as outlined in this disclaimer.
BecakFloatingPanelsLibrary "BecakFloatingPanels"
Library for creating floating indicator panels with MACD, RSI, and Stochastic indicators
calculateMacd(source, fastLength, slowLength, signalLength)
Calculate MACD components
Parameters:
source (float) : Price source for calculation
fastLength (simple int) : Fast EMA period
slowLength (simple int) : Slow EMA period
signalLength (simple int) : Signal line period
Returns: MacdData MACD calculation results
calculateRsi(source, length)
Calculate RSI
Parameters:
source (float) : Price source for calculation
length (simple int) : RSI period
Returns: float RSI value
calculateStochastic(source, high, low, kLength, kSmoothing, dSmoothing)
Calculate Stochastic components
Parameters:
source (float) : Price source for calculation
high (float) : High prices
low (float) : Low prices
kLength (int) : %K period
kSmoothing (int) : %K smoothing period
dSmoothing (int) : %D smoothing period
Returns: StochData Stochastic calculation results
calculateStochSignals(stochK, stochD, overboughtLevel, oversoldLevel)
Calculate Stochastic signals
Parameters:
stochK (float) : Stochastic %K series
stochD (float) : Stochastic %D series
overboughtLevel (float) : Overbought threshold
oversoldLevel (float) : Oversold threshold
Returns: StochSignals Signal flags
calculateChartMetrics(high, low, lookbackLength)
Calculate chart range and positioning metrics
Parameters:
high (float) : High prices
low (float) : Low prices
lookbackLength (int) : Lookback period
Returns: ChartMetrics Chart positioning data
calculateMacdRange(macdLine, signalLine, histogram, safeLookback)
Calculate MACD range for normalization
Parameters:
macdLine (float) : MACD line series
signalLine (float) : Signal line series
histogram (float) : Histogram series
safeLookback (int) : Lookback period
Returns: MacdRange MACD range metrics
initVisualArrays()
Initialize visual arrays
Returns: VisualArrays Container with initialized arrays
clearVisuals(visuals)
Clear all visual elements
Parameters:
visuals (VisualArrays) : VisualArrays container
Returns: void
calculatePanelPositions(chartMetrics, oscPlacement, panelHeight, panelSpacing, centerOffset)
Calculate panel positions based on placement option
Parameters:
chartMetrics (ChartMetrics) : Chart metrics object
oscPlacement (string) : Panel placement option
panelHeight (float) : Panel height percentage
panelSpacing (float) : Panel spacing percentage
centerOffset (float) : Center offset percentage
Returns: PanelPositions Panel boundary coordinates
createPanelBackgrounds(visuals, positions, panelLeft, panelRight, showBackground, transparency)
Create panel backgrounds
Parameters:
visuals (VisualArrays) : VisualArrays container
positions (PanelPositions) : PanelPositions object
panelLeft (int) : Left boundary
panelRight (int) : Right boundary
showBackground (bool) : Show background flag
transparency (int) : Background transparency
Returns: void
drawReferenceLines(visuals, positions, chartMetrics, macdRange, dataLeft, dataRight, panelHeight, rsiOverbought, rsiOversold, stochOverbought, stochOversold)
Draw reference lines for all panels
Parameters:
visuals (VisualArrays) : VisualArrays container
positions (PanelPositions) : PanelPositions object
chartMetrics (ChartMetrics) : ChartMetrics object
macdRange (MacdRange) : MacdRange object
dataLeft (int) : Left data boundary
dataRight (int) : Right data boundary
panelHeight (float) : Panel height percentage
rsiOverbought (int) : RSI overbought level
rsiOversold (int) : RSI oversold level
stochOverbought (int) : Stochastic overbought level
stochOversold (int) : Stochastic oversold level
Returns: void
drawMacdIndicator(visuals, macdLine, signalLine, histogram, macdRange, positions, chartMetrics, barIndex, nextBarIndex, barIndexOffset, panelHeight)
Draw MACD indicator
Parameters:
visuals (VisualArrays) : VisualArrays container
macdLine (float) : MACD line series
signalLine (float) : Signal line series
histogram (float) : Histogram series
macdRange (MacdRange) : MacdRange object
positions (PanelPositions) : PanelPositions object
chartMetrics (ChartMetrics) : ChartMetrics object
barIndex (int) : Current bar index
nextBarIndex (int) : Next bar index
barIndexOffset (int) : Horizontal offset
panelHeight (float) : Panel height percentage
Returns: void
drawRsiIndicator(visuals, rsiValue, positions, chartMetrics, barIndex, nextBarIndex, barIndexOffset, panelHeight)
Draw RSI indicator
Parameters:
visuals (VisualArrays) : VisualArrays container
rsiValue (float) : RSI value
positions (PanelPositions) : PanelPositions object
chartMetrics (ChartMetrics) : ChartMetrics object
barIndex (int) : Current bar index
nextBarIndex (int) : Next bar index
barIndexOffset (int) : Horizontal offset
panelHeight (float) : Panel height percentage
Returns: void
drawStochasticIndicator(visuals, stochK, stochD, positions, chartMetrics, barIndex, nextBarIndex, barIndexOffset, panelHeight, stochOverbought, stochOversold)
Draw Stochastic indicator
Parameters:
visuals (VisualArrays) : VisualArrays container
stochK (float) : Stochastic %K series
stochD (float) : Stochastic %D series
positions (PanelPositions) : PanelPositions object
chartMetrics (ChartMetrics) : ChartMetrics object
barIndex (int) : Current bar index
nextBarIndex (int) : Next bar index
barIndexOffset (int) : Horizontal offset
panelHeight (float) : Panel height percentage
stochOverbought (int) : Overbought level
stochOversold (int) : Oversold level
Returns: void
addStochasticSignals(visuals, buySignal, sellSignal, positions, chartMetrics, currentBarIndex, barIndexOffset, panelHeight, signalIndex)
Add Stochastic buy/sell signals
Parameters:
visuals (VisualArrays) : VisualArrays container
buySignal (bool) : Buy signal series
sellSignal (bool) : Sell signal series
positions (PanelPositions) : PanelPositions object
chartMetrics (ChartMetrics) : ChartMetrics object
currentBarIndex (int) : Current bar index
barIndexOffset (int) : Horizontal offset
panelHeight (float) : Panel height percentage
signalIndex (int) : Signal index for lookback
Returns: void
setPanelLabels(macdLabel, rsiLabel, stochLabel, positions, chartMetrics, labelOffset, panelHeight, barIndexOffset)
Set panel title labels
Parameters:
macdLabel (label) : MACD label reference
rsiLabel (label) : RSI label reference
stochLabel (label) : Stochastic label reference
positions (PanelPositions) : PanelPositions object
chartMetrics (ChartMetrics) : ChartMetrics object
labelOffset (int) : Label horizontal offset
panelHeight (float) : Panel height percentage
barIndexOffset (int) : Horizontal offset
Returns: void
showDebugInfo(chartMetrics, debugMode)
Display debug information
Parameters:
chartMetrics (ChartMetrics) : ChartMetrics object
debugMode (bool) : Debug mode flag
Returns: void
ChartMetrics
Chart metrics container
Fields:
visibleHigh (series float) : Highest visible price
visibleLow (series float) : Lowest visible price
chartRange (series float) : Price range of chart
chartCenter (series float) : Center point of chart
MacdData
MACD calculation results
Fields:
macdLine (series float) : Main MACD line
signalLine (series float) : Signal line
histogram (series float) : MACD histogram
MacdRange
MACD range metrics for normalization
Fields:
highest (series float) : Highest MACD value
lowest (series float) : Lowest MACD value
BRange (series float) : Total range
StochData
Stochastic calculation results
Fields:
k_smooth (series float) : Smoothed %K line
d (series float) : %D line
StochSignals
Stochastic signals
Fields:
buySignal (series bool) : Buy signal flag
sellSignal (series bool) : Sell signal flag
PanelPositions
Panel positioning data
Fields:
macdTop (series float) : MACD panel top
macdBottom (series float) : MACD panel bottom
rsiTop (series float) : RSI panel top
rsiBottom (series float) : RSI panel bottom
stochTop (series float) : Stochastic panel top
stochBottom (series float) : Stochastic panel bottom
VisualArrays
Visual elements arrays container
Fields:
macdLines (array) : Array of MACD lines
macdHist (array) : Array of MACD histogram boxes
rsiLines (array) : Array of RSI lines
stochLines (array) : Array of Stochastic lines
stochAreas (array) : Array of Stochastic areas
stochSignals (array) : Array of Stochastic signals
panelBackgrounds (array) : Array of panel backgrounds

Wickless Tap Signals Wickless Tap Signals — TradingView Indicator (v6)
A precision signal-only tool that marks BUY/SELL events when price “retests” the base of a very strong impulse candle (no wick on the retest side) in the direction of trend.
What it does (in plain English)
Finds powerful impulse candles:
Bull case: a green candle with no lower wick (its open ≈ low).
Bear case: a red candle with no upper wick (its open ≈ high).
Confirms trend with an EMA filter:
Only looks for bullish bases while price is above the EMA.
Only looks for bearish bases while price is below the EMA.
Waits for the retest (“tap”):
Later, if price revisits the base of that wickless candle
Bullish: taps the candle’s low/open → BUY signal
Bearish: taps the candle’s high/open → SELL signal
Optional level “consumption” so each base can trigger one signal, not many.
The idea: a wickless impulse often marks strong initiative order flow. The first retest of that base frequently acts as a springboard (bull) or ceiling (bear).
Exact rules (formal)
Let tick = syminfo.mintick, tol = tapTicks * tick.
Trend filter
inUp = close > EMA(lenEMA)
inDn = close < EMA(lenEMA)
Wickless impulse candles (confirmed on bar close)
Bullish wickless: close > open and abs(low - open) ≤ tol
Bearish wickless: close < open and abs(high - open) ≤ tol
When such a candle closes with trend alignment:
Store bullTapLevel = low (for bull case) and its bar index.
Store bearTapLevel = high (for bear case) and its bar index.
Signals (must happen on a later bar than the origin)
BUY: low ≤ bullTapLevel + tol and inUp and bar_index > bullBarIdx
SELL: high ≥ bearTapLevel - tol and inDn and bar_index > bearBarIdx
One-shot option
If enabled, once a signal fires, the stored level is cleared so it won’t trigger again.
Inputs (Settings)
Trend EMA Length (lenEMA): Default 200.
Use 50–100 for intraday, 200 for swing/position.
Tap Tolerance (ticks) (tapTicks): Default 1.
Helps account for tiny feed discrepancies. Set 0 for strict equality.
One Signal per Level (oneShot): Default ON.
If OFF, multiple taps can create multiple signals.
Plot Tap Levels (plotLevels): Draws horizontal lines at active bases.
Show Pattern Labels (showLabels): Marks the origin wickless candles.
Plots & Visuals
EMA trend line for context.
Tap Levels:
Green line at bullish base (origin candle’s low/open).
Red line at bearish base (origin candle’s high/open).
Signals:
BUY: triangle-up below the bar on the tap.
SELL: triangle-down above the bar on the tap.
Labels (optional):
Marks the original wickless impulse candle that created each level.
Alerts
Two alert conditions are built in:
“BUY Signal” — fires when a bullish tap occurs.
“SELL Signal” — fires when a bearish tap occurs.
How to set:
Add the indicator to your chart.
Click Alerts (⏰) → Condition = this indicator.
Choose BUY Signal or SELL Signal.
Set your alert frequency and delivery method.
Recommended usage
Timeframes: Works on any; start with 5–15m intraday, or 1H–1D for swing.
Markets: Equities, futures, FX, crypto. For thin/illiquid assets, consider a slightly larger Tap Tolerance.
Confluence ideas (optional, but helpful):
Higher-timeframe trend agreeing with your chart timeframe.
Volume surge on the origin wickless candle.
S/R, order blocks, or SMC structures near the tap level.
Avoid major news moments when slippage is high.
No-repaint behavior
Origin patterns are detected only on bar close (barstate.isconfirmed), so bases are created with confirmed data.
Signals come after the origin bar, on subsequent taps.
There is no lookahead; lines and shapes reflect information known at the time.
(As with all real-time indicators, an intrabar tap can trigger an alert during the live bar; the signal then remains if that condition held at bar close.)
Known limitations & design choices
Single active level per side: The script tracks only the most recent bullish base and most recent bearish base.
Want a queue of multiple simultaneous bases? That’s possible with arrays; ask and we’ll extend it.
Heikin Ashi / non-standard candles: Wick definitions change; for consistent behavior use regular OHLC candles.
Gaps: On large gaps, taps can occur instantly at the open. Consider one-shot ON to avoid rapid repeats.
This is an indicator, not a strategy: It does not place trades or compute PnL. For backtesting, we can convert it into a strategy with SL/TP logic (ATR or structure-based).
Practical tips
Tap Tolerance:
If you miss obvious taps by a hair, increase to 1–2 ticks.
For FX/crypto with tiny ticks, even 0 or 1 is often enough.
EMA length:
Shorten for faster signals; lengthen for cleaner trend selection.
Risk management (manual suggestion):
For BUY signals, consider a stop slightly below the tap level (or ATR-based).
For SELL signals, consider a stop slightly above the tap level.
Scale out or trail using structure or ATR.
Quick checklist
✅ Price above EMA → watch for a green no-lower-wick candle → store its low → BUY on tap.
✅ Price below EMA → watch for a red no-upper-wick candle → store its high → SELL on tap.
✅ Use Tap Tolerance to avoid missing precise touches by one tick.
✅ Consider One Signal per Level to keep trades uncluttered.
FAQ
Q: Why did I not get a signal even though price touched the level?
A: Check Tap Tolerance (maybe too strict), trend alignment at the tap bar, and that the tap happened after the origin candle. Also confirm you’re on regular candles.
Q: Can I see multiple bases at once?
A: This version tracks the latest bull and bear bases. We can extend to arrays to keep N recent bases per side.
Q: Will it repaint?
A: No. Bases form on confirmed closes, and signals only on later bars.
Q: Can I backtest it?
A: This is a study. Ask for the strategy variant and we’ll add entries, exits, SL/TP, and stats.

ATAI Triangles — Volume-Based & Price Pattern Analysis (v1.01)ATAI Triangles — Volume-Based & Price Pattern Analysis (v1.01)
Overview
ATAI Triangles identifies two synchronized triangle structures — Hi-Lo-Hi (HLH) and Lo-Hi-Lo (LHL) — and analyzes them both geometrically and volumetrically. For each triangle, volume is split between its two legs (segments), providing interpretable insights into buyer vs seller activity along each path.
The idea is that certain geometric shapes, when paired with volume distribution on each leg, can reveal patterns worth exploring. Users are encouraged to share their observations and interpretations in the TradingView comments section so that more aspects of these triangle combinations can be discovered collectively.
Extra (for fun)
For a bit of entertainment, we’ve included a symbolic “hexagram” glyph that appears when both triangle types align in a particular way — it’s just a visual nod to geometry and has no predictive or trading value.
Interface & data clarity
- Inputs and parameters are organized by function (pattern geometry, volume analysis, visuals, HUD, labels).
- Each input includes tooltips explaining its purpose, units, and possible effects on calculations.
- All on-chart objects (polylines, labels, connectors) are named and colored to reflect their role, with volume values formatted in engineering notation (K, M, B).
- HUD columns and label texts use concise terms and consistent units, so that every displayed value is directly traceable to a calculation in the code.
- Daily and lower-timeframe volume series are clearly separated, with update logic documented to indicate intrabar provisional values vs finalized bar-close values.
Usage notes
Designed to be used alongside other indicators and chart tools for context; it is not a standalone signal generator.
All Buy/Sell volumes are absolute (non-negative); Δ = Buy − Sell.
Intrabar values update live and finalize at bar close (no repaint after close).
Disclaimer
For research, discussion, and educational purposes only. This is not financial advice and does not guarantee any outcome. Trade at your own risk.
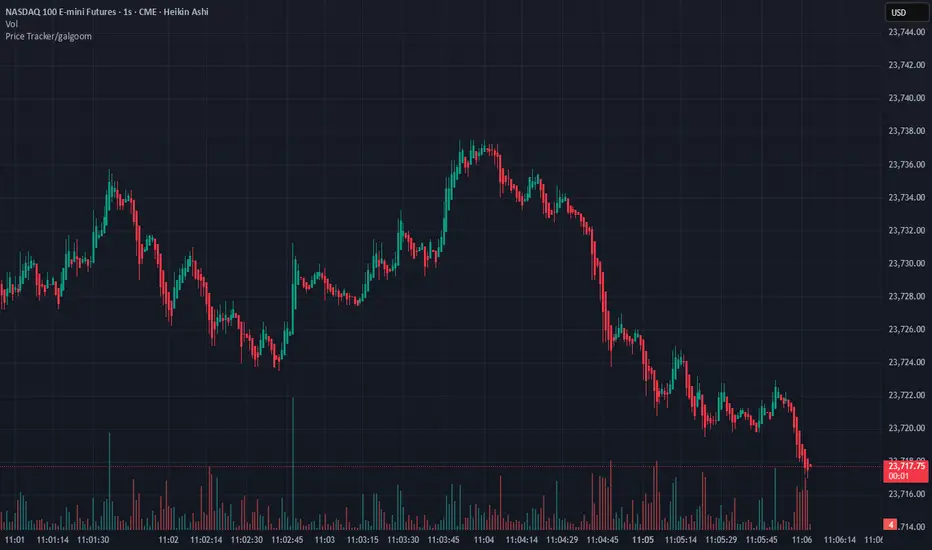
Price Tracker/galgoomThis indicator is designed for Renko chart traders who want to combine price action relative to a key line (qLine) with Moneyball buy/sell signals as a confirmation. It helps filter trades so you only get signals when both conditions align within a chosen time window.
How It Works
First Event – Price Trigger
Detects when the Renko close crosses above/below your selected qLine plot from the qPro indicator.
You can choose between:
Cross – only triggers on an actual crossover/crossunder.
State (Close) – triggers whenever price closes above/below qLine.
Second Event – Moneyball Confirmation
Waits for Moneyball’s Buy Signal (for long) or Bear/Sell Signal (for short) plot to fire.
You select the exact Moneyball plot from the source menu.
You can specify how the Moneyball signal is interpreted (== 1, >= 1, or any nonzero value).
Sequential Logic
The Moneyball signal must occur within N Renko bricks after the price event.
The final buy/sell signal is printed on the Moneyball bar.
Key Features
Works natively on Renko charts.
Adjustable confirmation window (0–5 bricks).
Flexible detection for both qLine and Moneyball signals.
Customizable label sizes, arrow display, and alerts.
Alerts fire for both buy and sell conditions:
BUY: qLine ➜ Moneyball Buy
SELL: qLine ➜ Moneyball Sell
Inputs
qLine Source – Pick the qPro qLine plot.
Price Event Type – Cross or State.
Moneyball Buy/Sell Signal Plots – Select the correct plots from your Moneyball indicator.
Confirmation Window – Bars allowed between events.
Visual Settings – Label size, arrow visibility, etc.
Use Case
Ideal for traders who:
Want a double-confirmation entry system.
Use Renko charts for cleaner trend detection.
Already have qPro and Moneyball loaded, but want an automated, rule-based confluence check.
38 minutes ago
Release Notes
This indicator is designed for Renko chart traders who want to combine price action relative to a key line (qLine) with Moneyball buy/sell signals as a confirmation. It helps filter trades so you only get signals when both conditions align within a chosen time window.
How It Works
First Event – Price Trigger
Detects when the Renko close crosses above/below your selected qLine plot from the qPro indicator.
You can choose between:
Cross – only triggers on an actual crossover/crossunder.
State (Close) – triggers whenever price closes above/below qLine.
Second Event – Moneyball Confirmation
Waits for Moneyball’s Buy Signal (for long) or Bear/Sell Signal (for short) plot to fire.
You select the exact Moneyball plot from the source menu.
You can specify how the Moneyball signal is interpreted (== 1, >= 1, or any nonzero value).
Sequential Logic
The Moneyball signal must occur within N Renko bricks after the price event.
The final buy/sell signal is printed on the Moneyball bar.
Key Features
Works natively on Renko charts.
Adjustable confirmation window (0–5 bricks).
Flexible detection for both qLine and Moneyball signals.
Customizable label sizes, arrow display, and alerts.
Alerts fire for both buy and sell conditions:
BUY: qLine ➜ Moneyball Buy
SELL: qLine ➜ Moneyball Sell
Inputs
qLine Source – Pick the qPro qLine plot.
Price Event Type – Cross or State.
Moneyball Buy/Sell Signal Plots – Select the correct plots from your Moneyball indicator.
Confirmation Window – Bars allowed between events.
Visual Settings – Label size, arrow visibility, etc.
Use Case
Ideal for traders who:
Want a double-confirmation entry system.
Use Renko charts for cleaner trend detection.
Already have qPro and Moneyball loaded, but want an automated, rule-based confluence check.
OctaScalp Precision Pro [By TraderMan]What is OctaScalp Precision Pro ? 🚀
OctaScalp Precision is a powerful scalping indicator designed for fast, short-term trades. It combines eight technical indicators to generate 💪 high-accuracy buy 📗 and sell 📕 signals. Optimized for scalpers, this tool targets small price movements in low timeframes (1M, 5M). With visual lines 📈, labels 🎯, and Telegram alerts 📬, it simplifies quick decision-making, enhances risk management, and tracks trade performance.
What Does It Do? 🎯
Fast Signals: Produces reliable buy/sell signals using a consensus of eight indicators.
Risk Management: Offers automated Take Profit (TP) 🟢 and Stop Loss (SL) 🔴 levels with a 2:1 reward/risk ratio.
Trend Confirmation: Validates short-term trends with a 30-period EMA zone.
Performance Tracking: Records trade success rates (%) and the last 5 trades 📊.
User-Friendly: Displays market strength, signal type, and trade details in a top-right table.
Alerts: Sends Telegram-compatible notifications for new positions and trade results 📲.
How Does It Work? 🛠️
OctaScalp Precision integrates eight technical indicators (RSI, MACD, Stochastic, Momentum, 200-period EMA, Supertrend, CCI, OBV) for robust analysis. Each indicator contributes 0 or 1 point to a bullish 📈 or bearish 📉 score (max 8 points). Signals are generated as follows:
Buy Signal 📗: Bullish score ≥6 and higher than bearish score.
Sell Signal 📕: Bearish score ≥6 and higher than bullish score.
EMA Zone 📏: A zone (default 0.1%) around a 30-period EMA confirms trends. Price staying above or below the zone for 4 bars validates the direction:
Up Direction: Price above zone, color green 🟢.
Down Direction: Price below zone, color red 🔴.
Neutral: Price within zone, color gray ⚪.
Entry/Exit: Entries are triggered on new signals, with TP (2% profit) and SL (1% risk) auto-calculated.
Table & Alerts: Displays market strength (% bull/bear), signal type, entry/TP/SL, and success rate in a table. Telegram alerts provide instant notifications.
How to Use It? 📚
Setup 🖥️:
Add the indicator to TradingView and use default settings or customize (EMA length, zone width, etc.).
Best for low timeframes (1M, 5M).
Signal Monitoring 🔍:
Check the table: Bull Strength 📗 and Bear Strength 📕 percentages indicate signal reliability.
Confirm Buy (📗 BUY) or Sell (📕 SELL) signals when trendSignal is 1 or -1.
Entering a Position 🎯:
Buy: trendSignal = 1, bullish score ≥6, and higher than bearish score, enter at the entry price.
Sell: trendSignal = -1, bearish score ≥6, and higher than bullish score, enter at the entry price.
TP and SL: Follow the green (TP) 🟢 and red (SL) 🔴 lines on the chart.
Exiting 🏁:
If price hits TP, trade is marked ✅ successful; if SL, marked ❌ failed.
Results are shown in the “Last 5 Trades” 📜 section of the table.
Setting Alerts 📬:
Enable alerts in TradingView. Receive Telegram notifications for new positions and trade outcomes.
Position Entry Strategy 💡
Entry Conditions:
For Buy: Bullish score ≥6, trendSignal = 1, price above EMA zone 🟢.
For Sell: Bearish score ≥6, trendSignal = -1, price below EMA zone 🔴.
Check bull/bear strength in the table (70%+ is ideal for strong signals).
Additional Confirmation:
Use on high-volume assets (e.g., BTC/USD, EUR/USD).
Validate signals with support/resistance levels.
Be cautious in ranging markets; false signals may increase.
Risk Management:
Stick to the 2:1 reward/risk ratio (TP 2%, SL 1%).
Limit position size to 1-2% of your account.
Tips and Recommendations 🌟
Best Markets: Ideal for volatile markets (crypto, forex) and low timeframes (1M, 5M).
Settings: Adjust EMA length (default 30) or zone width (0.1%) based on the market.
Backtesting: Test on historical data to evaluate success rate 📊.
Discipline: Follow signals strictly and avoid emotional decisions.
OctaScalp Precision makes scalping fast, precise, and reliable! 🚀

Volume Based Analysis V 1.00
Volume Based Analysis V1.00 – Multi-Scenario Buyer/Seller Power & Volume Pressure Indicator
Description:
1. Overview
The Volume Based Analysis V1.00 indicator is a comprehensive tool for analyzing market dynamics using Buyer Power, Seller Power, and Volume Pressure scenarios. It detects 12 configurable scenarios combining volume-based calculations with price action to highlight potential bullish or bearish conditions.
When used in conjunction with other technical tools such as Ichimoku, Bollinger Bands, and trendline analysis, traders can gain a deeper and more reliable understanding of the market context surrounding each signal.
2. Key Features
12 Configurable Scenarios covering Buyer/Seller Power convergence, divergence, and dominance
Advanced Volume Pressure Analysis detecting when both buy/sell volumes exceed averages
Global Lookback System ensuring consistency across all calculations
Dominance Peak Module for identifying strongest buyer/seller dominance at structural pivots
Real-time Signal Statistics Table showing bullish/bearish counts and volume metrics
Fully customizable inputs (SMA lengths, multipliers, timeframes)
Visual chart markers (S01 to S12) for clear on-chart identification
3. Usage Guide
Enable/Disable Scenarios: Choose which signals to display based on your trading strategy
Fine-tune Parameters: Adjust SMA lengths, multipliers, and lookback periods to fit your market and timeframe
Timeframe Control: Use custom lower timeframes for refined up/down volume calculations
Combine with Other Indicators:
Ichimoku: Confirm volume-based bullish signals with cloud breakouts or trend confirmation
Bollinger Bands: Validate divergence/convergence signals with overbought/oversold zones
Trendlines: Spot high-probability signals at breakout or retest points
Signal Tables & Peaks: Read buy/sell volume dominance at a glance, and activate the Dominance Peak Module to highlight key turning points.
4. Example Scenarios & Suggested Images
Image #1 – S01 Bullish Convergence Above Zero
S01 activated, Buyer Power > 0, both buyer power slope & price slope positive, above-average buy volume. Show S01 ↑ marker below bar.
Image #2 – Combined with Ichimoku
Display a bullish scenario where price breaks above Ichimoku cloud while S01 or S09 bullish signal is active. Highlight both the volume-based marker and Ichimoku cloud breakout.
Image #3 – Combined with Bollinger Bands & Trendlines
Show a bearish S10 signal at the upper Bollinger Band near a descending trendline resistance. Highlight the confluence of the volume pressure signal with the band touch and trendline rejection.
Image #4 – Dominance Peak Module
Pivot low with green ▲ Bull Peak and pivot high with red ▼ Bear Peak, showing strong dominance counts.
Image #5 – Statistics Table in Action
Bottom-left table showing buy/sell volume, averages, and bullish/bearish counts during an active market phase.
5. Feedback & Collaboration
Your feedback and suggestions are welcome — they help improve and refine this system. If you discover interesting use cases or have ideas for new features, please share them in the script’s comments section on TradingView.
6. Disclaimer
This script is for educational purposes only. It is not financial advice. Past performance does not guarantee future results. Always do your own analysis before making trading decisions.
Tip: Use this tool alongside trend confirmation indicators for the most robust signal interpretation.

AI's Opinion Trading System V21. Complete Summary of the Indicator Script
AI’s Opinion Trading System V2 is an advanced, multi-factor trading tool designed for the TradingView platform. It combines several technical indicators (moving averages, RSI, MACD, ADX, ATR, and volume analysis) to generate buy, sell, and hold signals. The script features a customizable AI “consensus” engine that weighs multiple indicator signals, applies user-defined filters, and outputs actionable trade instructions with clear stop loss and take profit levels. The indicator also tracks sentiment, volume delta, and allows for advanced features like pyramiding (adding to positions), custom stop loss/take profit prices, and flexible signal confirmation logic. All key data and signals are displayed in a dynamic, color-coded table on the chart for easy review.
2. Full Explanation of the Table
The table is a real-time dashboard summarizing the indicator’s logic and recommendations for the most recent bars. It is color-coded for clarity and designed to help traders quickly understand market conditions and AI-driven trade signals.
Columns (from left to right):
Column Name What it Shows
Bar The time context: “Now” for the current bar, then “Bar -1”, “Bar -2”, etc. for previous bars.
Raw Consensus The raw AI consensus for each bar: “Buy”, “Sell”, or “-” (neutral).
Up Vol The amount of volume on up (rising) bars.
Down Vol The amount of volume on down (falling) bars.
Delta The difference between up and down volume. Green if positive, red if negative, gray if neutral.
Close The closing price for each bar, color-coded by price change.
Sentiment Diff The difference between the close and average sentiment price (a custom sentiment calculation).
Lookback The number of bars used for sentiment calculation (if enabled).
ADX The ADX value (trend strength).
ATR The ATR value (volatility measure).
Vol>Avg “Yes” (green) if volume is above average, “No” (red) otherwise.
Confirm Whether the AI signal is confirmed over the required bars.
Logic Output The AI’s interpreted signal after applying user-selected logic: “Buy”, “Sell”, or “-”.
Final Action The final signal after all filters: “Buy”, “Sell”, or “-”.
Trade Instruction A plain-English instruction: Buy/Sell/Add/Hold/No Action, with price, stop loss, and take profit.
Color Coding:
Green: Positive/bullish values or signals
Red: Negative/bearish values or signals
Gray: Neutral or inactive
Blue background: For all table cells, for visual clarity
White text: Default, except for color-coded cells
3. Full User Instructions for Every Input/Style Option
Below are plain-language instructions for every user-adjustable option in the indicator’s input and style pages:
Inputs
Table Location
What it does: Sets where the summary table appears on your chart.
How to use: Choose from 9 positions (Top Left, Top Center, Top Right, etc.) to avoid overlapping with other chart elements.
Decimal Places
What it does: Controls how many decimal places prices and values are displayed with.
How to use: Increase for assets with very small prices (e.g., SHIB), decrease for stocks or forex.
Show Sentiment Lookback?
What it does: Shows or hides the “Lookback” column in the table, which displays how many bars are used in the sentiment calculation.
How to use: Turn off if you want a simpler table.
AI View Mode
What it does: Selects the logic for how the AI combines signals from different indicators.
Majority: Follows the most common signal among all indicators.
Weighted: Uses custom weights for each type of signal.
Custom: Lets you define your own logic (see below).
How to use: Pick the logic style that matches your trading philosophy.
AI Consensus Weight / Vol Delta Weight / Sentiment Weight
What they do: When using “Weighted” AI View Mode, these let you set how much influence each factor (indicator consensus, volume delta, sentiment) has on the final signal.
How to use: Increase a weight to make that factor more important in the AI’s decision.
Custom AI View Logic
What it does: Lets advanced users write their own logic for when the AI should signal a trade (e.g., “ai==1 and delta>0 and sentiment>0”).
How to use: Only use if you understand basic boolean logic.
Use Custom Stop Loss/Take Profit Prices?
What it does: If enabled, you can enter your own fixed stop loss and take profit prices for buys and sells.
How to use: Turn on to override the auto-calculated SL/TP and enter your desired prices below.
Custom Buy/Sell Stop Loss/Take Profit Price
What they do: If custom SL/TP is enabled, these fields let you set exact prices for stop loss and take profit on both buy and sell trades.
How to use: Enter your preferred price, or leave at 0 for auto-calculation.
Sentiment Lookback
What it does: Sets how many bars the sentiment calculation should look back.
How to use: Increase to smooth out sentiment, decrease for faster reaction.
Max Pyramid Adds
What it does: Limits how many times you can add to an existing position (pyramiding).
How to use: Set to 1 for no adds, higher for more aggressive scaling in trends.
Signal Preset
What it does: Quick-sets a group of signal parameters (see below) for “Robust”, “Standard”, “Freedom”, or “Custom”.
How to use: Pick a preset, or select “Custom” to adjust everything manually.
Min Bars for Signal Confirmation
What it does: Sets how many bars a signal must persist before it’s considered valid.
How to use: Increase for more robust, less frequent signals; decrease for faster, but possibly less reliable, signals.
ADX Length
What it does: Sets the period for the ADX (trend strength) calculation.
How to use: Longer = smoother, shorter = more sensitive.
ADX Trend Threshold
What it does: Sets the minimum ADX value to consider a trend “strong.”
How to use: Raise for stricter trend confirmation, lower for more trades.
ATR Length
What it does: Sets the period for the ATR (volatility) calculation.
How to use: Longer = smoother volatility, shorter = more reactive.
Volume Confirmation Lookback
What it does: Sets how many bars are used to calculate the average volume.
How to use: Longer = more stable volume baseline, shorter = more sensitive.
Volume Confirmation Multiplier
What it does: Sets how much current volume must exceed average volume to be considered “high.”
How to use: Increase for stricter volume filter.
RSI Flat Min / RSI Flat Max
What they do: Define the RSI range considered “flat” (i.e., not trending).
How to use: Widen to be stricter about requiring a trend, narrow for more trades.
Style Page
Most style settings (such as plot colors, label sizes, and shapes) are preset in the script for visual clarity.
You can adjust plot visibility and colors (for signals, stop loss, take profit) in the TradingView “Style” tab as with any indicator.
Buy Signal: Shows as a green triangle below the bar when a buy is triggered.
Sell Signal: Shows as a red triangle above the bar when a sell is triggered.
Stop Loss/Take Profit Lines: Red and green lines for SL/TP, visible when a trade is active.
SL/TP Labels: Small colored markers at the SL/TP levels for each trade.
How to use:
Toggle visibility or change colors in the Style tab if you wish to match your chart theme or preferences.
In Summary
This indicator is highly customizable—you can tune every aspect of the AI logic, risk management, signal filtering, and table display to suit your trading style.
The table gives you a real-time, comprehensive view of all relevant signals, filters, and trade instructions.
All inputs are designed to be intuitive—hover over them in TradingView for tooltips, or refer to the explanations above for details.

200 SMA (5%/-3% Buffer) for SPY & QQQ In my testing TQQQ is an absolute monster of an ETF that performs extremely well even from a buy and hold standpoint over long periods of time, its largest drawback is the massive drawdown exposure that it faces which can be easily sidestepped with this strategy.
This strategy is meant to basically abuse TQQQ's insane outperformance while augmenting the typical 200SMA strategy in a way that uses all of its strengths while avoiding getting whipsawed in sideways markets.
The strategy BUYS when price crosses 5% over the 200SMA and then SELLS when price drops 3% below the 200SMA. Between trades I'll be parking my entire account in SGOV.
So maximizing profit while minimizing risk.
You use the strategy based off of QQQ and then make the trades on TQQQ when it tells you to BUY/SELL.
Here are some reasons why I will be using this strategy:
Simple emotionless BUY and SELL signals where I don't care who the president is, what is happening in the world, who is bombing who, who the leadership team is, no attachment to individual companies and diversified across the NASDAQ.
~85% win percentage and when it does lose the loses are nothing compared to the wins and after a loss you're basically set up for a massive win in the next trade.
Max drawdown of around 53% when using TQQQ
You benefit massively when the market is doing well and when there is a recession you basically sit in SGOV for a year and then are set up for a monster recovery with a clear easy BUY signal. So as long as you're patient you win regardless of what happens.
The trades are often very long term resulting in you taking advantage of Long Term Capital Gains tax advantage which could mean saving up to 15-20% in taxes.
With only a few trades you can spend time doing other stuff and don't have to track or pay attention to anything that is happening.
Simple, easy, and massively profitable.

Signalgo MASignalgo MA is a TradingView indicator based on moving average (MA) trading by combining multi-timeframe logic, trend strength filtering, and adaptive trade management. Here’s a deep dive into how it works, its features, and why it stands apart from traditional MA indicators.
How Signalgo MA Works
1. Multi-Timeframe Moving Average Analysis
Simultaneous EMA & SMA Tracking: Signalgo MA calculates exponential (EMA) and simple (SMA) moving averages across a wide range of timeframes—from 1 minute to 3 months.
Layered Cross Detection: It detects crossovers and crossunders on each timeframe, allowing for both micro and macro trend detection.
Synchronized Signal Mapping: Instead of acting on a single crossover, the indicator requires agreement across multiple timeframes to trigger signals, filtering out noise and false positives.
2. Trend Strength & Quality Filtering
ADX Trend Filter: Trades are only considered when the Average Directional Index (ADX) confirms a strong trend, ensuring signals are not triggered during choppy or directionless markets.
Volume & Momentum Confirmation: For the strongest signals, the system requires:
A significant volume spike
Price above/below a longer-term EMA (for buys/sells)
RSI momentum confirmation
One-Time Event Detection: Each crossover event is flagged only once per occurrence, preventing repeated signals from the same move.
Inputs
Preset Parameters:
EMA & SMA Lengths: Optimized for both short-term and long-term analysis.
ADX Length & Minimum: Sets the threshold for what is considered a “strong” trend.
Show Labels/Table: Visual toggles for displaying signal and trade management information.
Trade Management:
Show TP/SL Logic: Toggle to display or hide take-profit (TP) and stop-loss (SL) levels.
ATR Length & Multipliers: Fine-tune how SL and TP levels adapt to market volatility.
Enable Trailing Stop: Option to activate dynamic stop movement after TP1.
Entry & Exit Strategy
Entry Logic
Long (Buy) Entry: Triggered when multiple timeframes confirm bullish EMA/SMA crossovers, ADX confirms trend strength, and all volume/momentum filters align.
Short (Sell) Entry: Triggered when multiple timeframes confirm bearish crossunders, with the same strict filtering.
Exit & Trade Management
Stop Loss (SL): Automatically set based on recent volatility (ATR), adapting to current market conditions.
Take Profits (TP1, TP2, TP3): Three profit targets at increasing reward multiples, allowing for flexible trade management.
Trailing Stop: After TP1 is hit, the stop loss moves to breakeven and a trailing stop is activated to lock in further gains.
Event Markers: Each time a TP or SL is hit, a visual label is placed on the chart for full transparency.
Strict Signal Quality Filters: Signals are only generated when volume spikes, momentum, and trend strength all align, dramatically reducing false positives.
Adaptive, Automated Trade Management: Built-in TP/SL and trailing logic mean you get not just signals, but a full trade management suite, rarely found in standard MA indicators.
Event-Driven, Not Static: Each signal is triggered only once per event, eliminating repetitive or redundant entries.
Visual & Alert Integration: Every signal and trade event is visually marked and can trigger TradingView alerts, keeping you informed in real time.
Trading Strategy Application
Versatility: Suitable for scalping, day trading, swing trading, and longer-term positions thanks to its multi-timeframe logic.
Noise Reduction: The layered filtering logic means you only see the highest-probability setups, helping you avoid common MA “fakeouts” and overtrading.
So basically what separates Signalgo MA from traditional MA indicators?
1. Multi-Timeframe Analysis
Traditional MA indicators: Usually measure crossovers or signals within a single timeframe.
Signalgo MA: simultaneously calculates fast/slow EMAs & SMAs for multiple periods. This enables it to create signals based on synchronized or stacked momentum across multiple periods, offering broader trend confirmation and reducing noise from single-timeframe signals.
2. Combinatorial Signal Logic
Traditional: A basic crossover is typically “if fast MA crosses above/below slow MA, signal buy/sell.”
Signalgo MA: Generates signals only when MA crossovers align across several timeframes, plus takes into consideration the presence or absence of conflicting signals in shorter or longer frames. This reduces false positives and increases selectivity.
3. Trend Strength Filtering (ADX Integration)
Traditional: Many MA indicators are “blind” to trend intensity, potentially triggering signals in low volatility or ranging conditions.
Signalgo MA: Employs ADX as a minimum trend filter. Signals will only fire if the trend is sufficiently strong, reducing whipsaws in choppy or sideways markets.
4. Volume & Strict Confirmation Layer
Traditional: Few MA indicators directly consider volume or require confluence with other major indicators.
Signalgo MA: Introduces a “strict signal” filter that requires not only MA crossovers and trend strength, but also (on designated frames):
Significant volume spike,
Price positioned above/below a higher timeframe EMA (trend anchor),
RSI momentum confirmation.
5. Persistent, Multi-Level TP/SL Automated Trade Management
Traditional: Separate scripts or manual management for stop-loss, take-profit, and trailing-stops, rarely fully integrated visually.
Signalgo MA: Auto-plots up to three take-profit levels, initial stop, and a trailing stop (all ATR-based) on the chart. It also re-labels these as they are hit and resets for each new entry, supporting full trade lifecycle visualization directly on the chart.
6. Higher Timeframe SMA Crosses for Long-Term Context
Traditional: Focuses only on the current chart’s timeframe.
Signalgo MA: Incorporates SMA cross logic for weekly, monthly, and quarterly periods, which can contextualize lower timeframe trades within broader cycles, helping filter against counter-trend signals.
7. “Signal Once” Logic to Prevent Over-Trading
Traditional: Will often re-fire the same signal repeatedly as long as the condition is true, possibly resulting in signal clusters and over-trading.
Signalgo MA: Fires each signal only once per condition—prevents duplicate alerts for the same trade context.

52SIGNAL RECIPE Smart Money Detector : CME + Exchanges=================52SIGNAL RECIPE CME-Exchange Smart Money Detector=================
◆ Overview
The 52SIGNAL RECIPE CME-Exchange Smart Money Detector is an advanced technical indicator designed to identify institutional and smart money movements by analyzing and comparing futures markets across both CME and cryptocurrency exchanges. This powerful tool detects coordinated buying and selling patterns that often precede significant price movements, giving traders an edge in anticipating market direction.
What makes this indicator unique is its cross-market verification approach. By requiring confirmation from both CME Bitcoin futures (dominated by institutional players) and crypto exchange futures (with broader market participation), it significantly reduces false signals and identifies high-probability smart money footprints that typically lead market movements.
─────────────────────────────────────
◆ Key Features
• Dual Market Confirmation: Simultaneously analyzes both CME Bitcoin futures and exchange futures charts to identify synchronized smart money activity
• Smart Volume Analysis: Uses advanced algorithms to separate buying and selling volume based on candle structure and price action
• Energy Wave Visualization: Displays smart money signals as intuitive energy waves with varying sizes reflecting signal strength
• Strength Rating System: Quantifies signal strength on a 0-100% scale, with multiple visualization levels (10%+, 40%+, 60%+, 80%+)
• Candlestick Pattern Integration: Incorporates bullish/bearish candle formations to enhance signal reliability
• Volume Spike Detection: Identifies abnormal volume increases that often accompany smart money positioning
• Trend Context Analysis: Evaluates signals in relation to current market trend for higher probability setups
• Dynamic Strength Calculation: Uses a multi-factor model considering volume ratio, buying/selling imbalance, candle structure, and trend alignment
• Transparent Signal Labeling: Displays precise strength percentage values with each signal for clear decision-making
• Real-time Institutional Flow Monitor: Tracks the footprints of large players across both regulated (CME) and crypto exchange markets
─────────────────────────────────────
◆ Understanding Signal Types
■ Buy Signal Energy Waves (Green)
• Definition: Detected when significant buying pressure appears simultaneously on both CME and exchange futures, typically on bearish candles
• Visual Appearance: Green circular waves below price bars, with size/opacity increasing with signal strength
• Market Interpretation: Indicates institutional buying interest even as price is declining, often preceding bullish reversals
• Signal Strength Factors:
▶ Higher buying volume relative to selling volume
▶ Above-average total volume
▶ Lower wicks on bearish candles
▶ Appearance at key support levels
▶ Coinciding with oversold conditions
■ Sell Signal Energy Waves (Red)
• Definition: Detected when significant selling pressure appears simultaneously on both CME and exchange futures, typically on bullish candles
• Visual Appearance: Red circular waves above price bars, with size/opacity increasing with signal strength
• Market Interpretation: Indicates institutional selling interest even as price is rising, often preceding bearish reversals
• Signal Strength Factors:
▶ Higher selling volume relative to buying volume
▶ Above-average total volume
▶ Upper wicks on bullish candles
▶ Appearance at key resistance levels
▶ Coinciding with overbought conditions
─────────────────────────────────────
◆ Signal Strength Understanding
■ The Four Strength Levels
• Level 1 (10-39%): Initial Detection
▶ Visual: Smallest energy wave
▶ Meaning: Early smart money positioning detected
▶ Usage: Early warning, prepare for possible setup
• Level 2 (40-59%): Moderate Strength
▶ Visual: Medium-small energy wave
▶ Meaning: Clearer institutional positioning
▶ Usage: Begin position planning, watch for confirmation
• Level 3 (60-79%): Strong Signal
▶ Visual: Medium-large energy wave
▶ Meaning: Significant smart money footprint
▶ Usage: High-probability setup forming, consider entry
• Level 4 (80-100%): Exceptional Strength
▶ Visual: Largest energy wave
▶ Meaning: Powerful institutional movement confirmed
▶ Usage: Highest probability setup, strong conviction entry point
■ Understanding Signal Strength Calculation
• Volume Component (0-50 points):
▶ Measures how current volume compares to recent average
▶ Maximum points when volume is 2x or higher than average
• Buy/Sell Ratio Component (0-50 points):
▶ Measures imbalance between buying and selling pressure
▶ Maximum points when ratio exceeds predefined multiplier threshold
• Advanced Weighting Factors:
▶ Candle Structure: Body size, wick length, and orientation
▶ Trend Alignment: Signal relationship to current trend
▶ Volume Spike: Abnormal volume increase detection
▶ Cross-Market Confirmation: Strength of signal alignment between CME and exchange
─────────────────────────────────────
◆ Practical Trading Applications
■ Reversal Trading Strategy
• Buy Signal Application:
▶ Setup: Strong buy energy wave (60%+) on a bearish candle
▶ Entry: After confirmation candle following the signal
▶ Stop Loss: Below recent low or 1 ATR below entry
▶ Take Profit: Previous resistance or 1:2 risk-reward minimum
▶ Enhancers: Signal occurring at support zone, oversold conditions, or trend line tests
• Sell Signal Application:
▶ Setup: Strong sell energy wave (60%+) on a bullish candle
▶ Entry: After confirmation candle following the signal
▶ Stop Loss: Above recent high or 1 ATR above entry
▶ Take Profit: Previous support or 1:2 risk-reward minimum
▶ Enhancers: Signal occurring at resistance zone, overbought conditions, or trend line tests
■ Trend Continuation Strategy
• During Uptrends:
▶ Focus on buy signals that appear during pullbacks
▶ Higher probability when signals occur at key moving averages or support levels
▶ Enter on strength when price shows signs of resuming the uptrend
• During Downtrends:
▶ Focus on sell signals that appear during relief rallies
▶ Higher probability when signals occur at key moving averages or resistance levels
▶ Enter on strength when price shows signs of resuming the downtrend
■ Multiple Timeframe Approach
• Signal Confirmation Across Timeframes:
▶ Major signals on higher timeframes (4H, daily) provide strategic direction
▶ Signals on lower timeframes (15m, 1H) offer tactical entry points
▶ Highest probability setups occur when signals align across multiple timeframes
• Signal Clustering:
▶ Multiple signals in the same price area significantly increase probability
▶ Look for areas where both buy and sell signals have appeared, indicating battleground zones
▶ The most recent signal direction often wins these battles
─────────────────────────────────────
◆ Technical Foundation
■ Why Cross-Market Confirmation Matters
• Institutional Participation:
▶ CME Bitcoin futures are dominated by regulated institutional investors
▶ Crypto exchange futures include both retail and institutional players
▶ When both markets show the same smart money pattern, the signal reliability increases dramatically
• Market Inefficiency Exploitation:
▶ Large players often position across multiple venues to minimize market impact
▶ This coordinated activity creates detectable footprints when analyzed correctly
▶ Cross-market confirmation helps filter out market noise and isolate true smart money movements
■ Smart Volume Calculation Methodology
• Price-Volume Relationship Analysis:
▶ Uses candle structure to estimate buying vs. selling volume
▶ Buying volume = Total volume × (Close - Low) / (High - Low)
▶ Selling volume = Total volume × (High - Close) / (High - Low)
• Signal Triggering Logic:
▶ Buy signal: When buying volume exceeds selling volume by multiplier factor
▶ Sell signal: When selling volume exceeds buying volume by multiplier factor
▶ Both conditions must be met simultaneously on CME and exchange futures
• Advanced Pattern Recognition:
▶ Evaluates candle body-to-range ratio for signal quality
▶ Analyzes wick length and position for additional confirmation
▶ Considers recent highs/lows to detect potential turning points
─────────────────────────────────────
◆ Indicator Settings Guide
■ Main Settings
• CME Bitcoin Futures Symbol:
▶ Default: CME:BTC1!
▶ Purpose: Sets the CME futures contract to analyze alongside current chart
• Buy/Sell Volume Multiplier:
▶ Default: 3.0
▶ Range: 1.0-10.0
▶ Purpose: Determines how much buying volume must exceed selling volume (or vice versa) to trigger a signal
▶ Higher values = fewer but stronger signals
▶ Lower values = more signals but potentially lower reliability
■ Volume Filter Settings
• Enable Volume Filter:
▶ Default: Enabled
▶ Purpose: When enabled, only considers candles with above-threshold volume
• Volume Average Period:
▶ Default: 20 candles
▶ Range: 5-200 candles
▶ Purpose: Sets the lookback period for calculating average volume
• Volume Threshold:
▶ Default: 150%
▶ Range: 10%-500%
▶ Purpose: Minimum volume percentage (of average) required for signal consideration
▶ Higher values focus on only the most significant volume spikes
■ Signal Visualization
• Show Signal Strength Value:
▶ Default: Enabled
▶ Purpose: Displays the exact percentage strength value with each signal
• Energy Wave Colors:
▶ Buy Energy Wave: Green (#00ff80)
▶ Sell Energy Wave: Red (#ff4040)
▶ Purpose: Customize the appearance of energy waves for visual preference
■ Advanced Settings
• Use Advanced Strength Calculation:
▶ Default: Enabled
▶ Purpose: When enabled, uses the full multi-factor model for signal strength
▶ When disabled, uses only basic volume and ratio factors
─────────────────────────────────────
◆ Synergy with Other Indicators
• Support/Resistance Levels:
▶ Smart money signals occurring at key support/resistance significantly increase reliability
▶ Particularly powerful when signals appear at tested price levels
• Moving Averages:
▶ Signals near key moving averages (50MA, 200MA) often indicate institutional interest
▶ Moving average crosses combined with smart money signals create high-probability setups
• RSI/Momentum Indicators:
▶ Buy signals in oversold conditions increase probability of successful reversal
▶ Sell signals in overbought conditions increase probability of successful reversal
• Volume Profile:
▶ Signals occurring at high volume nodes often indicate significant turning points
▶ Low volume nodes between high volume areas can act as acceleration zones after signal triggers
• Market Structure:
▶ Smart money signals that break key market structure levels (higher highs/lows or lower highs/lows) are particularly significant
▶ Can signal the early stages of trend changes when aligned with structure breaks
─────────────────────────────────────
◆ Conclusion
The 52SIGNAL RECIPE CME-Exchange Smart Money Detector provides traders with a powerful edge by revealing institutional positioning across both regulated futures and crypto exchange markets. By requiring synchronized signals from both venues, it cuts through market noise to identify the most reliable smart money footprints.
What sets this indicator apart is its sophisticated cross-market verification system. Rather than relying on signals from a single market, it only triggers when both CME and exchange futures display the same smart money pattern simultaneously. This approach dramatically reduces false signals and highlights truly significant institutional activity.
The intuitive energy wave visualization system makes it easy to spot signals of varying strength, while the transparent percentage rating allows for objective assessment of each opportunity. By focusing on these dual-confirmed smart money movements, traders can position themselves alongside institutional players rather than against them.
Remember that the most powerful signals typically appear at key market junctures, often before significant price movements. By incorporating this indicator into your trading approach, you gain insight into institutional positioning that can help anticipate market direction with greater confidence.
─────────────────────────────────────
※ Disclaimer: Like all trading tools, the CME-Exchange Smart Money Detector should be used as a supplementary indicator and not relied upon exclusively for trading decisions. Past patterns of institutional behavior may not guarantee future market movements. Always employ appropriate risk management strategies in your trading.
================52SIGNAL RECIPE CME-Exchange Smart Money Detector==================
◆ 개요
52SIGNAL RECIPE CME-Exchange Smart Money Detector는 CME와 암호화폐 거래소의 선물 시장을 동시에 분석하여 기관 및 스마트 머니의 움직임을 포착하는 고급 기술적 지표입니다. 이 강력한 도구는 주요 가격 움직임에 선행하는 조직적인 매수 및 매도 패턴을 감지하여 트레이더들에게 시장 방향 예측에 유리한 정보를 제공합니다.
이 지표의 독보적인 특징은 교차 시장 검증 접근법에 있습니다. CME 비트코인 선물(기관 투자자 중심)과 암호화폐 거래소 선물(광범위한 시장 참여자) 모두에서 확인을 요구함으로써, 허위 신호를 크게 줄이고 일반적으로 시장 움직임을 선도하는 고확률 스마트 머니 흔적을 식별합니다.
─────────────────────────────────────
◆ 주요 특징
• 듀얼 마켓 확인: CME 비트코인 선물과 거래소 선물 차트를 동시에 분석하여 동기화된 스마트 머니 활동 식별
• 스마트 볼륨 분석: 캔들 구조와 가격 행동을 기반으로 매수 및 매도 볼륨을 분리하는 고급 알고리즘 사용
• 에너지 파동 시각화: 스마트 머니 신호를 신호 강도를 반영하는 다양한 크기의 직관적인 에너지 파동으로 표시
• 강도 평가 시스템: 신호 강도를 0-100% 척도로 수치화하고 여러 시각화 레벨(10%+, 40%+, 60%+, 80%+) 제공
• 캔들스틱 패턴 통합: 신호 신뢰성을 높이기 위해 상승/하락 캔들 형성을 분석에 통합
• 볼륨 스파이크 감지: 스마트 머니 포지셔닝을 동반하는 비정상적인 볼륨 증가 식별
• 추세 맥락 분석: 현재 시장 추세와 관련하여 신호를 평가하여 높은 확률의 설정 제공
• 동적 강도 계산: 볼륨 비율, 매수/매도 불균형, 캔들 구조 및 추세 일치도를 고려하는 다중 요소 모델 사용
• 투명한 신호 라벨링: 명확한 의사 결정을 위해 각 신호와 함께 정확한 강도 백분율 값 표시
• 실시간 기관 자금 흐름 모니터: 규제된(CME) 시장과 암호화폐 거래소 시장 모두에서 대형 플레이어의 흔적 추적
─────────────────────────────────────
◆ 신호 유형 이해하기
■ 매수 신호 에너지 파동 (녹색)
• 정의: 일반적으로 하락 캔들에서 CME와 거래소 선물 모두에서 동시에 상당한 매수 압력이 감지될 때 발생
• 시각적 모습: 가격 바 아래에 녹색 원형 파동으로 표시되며, 신호 강도에 따라 크기/불투명도 증가
• 시장 해석: 가격이 하락하는 동안에도 기관의 매수 관심이 있음을 나타내며, 종종 상승 반전에 선행
• 신호 강도 요소:
▶ 매도 볼륨 대비 높은 매수 볼륨
▶ 평균 이상의 총 거래량
▶ 하락 캔들의 아래 꼬리
▶ 주요 지지 수준에서의 출현
▶ 과매도 조건과 일치
■ 매도 신호 에너지 파동 (적색)
• 정의: 일반적으로 상승 캔들에서 CME와 거래소 선물 모두에서 동시에 상당한 매도 압력이 감지될 때 발생
• 시각적 모습: 가격 바 위에 적색 원형 파동으로 표시되며, 신호 강도에 따라 크기/불투명도 증가
• 시장 해석: 가격이 상승하는 동안에도 기관의 매도 관심이 있음을 나타내며, 종종 하락 반전에 선행
• 신호 강도 요소:
▶ 매수 볼륨 대비 높은 매도 볼륨
▶ 평균 이상의 총 거래량
▶ 상승 캔들의 위 꼬리
▶ 주요 저항 수준에서의 출현
▶ 과매수 조건과 일치
─────────────────────────────────────
◆ 신호 강도 이해하기
■ 네 가지 강도 레벨
• 레벨 1 (10-39%): 초기 감지
▶ 시각적: 가장 작은 에너지 파동
▶ 의미: 초기 스마트 머니 포지셔닝 감지
▶ 활용: 초기 경고, 가능한 설정 준비
• 레벨 2 (40-59%): 중간 강도
▶ 시각적: 중간-작은 에너지 파동
▶ 의미: 더 명확한 기관 포지셔닝
▶ 활용: 포지션 계획 시작, 확인 대기
• 레벨 3 (60-79%): 강한 신호
▶ 시각적: 중간-큰 에너지 파동
▶ 의미: 중요한 스마트 머니 흔적
▶ 활용: 고확률 설정 형성, 진입 고려
• 레벨 4 (80-100%): 예외적 강도
▶ 시각적: 가장 큰 에너지 파동
▶ 의미: 강력한 기관 움직임 확인
▶ 활용: 최고 확률 설정, 강한 확신의 진입 지점
■ 신호 강도 계산 이해하기
• 볼륨 구성 요소 (0-50 포인트):
▶ 현재 볼륨이 최근 평균과 비교하여 얼마나 높은지 측정
▶ 볼륨이 평균보다 2배 이상 높을 때 최대 포인트 부여
• 매수/매도 비율 구성 요소 (0-50 포인트):
▶ 매수와 매도 압력 간의 불균형 측정
▶ 비율이 미리 정의된 배율 임계값을 초과할 때 최대 포인트 부여
• 고급 가중치 요소:
▶ 캔들 구조: 몸통 크기, 꼬리 길이 및 방향
▶ 추세 일치: 현재 추세와의 신호 관계
▶ 볼륨 스파이크: 비정상적인 볼륨 증가 감지
▶ 교차 시장 확인: CME와 거래소 간 신호 일치 강도
─────────────────────────────────────
◆ 실전 트레이딩 응용
■ 반전 트레이딩 전략
• 매수 신호 응용:
▶ 설정: 하락 캔들에서 강한 매수 에너지 파동(60%+)
▶ 진입: 신호 이후 확인 캔들 이후
▶ 손절: 최근 저점 아래 또는 진입점 아래 1 ATR
▶ 이익실현: 이전 저항 또는 최소 1:2 리스크-리워드
▶ 강화 요소: 지지 구역, 과매도 조건 또는 추세선 테스트에서 발생하는 신호
• 매도 신호 응용:
▶ 설정: 상승 캔들에서 강한 매도 에너지 파동(60%+)
▶ 진입: 신호 이후 확인 캔들 이후
▶ 손절: 최근 고점 위 또는 진입점 위 1 ATR
▶ 이익실현: 이전 지지 또는 최소 1:2 리스크-리워드
▶ 강화 요소: 저항 구역, 과매수 조건 또는 추세선 테스트에서 발생하는 신호
■ 추세 지속 전략
• 상승 추세 중:
▶ 조정 중에 나타나는 매수 신호에 집중
▶ 주요 이동평균선이나 지지 수준에서 신호가 발생할 때 확률이 높음
▶ 가격이 상승 추세를 재개할 징후를 보일 때 강도에 맞춰 진입
• 하락 추세 중:
▶ 일시적 반등 중에 나타나는 매도 신호에 집중
▶ 주요 이동평균선이나 저항 수준에서 신호가 발생할 때 확률이 높음
▶ 가격이 하락 추세를 재개할 징후를 보일 때 강도에 맞춰 진입
■ 다중 시간프레임 접근법
• 다양한 시간프레임에서의 신호 확인:
▶ 상위 시간프레임(4시간, 일봉)의 주요 신호는 전략적 방향 제공
▶ 하위 시간프레임(15분, 1시간)의 신호는 전술적 진입 지점 제공
▶ 여러 시간프레임에서 신호가 일치할 때 가장 높은 확률의 설정 발생
• 신호 클러스터링:
▶ 동일한 가격 영역에서 여러 신호가 발생하면 확률이 크게 증가
▶ 매수와 매도 신호가 모두 나타난 영역을 찾아 전투 구역 식별
▶ 이러한 전투에서는 대개 가장 최근의 신호 방향이 우세
─────────────────────────────────────
◆ 기술적 기반
■ 교차 시장 확인이 중요한 이유
• 기관 참여:
▶ CME 비트코인 선물은 규제된 기관 투자자가 주도
▶ 암호화폐 거래소 선물은 소매 및 기관 플레이어 모두 포함
▶ 두 시장이 동일한 스마트 머니 패턴을 보일 때 신호 신뢰성이 크게 증가
• 시장 비효율성 활용:
▶ 대형 플레이어들은 시장 영향을 최소화하기 위해 여러 거래소에 걸쳐 포지션을 취하는 경우가 많음
▶ 이러한 조직적인 활동은 올바르게 분석할 때 감지 가능한 흔적을 남김
▶ 교차 시장 확인은 시장 노이즈를 필터링하고 진정한 스마트 머니 움직임을 분리하는 데 도움
■ 스마트 볼륨 계산 방법론
• 가격-볼륨 관계 분석:
▶ 캔들 구조를 사용하여 매수 대 매도 볼륨 추정
▶ 매수 볼륨 = 총 볼륨 × (종가 - 저가) / (고가 - 저가)
▶ 매도 볼륨 = 총 볼륨 × (고가 - 종가) / (고가 - 저가)
• 신호 트리거 로직:
▶ 매수 신호: 매수 볼륨이 매도 볼륨을 배율 요소만큼 초과할 때
▶ 매도 신호: 매도 볼륨이 매수 볼륨을 배율 요소만큼 초과할 때
▶ 두 조건 모두 CME와 거래소 선물에서 동시에 충족되어야 함
• 고급 패턴 인식:
▶ 신호 품질을 위한 캔들 몸통-범위 비율 평가
▶ 추가 확인을 위한 꼬리 길이 및 위치 분석
▶ 잠재적 전환점을 감지하기 위해 최근 고점/저점 고려
─────────────────────────────────────
◆ 지표 설정 가이드
■ 주요 설정
• CME 비트코인 선물 심볼:
▶ 기본값: CME:BTC1!
▶ 목적: 현재 차트와 함께 분석할 CME 선물 계약 설정
• 매수/매도 볼륨 배율:
▶ 기본값: 3.0
▶ 범위: 1.0-10.0
▶ 목적: 신호를 트리거하기 위해 매수 볼륨이 매도 볼륨을 얼마나 초과해야 하는지(또는 그 반대) 결정
▶ 높은 값 = 적지만 더 강한 신호
▶ 낮은 값 = 더 많은 신호지만 잠재적으로 낮은 신뢰성
■ 볼륨 필터 설정
• 볼륨 필터 활성화:
▶ 기본값: 활성화됨
▶ 목적: 활성화되면 임계값 이상의 볼륨을 가진 캔들만 고려
• 볼륨 평균 기간:
▶ 기본값: 20 캔들
▶ 범위: 5-200 캔들
▶ 목적: 평균 볼륨 계산을 위한 룩백 기간 설정
• 볼륨 임계값:
▶ 기본값: 150%
▶ 범위: 10%-500%
▶ 목적: 신호 고려에 필요한 최소 볼륨 백분율(평균 대비)
▶ 높은 값은 가장 중요한 볼륨 스파이크에만 집중
■ 신호 시각화
• 신호 강도 값 표시:
▶ 기본값: 활성화됨
▶ 목적: 각 신호와 함께 정확한 백분율 강도 값 표시
• 에너지 파동 색상:
▶ 매수 에너지 파동: 녹색(#00ff80)
▶ 매도 에너지 파동: 적색(#ff4040)
▶ 목적: 시각적 선호도에 맞게 에너지 파동의 모양 사용자 정의
■ 고급 설정
• 고급 강도 계산 사용:
▶ 기본값: 활성화됨
▶ 목적: 활성화되면 신호 강도에 전체 다중 요소 모델 사용
▶ 비활성화되면 기본 볼륨 및 비율 요소만 사용
─────────────────────────────────────
◆ 다른 지표와의 시너지
• 지지/저항 레벨:
▶ 주요 지지/저항에서 발생하는 스마트 머니 신호는 신뢰성을 크게 높임
▶ 특히 테스트된 가격 레벨에서 신호가 나타날 때 강력함
• 이동평균선:
▶ 주요 이동평균선(50MA, 200MA) 근처의 신호는 종종 기관의 관심을 나타냄
▶ 이동평균선 교차와 스마트 머니 신호의 조합은 고확률 설정 생성
• RSI/모멘텀 지표:
▶ 과매도 조건에서의 매수 신호는 성공적인 반전 확률 증가
▶ 과매수 조건에서의 매도 신호는 성공적인 반전 확률 증가
• 볼륨 프로파일:
▶ 높은 볼륨 노드에서 발생하는 신호는 종종 중요한 전환점을 나타냄
▶ 높은 볼륨 영역 사이의 낮은 볼륨 노드는 신호 트리거 후 가속 구간으로 작용할 수 있음
• 시장 구조:
▶ 주요 시장 구조 레벨(높은 고점/저점 또는 낮은 고점/저점)을 깨는 스마트 머니 신호는 특히 중요
▶ 구조 깨짐과 일치할 때 추세 변화의 초기 단계를 알릴 수 있음
─────────────────────────────────────
◆ 결론
52SIGNAL RECIPE CME-Exchange Smart Money Detector는 규제된 선물 시장과 암호화폐 거래소 시장 모두에서 기관의 포지셔닝을 드러냄으로써 트레이더에게 강력한 우위를 제공합니다. 두 거래소에서 동기화된 신호를 요구함으로써, 시장 노이즈를 제거하고 가장 신뢰할 수 있는 스마트 머니 흔적을 식별합니다.
이 지표를 차별화하는 것은 정교한 교차 시장 검증 시스템입니다. 단일 시장의 신호에 의존하는 대신, CME와 거래소 선물 모두가 동시에 동일한 스마트 머니 패턴을 표시할 때만 트리거됩니다. 이 접근 방식은 허위 신호를 크게 줄이고 진정으로 중요한 기관 활동을 강조합니다.
직관적인 에너지 파동 시각화 시스템을 통해 다양한 강도의 신호를 쉽게 발견할 수 있으며, 투명한 백분율 평가를 통해 각 기회를 객관적으로 평가할 수 있습니다. 이러한 이중 확인된 스마트 머니 움직임에 집중함으로써, 트레이더는 기관 참가자들에 대항하기보다는 그들과 함께 포지션을 취할 수 있습니다.
가장 강력한 신호는 일반적으로 주요 시장 변곡점에서, 종종 중요한 가격 움직임 이전에 나타난다는 점을 기억하세요. 이 지표를 트레이딩 접근법에 통합함으로써, 시장 방향을 더 높은 확신으로 예측하는 데 도움이 되는 기관 포지셔닝에 대한 통찰력을 얻을 수 있습니다.
─────────────────────────────────────
※ 면책 조항: 모든 트레이딩 도구와 마찬가지로, CME-Exchange Smart Money Detector는 보조 지표로 사용되어야 하며 트레이딩 결정을 전적으로 의존해서는 안 됩니다. 과거의 기관 행동 패턴이 미래 시장 움직임을 보장하지는 않습니다. 항상 적절한 리스크 관리 전략을 트레이딩에 사용하세요.

Delta Spike Detector [GSK-VIZAG-AP-INDIA]📌 Delta Spike Detector – Volume Imbalance Ratio
By GSK-VIZAG-AP-INDIA
📘 Overview
This indicator highlights aggressive buying or selling activity by analyzing the imbalance between estimated Buy and Sell volume per candle. It flags moments when one side dominates the other significantly — defined by user-selectable volume ratio thresholds (10x, 15x, 20x, 25x).
📊 How It Works
Buy/Sell Volume Estimation
Approximates buyer and seller participation using candle structure:
Buy Volume = Proximity of close to low
Sell Volume = Proximity of close to high
Delta & Delta Ratio
Delta = Buy Volume − Sell Volume
Delta Ratio = Ratio of dominant volume side to the weaker side
When this ratio exceeds a threshold, it’s classified as a spike.
Spike Labels
Labels are plotted on the chart:
10x B, 15x B, 20x B, 25x B → Buy Spike Labels (below candles)
10x S, 15x S, 20x S, 25x S → Sell Spike Labels (above candles)
The color of each label reflects the spike strength.
⚙️ User Inputs
Enable/Disable Buy or Sell Spikes
Set custom delta ratio thresholds (default: 10x, 15x, 20x, 25x)
🎯 Use Cases
Spotting sudden aggressive activity (e.g. smart money moves, traps, breakouts)
Identifying short-term market exhaustion or momentum bursts
Complementing other trend or volume-based tools
⚠️ Important Notes
The script uses approximated Buy/Sell Volume based on price position, not actual order flow.
This is not a buy/sell signal generator. It should be used in context with other confirmation indicators or market structure.
✍️ Credits
Developed by GSK-VIZAG-AP-INDIA
For educational and research use only.

Cumulative Volume Delta📊 Indicator Name:
Cumulative Volume Delta (CVD) + Candle Divergence (Color DIfference)
📌 Purpose:
This indicator visualizes volume delta over a user-defined time anchor and highlights divergence between volume-based momentum and price movement. It's especially useful for identifying potential reversals, fakeouts, or hidden buying/selling pressure.
🔍 How It Works:
1. Volume Delta Calculation (CVD Candles):
The script uses ta.requestVolumeDelta() to approximate volume delta data over a chosen anchor period (e.g., 1D).
Volume delta = Buy Volume – Sell Volume
Each candle on the CVD chart represents changes in cumulative volume delta, with OHLC-style values:
openVolume: cumulative delta at the start of the bar
lastVolume: cumulative delta at the end of the bar
maxVolume, minVolume: intra-bar high and low
2. Visual Representation (CVD Candles):
Green/Teal candle: Delta is increasing (buying pressure dominates)
Red candle: Delta is decreasing (selling pressure dominates)
3. Divergence Detection:
The script compares the direction of the price candle with the direction of the CVD candle:
Price Up + CVD Down → Possible hidden selling (bearish divergence)
Price Down + CVD Up → Possible hidden buying (bullish divergence)
4. Color Highlighting:
Orange candle on the CVD chart signals divergence between price and volume delta.
This color override helps you quickly spot potential discrepancies between price movement and underlying volume pressure.
5. Alerting:
An alertcondition is added so you can receive a notification whenever a divergence occurs.
⚙️ User Inputs:
Anchor period (e.g., 1D): Timeframe over which the CVD is anchored.
Use custom timeframe: Allows you to override and define the internal lower timeframe used for volume estimation (e.g., 1-min).
📈 How to Use It:
✅ Bullish Divergence (Price down, CVD up)
This may indicate:
Buyers absorbing selling pressure.
A potential reversal to the upside.
Hidden accumulation.
🚫 Bearish Divergence (Price up, CVD down)
This may indicate:
Sellers stepping in despite upward price.
A potential reversal to the downside.
Hidden distribution.
🧠 Trading Insights:
CVD is often used by order flow traders or those analyzing market depth and volume imbalances.
This version lets you visually align price action with underlying volume, improving decision-making.
The divergence signal can be combined with other technical tools like support/resistance, candlestick patterns, or trendlines for confirmation.

CVD Trend IndikatorCVD Trend Indicator (Cumulative Volume Delta)
This Pine Script indicator is designed to help traders visualize the underlying buying and selling pressure in the market by analyzing the Cumulative Volume Delta (CVD). It provides insights into whether buyers or sellers are more aggressive over time, aiding in trend confirmation and potential reversal identification.
How it Works:
The indicator calculates the Cumulative Volume Delta for each candlestick.
If the candle closes higher than it opened (close > open), its entire volume is considered buying volume (positive delta).
If the candle closes lower than it opened (close < open), its entire volume is considered selling volume (negative delta).
If the candle closes at the same price it opened (close == open), its delta is considered zero.
These individual candle deltas are then cumulatively summed up over time, creating the CVD line. A rising CVD indicates increasing buying pressure, while a falling CVD suggests growing selling pressure.
The indicator also features an optional Simple Moving Average (SMA) of the CVD, which helps smooth out the CVD line and identify the prevailing trend in buying/selling pressure more clearly.
Key Features:
Cumulative Volume Delta (CVD) Line:
Rising CVD (Blue Line): Indicates aggressive buying pressure is dominant, supporting bullish price action.
Falling CVD (Blue Line): Suggests aggressive selling pressure is dominant, supporting bearish price action.
CVD Moving Average (Red Line, optional):
A user-defined SMA of the CVD, which acts as a trend filter for the volume delta.
When the CVD crosses above its MA, it can signal increasing buying momentum.
When the CVD crosses below its MA, it can signal increasing selling momentum.
Session Reset:
The CVD automatically resets at the beginning of each new trading session (daily by default). This provides a fresh perspective on the day's accumulated buying or selling pressure, which is particularly useful for day traders.
Background Color Visuals:
The indicator panel's background changes color to visually represent periods of dominant buying pressure (green background when CVD > CVD MA) or selling pressure (red background when CVD < CVD MA), offering a quick glance at the market's underlying bias.
Trading Insights:
Trend Confirmation: Use a rising CVD (and its MA) to confirm an uptrend, or a falling CVD (and its MA) to confirm a downtrend.
Divergences: Look for CVD Divergences as potential reversal signals:
Bullish Divergence: Price makes a lower low, but CVD makes a higher low (suggests selling pressure is weakening).
Bearish Divergence: Price makes a higher high, but CVD makes a lower high (suggests buying pressure is weakening).
Momentum Shifts: Sudden, sharp changes in the CVD's direction or its cross over/under its MA can signal shifts in market momentum.
Support/Resistance Confirmation: Observe CVD behavior around key price levels. Weakening buying pressure at resistance or weakening selling pressure at support can confirm the strength of these levels.
Customization:
showMA: Toggle the visibility of the CVD's Moving Average.
maLength: Adjust the period for the CVD's Moving Average to control its sensitivity to recent price action. A shorter length makes it more reactive, while a longer length makes it smoother.
Disclaimer: No indicator is foolproof. Always use the CVD Trend Indicator in conjunction with other technical analysis tools, price action, and robust risk management strategies. Backtesting and forward testing are crucial for understanding its effectiveness in different market conditions and timeframes.

Project SynthIntroducing Project Synth !
Inspired by Pace of Tape and Cumulative Delta I created Project Synth in order to aggregate volume flow data across multiple marketsfor two primary reasions:
Traditional orderflow tools are not available on Tradingview. My script attempts to bring an original; calculus-based approach to creating not only an alternative for traditional orderflow tools, but also a more accurate one.
In order to detect genuine buying and selling pressure that cannot be easily manipulated. I did this because while I've always enjoyed concept behind both of those tools, I did not think they captured enough data to be useful. By analyzing assets that move together (positive correlation) and assets that move inversely (negative correlation), my system aims to fix the fundamental problems with those indicators and create an objective view of market sentiment based on aggregate orderflow.
Some more detailed explanations (using QQQ and SQQQ as an example):
Inverse Market Dynamics (QQQ vs SQQQ):
In an inverse market like SQQQ, aggressive buyers hit the ask when they expect the underlying (QQQ) to fall, while passive buyers wait on the bid hoping for cheaper inverse exposure. When QQQ rallies, SQQQ sees aggressive selling (people dumping their bearish bets) hitting bids, while passive sellers sit on the ask hoping to exit at better prices. The aggression flows opposite to the underlying market direction.
Why Utilizing Both Markets Provides A More Accurate Delta:
Watching both QQQ and SQQQ gives cross-validation - real buying pressure in QQQ should coincide with selling pressure in SQQQ. If you see buying in QQQ but also buying in SQQQ, that's a conflicting signal suggesting the move might be artificial or driven by other factors. The inverse relationship acts as a confirmation filter, making false signals much harder to generate.
Multiple Markets = Authentic Pressure:
The more unique, important markets you track, the harder it becomes to create fake delta moves. Real institutional buying/selling pressure affects multiple correlated assets simultaneously in predictable patterns - you can't easily manipulate tech stocks, treasury bonds, VIX, and currency pairs all at once to create a false signal. Each additional market acts as a fraud detection layer, ensuring the delta measurement reflects genuine ecosystem-wide buying and selling pressure rather than isolated manipulation or noise.
My Suggestions For Usage:
In order to keep the explanation simple and short for now, I suggest using it just like a cumulative delta indicator. For example: let's say you were watching CME_MINI:ES1! , and you had a resistance level at 6000. When the price reaches your resistance level, you would be looking for a significant divergence between price and Delta. Price : rising, Delta : falling. This means that even though the price was going up, strong and aggressive sellers are jumping in more and more, this can be used as a confirmation tool for a resistance level.
Notes For Moderators, Authors and Users:
Firstly, to the best of my knowledge, I have not been able to find many tools built around the concept of cumulative delta or pace of tape. While I know there are a couple projects, none to the magnitude of synthetically recreating these tools via an algorithm designed around basic calculus principles. While tools like Volume Delta are built in, they do not attempt to capture an accurate picture of aggregated orderflow from what I understand.
Secondly, it needs to be noted that tool aims to create an approximation of buying and selling pressure. To my knowledge it is not possible to create an accurate full picture, at least not within the limitations of Tradingview.

ATS Net Volume V5.0ATS Net Volume V5.0
Smart Net Volume Analysis System
Overview
ATS Net Volume V5.0 is an advanced volume-based indicator designed for institutional-level capital flow analysis. By monitoring net buying/selling pressure, it identifies the movements of major market players. The system integrates large-order filtering and dynamic price-volume equilibrium algorithms to distinguish genuine demand from market noise, providing traders with clear signals for capital inflow/outflow.
Key Features
🔹 Net Volume Dynamics
Real-time calculation of the difference between buy-side vs. sell-side volume (units: millions/billions)
Positive values indicate capital inflow (green), negative values indicate outflow (red)
🔹 Large Order Detection
Automatically filters out retail-sized trades, focusing on institutional block orders (e.g., "60M" = 60 million, "05B" = 5 billion)
Evaluates accumulation/distribution behavior relative to price levels
🔹 Multi-Timeframe Compatibility
Supports analysis from tick data to daily charts
🔹 Visual Signals
Histogram + numerical labels for intuitive net volume strength display
Threshold-based alerts (e.g., extreme values trigger overbought/oversold signals)
Data Interpretation
Use Cases
✅ Trend Confirmation
Price rise + expanding net buys → Healthy trend
Price rise + net sells → Potential bull trap
✅ Reversal Warning
Price新高 + net volume divergence → Possible topping signal
✅ Institutional Activity
Sustained large net inflows → Smart money accumulation
Sudden massive outflows → Emergency liquidation event
Signal Classification
Net Volume Range Market Implication
Above +50M Strong inflow (bullish)
+10M to +50M Moderate buying
-10M to +10M Balanced market
-10M to -50M Moderate selling
Below -50M Extreme outflow (bearish)
Advantages
🚨 Filters False Breakouts: Responds only to large-order-driven price movements
📊 Price-Volume Synergy: Avoids "low-volume rally" traps
💡 Universal Applicability: Stocks/Futures/Cryptocurrencies
Note: Always combine with price structure (support/resistance). Not a standalone trading signal.

(OFPI) Order Flow Polarity Index - Momentum Gauge (DAFE) (OFPI) Order Flow Polarity Index - Momentum Gauge: Decode Market Aggression
The (OFPI) Gauge Bar is your front-row seat to the battle between buyers and sellers. This isn’t just another indicator—it’s a momentum tracker that reveals market aggression through a sleek, centered gauge bar and a smart dashboard. Built for traders who want clarity without clutter, it’s your edge for spotting who’s driving price, bar by bar.
What Makes It Unique?
Order Flow Pressure Index (OFPI): Splits volume into buy vs. sell pressure based on candle body position. It’s not just volume—it’s intent, showing who’s got the upper hand.
T3 Smoothing Magic: Uses a Tilson T3 moving average to keep signals smooth yet responsive. No laggy SMA nonsense here.
Centered Gauge Bar: A 20-segment bar splits bullish (lime) and bearish (red) momentum around a neutral center. Empty segments scream indecision—it’s like a visual heartbeat of the market.
Momentum Shift Alerts: Catches reversals with “Momentum Shift” flags when the OFPI crests, so you’re not caught off guard.
Clean Dashboard: A compact, bottom-left table shows momentum status, the gauge bar, and the OFPI value. Color-coded, transparent, and no chart clutter.
Inputs & Customization
Lookback Length (default 10): Set the window for pressure calculations. Short for scalps, long for trends.
T3 Smoothing Length (default 5): Tune the smoothness. Tight for fast markets, relaxed for chill ones.
T3 Volume Factor (default 0.7): Crank it up for snappy signals or down for silky trends.
Toggle the dashboard for minimalist setups or mobile trading.
How to Use It
Bullish Momentum (Lime, Right-Filled): Buyers are flexing. Look for breakouts or trend continuations. Pair with support levels.
Bearish Momentum (Red, Left-Filled): Sellers are in charge. Scout for breakdowns or shorts. Check resistance zones.
Neutral (Orange, Near Center): Market’s chilling. Avoid big bets—wait for a breakout or play the range.
Momentum Shift: A reversal might be brewing. Confirm with price action before jumping in.
Not a Solo Act: Combine with your strategy—trendlines, RSI, whatever. It’s a momentum lens, not a buy/sell bot.
Why Use the OFPI Gauge?
See the Fight: Most tools just count volume. OFPI shows who’s winning with a visual that slaps.
Works Anywhere: Crypto, stocks, forex, any timeframe. Tune it to your style.
Clean & Pro: No chart spam, just a sharp gauge and a dashboard that delivers.
Unique Edge: No other indicator blends body-based pressure, T3 smoothing, and a centered gauge like this.
The OFPI Gauge catches the market’s pulse so you can trade with confidence. It’s not about predicting the future—it’s about knowing who’s in control right now.
For educational purposes only. Not financial advice. Always use proper risk management.
Use with discipline. Trade your edge.
— Dskyz , for DAFE Trading Systems

AQPRO ScalperX📝 INTRODUCTION
AQPRO ScalperX is a trading indicator designed for fast-paced, intraday trading. It uses Donchian channel breakouts, combined with a proprietary filtering system, to catch buy and sell opportunities as close to the beginning as possible without losing quality of the signals.
On top of core signals, ScalperX includes a real-time max profit tracker, a multi-timeframe (MTF) dashboard, support and resistance zones, and risk management visualization tools like automatic rendering of TP and SL lines. The indicator is fully customizable for both its visuals and functional settings.
🎯 PURPOSE OF USAGE
This indicator was initially designed with the idea of trying to make such a tool, that would be able to catch trend reversal in the most safe way. In this particular situation term 'safe way' is very abstract and it is up to interpretation, but we decided that our definition will be 'trading with price breakouts' , meaning that we would like to capitalize on price breaking its previous structure in the direction opposite to the previous one.
You can clearly see on the chart how buy and sell signals are going one after another on the screenshot below:
This ensures that we follow trend consistently and without missing out on potential profits. Just like they say: " let the winners run ".
Even though indicator with similar goals already exist in the open market, we believe that our proprietary algorithms and filters for determining price breakouts can make a big difference to traders, which employ similar strategies on daily basis, by helping them understand where are the potential high-quality breakouts might be. We haven't found indicator with exact same functionality as ours, which means that traders will be able to leverage an actually new tool to generate new price insights.
In short, main goals of this indicator are as follows:
Catching high-quality price breakouts, filtered to reduce the amount of choppy moves and false signals;
Tracking potential profits in real-time, directly on trader's chart;
Organizing data visualization of data pf latest signals from chosen asset from multiple timeframe in one dashboard;
Automated highlighting of key support and resistance zones on the chart, which serve as confirmation for main signals;
⚙️ SETTINGS OVERVIEW
Options for customization of this indicator are straightforward, but let's review them to make things certainly clear:
🔑 ScalperX / Main Settings
Range — defines the "wideness" of the breakout boxes. Higher values create wider breakout zones and impact breakout sensitivity;
Filter — adjusts the spacing between breakout boxes, determining the strictness of signal filtering. Higher values lead to more selective and rarer signals;
Show Max Profit — displays a real-time line and label that updates when a trade achieves a new peak profit, measured in ticks.
⏰ MTF Signal / Main Settings
Show MTF Signals — enables the generation of buy/sell signals from selected higher timeframes, displayed as labels on the current chart;
Timeframe — specifies the higher timeframe to use for MTF signal detection, such as 1 hour (1h) or 4 hours (4h).
🗂️ MTF Dashboard / Main Settings
Show MTF Dashboard — activates a dashboard that tracks entries, TP, SL, and overall trade bias for one selected symbol across four customizable timeframes;
* Dashboard position ( Vertical ) — adjusts whether the dashboard appears on the Top, Middle, or Bottom of the chart;
* Dashboard position ( Horizontal ) — aligns the dashboard Left, Center, or Right within the chart window;
* the name of the parameter is hidden in the settings
🗂️ MTF Dashboard / Ticker
Ticker to Track — Allows you to choose the specific ticker symbol (e.g., BINANCE:BTCUSDT) for MTF tracking.
🗂️ MTF Dashboard / Timeframes
* Timeframe 1 — set the first timeframe for multi-timeframe analysis (e.g., 15 minutes);
* Timeframe 2 — set the second timeframe for multi-timeframe analysis (e.g., 30 minutes);
* Timeframe 3 — set the third timeframe for multi-timeframe analysis (e.g., 1 hour);
* Timeframe 4 — set the fourth timeframe for multi-timeframe analysis (e.g., 4 hours).
* the name of the parameter is hidden in the settings
🛡️ Risk Management / Main Settings
Show TP&SL — displays dynamic lines and labels for the entry, Take Profit (TP), and Stop Loss (SL) of the most recent signal, updated in real-time until a new signal triggers;
Risk-to-Reward Ratio (R:R) — defines the ratio for TP and SL calculation to control your risk and reward on every trade.
📐 Support & Resistance / Main Settings
Show Support & Resistance Zones — enables dynamic zones based on pivot points, colored bullish or bearish based on price context;
History Lookback — defines the number of bars to consider when calculating support and resistance levels. Increasing this results in zones derived from longer-term price structures.
🎨 Visual Settings / ScalperX
Bullish Box — defines the color for bullish breakout boxes;
Bearish Box — defines the color for bearish breakout boxes;
Max Profit — sets the color for the max profit line on the chart.
🎨 Visual Settings / S&R
Support — defines color used for standard support zones;
Resistance — defines color used for standard resistance zones;
Strong Support — defines special color for zones classified as "strong support";
Strong Resistance — defines special color for zones classified as "strong resistance".
🎨 Visual Settings / MTF Dashboard
Bullish — sets the color for bullish trade states in the MTF dashboard;
Bearish — sets the color for bearish trade states in the MTF dashboard.
🔔 Alerts / Main Settings
Buy & Sell — toggles alerts for buy and sell signals detected by the indicator in the current chart timeframe;
MTF Buy & Sell — toggles alerts for buy and sell signals detected across the selected MTF timeframes.
📈 APPLICATION GUIDE
Application flow of this indicator very easy to understand and get used to, because all of the necessary elements — analysis, drawing, alert — are already automated by our algorithms. Let's review how the indicator works.
Let's start with the most basic thing — how will your indicator look when you load it on your chart for the first time:
AQPRO ScalperX consists mainly of 6 logic blocks:
ScalperX signals;
Risk visualization;
Max Profit tracking;
MTF scalper signals;
MTF dashboard;
Support & Resistance zones.
Description of each logic block is provided in the corresponding sections below.
SCALPERX SIGNALS
Signals, generated by our indicator, are shown on the chart as coloured up/down triangle. When a signal appears on the chart, indicator also create a box of length equal to 'Range' parameter from "Main Settings" group of settings. This box is intended to show which area of the price was broken by current candle.
It also important to acknowledge, the breakout itself happens only when price closes beyond broken price area with its close (!) price . Breakouts with highs or lows are not counted. This reduces the amount of low-quality signals and ensures that only the strong breakout will appear on the chart.
VERY IMPORTANT NOTE: all signals are considered valid only on the close of the candle, which triggered the signal, so if you want to enter a trade by any signal, wait for its candle to close and open your trade right on the next candle.
Talking about scalper's settings, we need to shed a light on how the changes in them affect signal's quality.
Parameter 'Range' defines the amount of bars, that will be review prior to current candle to determine wether the price area of this bars is good enough to track and if current candle actually broke this price area.
👍 Rule of thumb : the higher the 'Range' is, the "wider" the boxes. Also the with the increase of this parameter rises the lag of the signals, so be carefully with setting high values to this parameter.
See the visual showcase of signals with different 'Range' parameters on the screenshot below:
The example above features two instancies of ScalperX with two different 'Range' parameter values: 15 (leftchart) and 5 (right chart). You can clearly see, that on left chart here are 2 signals in comparison to 6 signals on right chart. Also signals on the left side have bigger lag and they don't catch the start of the move in comparison to how quickly tops and bottoms are catched with low 'Range' . However, low 'Range' will lead to excessive amount of signals, quality of which during 'whipsaw' markets is not that great.
✉️ Our advice on how to optimally set 'Range' parameter:
Use low values to trade during the times, when there are a lot of clean up and down impulses. This way you will catch reversal opportunities sooner and the quality of the signals will still be great;
Use high values on the 'whipsaw' markets. This will filter out many bad signals, that you would get with low-value 'Range' , and will drastically reduces amount of losing trades.
Talking about the 'Filter' parameter, this particular setting defines the 'strictness' of rules which will be applied to price area validation process. Essentially, the higher this parameter is, the stronger price impulse has to be confirm the breakout. However, changes in this parameter will not impact the "wideness" of boxes at all.
👍 Rule of thumb : the higher the 'Filter' is, the more separated the signal will be. Setting this parameter to high value will lead to increase in lag and big reduction in amount of signals, so be careful this parameter to high values.
See the visual showcase of signals with different 'Filter' parameters on the screenshot below:
The example above features two instancies of ScalperX with two different 'Filter' parameter values: 20 (left chart) and 2.5 (right chart). You can clear see, that low 'Filter' generated 6 signals, while higher one generated only 4 signals. However if you look closer, you will see that 2 signals, that existing in the yellow dashed area on the right chart, don't exist in the same area on the left chart. This is because high value of this parameter requires price impulse to be very strong in order for the indicator to mark this breakout as a valid one. What is more important is that these 2 'missing' signals were actually bad and, technically, we actually cut our losses in this case with high value of 'Filter' . You can see that the leftmost sell signal on the left chart eventually closed in a nice profit, in comparison to the same trade being closed in a loss on the right chart because of the 2 signals that we were talking about above.
It is important to note, that setting 'Filter' to low values will not affect performance this much as it low value of 'Range' do, because the indicator already works on low values of this parameter by default and the signals on average are already good enough for trading.
✉️ Our advice on how to optimally set 'Filter' parameter:
Use low values to trade on the markets with clean up and down impulses. This way you avoid excessive filtering and leave a room for good signals to come right at you;
Use high values to trade on 'whipsaw' markets. Higher values of this parameter on these markets have same effect as high 'Range' parameter: filtering false signals and leaving room for actually strong price impulses, which you will later capitalize on.
RISK VISUALIZATION (TP&SL)
Rendering Take-Profits and Stop-Losses in our indicator works quite simple: for each new trade indicator creates new pairs of lines and labels for TP and SL, while lines & labels from previous trade are erased for aesthetics purposes. Each label shows price coordinates, so that each trader would be able to grap the numbers in seconds.
See the visual showcase of TP & SL visualization on the screenshot below:
Also, whenever TP or SL of the current trade is reached, drawing of both TP and SL stops. When the TP is reached, additional '✅' emoji on the TP price is shown as confirmation of Take-Profit.
However, while TP or SL has not been reached, TP&SL labels and lines will be prolonged until one of them will be reached or new signals will come.
See the visual showcase of TP & SL stopping being visualized & TP on the screenshot below:
MAX PROFIT TRACKING
This mechanic is not particularly a new one in field of trading, but people usually forgot that it can be a useful indicator of state of the market:
when lines and labels of Max Profit are far from entry points on consistent basis , it usually means that indicator's signals actually can catch a beginning of good price moves, which enables trader to capitalize on them;
when lines and labels of Max Profit are close to entry points on consistent basis , it means that either market is choppy or the indicator can't catch trading opportunities in time. To 'fix' this you can try to reconfigure scalper's parameters, which were described above.
Principles of Max Profit in this indicator are of industry-standard: when price updates its extremum and 'generates' more profit than it previously did, Max Profit label and line change their position to this extremum. Max Profit label displays the maximum potential amount of profit that a trader could have got during this trade in pips (!) .
See the visual showcase of Max Profit work on the screenshot below:
MTF SCALPER SIGNALS
The principles of these signals are exactly the same as principles for classic Scalper signals. Refer to 'Scalper Signals' section above to rehearse the knowledge.
Logic behind these signals is very simple:
We take classic Scalper signals;
We request the data about these latest signals from specific other timeframe ( user can choose it in the settings );
If such signals appeared, we display it on the chart as a big label with timeframe value inside of it. In comparison to classic signals, no additional boxes are created . TP&SL functionality doesn't cover MTF signals, so don't expect to see TP&SL lines and labels for MTF signals.
See the visual showcase of MTF Scalper signals on the screenshot below:
MTF DASHBOARD
The functionality of the dashboard is pretty simple, but it makes the dashboard itself a very powerful tool in a hands of experienced trader.
Let's review structure of MTF dashboard on the screenshot below:
The important feature of MTF dashboard is that its tracks latest trade's data from a particular ticker and its four timeframes, all of which any trader chooses in the settings. This means, that you can be on asset ABC , but track the data from asset XYZ . This allows for a quick scan of sentiment from different assets and their timeframes, which gives traders a clue on what is the trend on these assets both on lower and higher timeframes at the same moment and saves a lot of time from jumping from one asset & timeframe to another.
To see that this is exactly the case with our indicator, see the screenshot below:
Needless to say, that you can track current asset in the dashboard as well. This will have the same benefits, described in the paragraph above.
You can also customize colours for bullish and bearish patterns for MTF Dashboard in the settings.
SUPPORT & RESISTANCE ZONES
Support & resistance (S&R) zones are a great tool for confirming Scalper signals in complex situations. Using these zones to determine whether or a particular entry opportunity is good is a practice of professional traders, which we specifically added to our indicator for the reason of improving the quality of Scalper signals in long run.
The mechanics behind these zones is based on pivot points, the lookback for which you can customize in the parameter called 'History Lookback (Bars)' in "Support & Resistance / Main Settings" group of settings. Increasing this parameter will lead to a appearance of more 'global' zones, but they will appear much rarer, rather then zones, generated with low values of this parameter.
The quality of these zones doesn't change much when changing this parameter — it only changes the frequency of the zones on the chart. Zones, generated from high values of this parameter are more suitable for long-term trading, while zones, generated from low value of this parameter, are more suitable for short-term trading.
It also important to mention that any zone on the chart is considered active only until the moment its farther border ( top border for resistance zones and bottom border for support zones) is reached by price's high or low .
Take a look on the screenshot below to see which zones does the indicator draw:
Let's review the zones themselves now:
Classic Support/Resistance Zone — a standard zone, which on average has amedium success rate to reverse the price when collided with it;
High-buyer-volume/High-seller-volume Support/Resistance Zone — a stronger zone, which on average has much better success rate to reverse the price when collided with it. Classic zone is marked as high-volume only if the up/down volume near the pivot point of this zone is greater than a certain threshold ( not changeable );
Extreme Support/Resistance Zone — a zone, which appeared beyond price's least-possible-to-cross levels, and has to the highest success rate of reversing the price on encounter across the zones, mentioned previously. Classic zone, which appeared beyond certain price levels, calculated with our proprietary risk system, is considered extreme. Classic zone doesn't need to be high-volume to become an Extreme Zone!
High-buyer-volume/High-seller-volume Extreme Support/Resistance Zone — an Extreme Zone, which has also passed up/down volume evolution process, mentioned in the point 2 .
Trading with the zones, mentioned above, with highest-on-paper success rate — especially Extreme Zones — does NOT guarantee you a price reversal when the price will reach this zone. However, by conducting our own extensive research with this indicator, we have found that using these zone will actually help you increase your success rate on average, because using these zones as confirmation systems filter out quite a number of false signals on average.
It is also important to mention, that opacity (same as 'transparency') of S&R zones depends on the volume of around zone's pivot point:
if volume is high , zone has 'brighter' (less opacity) colour;
if volume is low , zone has 'darker' (more opacity) colour.
Let's review examples of Scalper signal, which 1) where filtered out by our S&R zones and 2) where confirmed by our S&R zones. See the screenshot below:
The example above clearly shows the importance of having an S&R zone confirming the signal. This kind of 'team work' between of Scalper signals and S&R zones results in filtering lots of bad signals and confirmation of truly strong ones.
🔔 ALERTS
This indicator employs alerts for an event when new signal occurs on the current timeframe or on MTF timeframe. While creating the alert below 'Condition' field choose 'any alert() function call'.
When this alert is triggered, it will generate this kind of message:
// Alerts for current timeframe
string msg_template = "EXCHANGE:ASSET, TIMEFRAME: BUY_OR_SELL"
string msg_example = "BINANCE:BTCUSDT, 15m: Buy"
// Alerts for MTF timeframe
string msg_template_mtf = "MTF / EXCHANGE:ASSET, TIMEFRAME: BUY_OR_SELL"
string msg_example_mtf = "MTF / BINANCE:BTCUSDT, 1h: Buy"
📌 NOTES
This indicators works best on assets with high liquidity; most suitable timeframes range from 1m to 4h (depends on your trading style) ;
Seriously consider using S&R zones as confirmation to main Scalper signals or any of your own signals. Confirmation process may filter out a lot of signals, but your PNL History will say "thank you" to you in the long-run and you will see yourself how good confirmed signals actually do work;
Don't forget to look at MTF dashboard from time to time to see global sentiment. This will help you time your entry moments better and will improve your performance in the long run;
This indicator can serve both as primary source of signals and as confirmation tool, but we advise to try to combine it with your own strategy frst to see if it will improve your performance.
🏁 AFTERWORD
AQPRO ScalperX was designed to help traders identify high-quality price breakouts and generate market insights based on them, which include signal generation. Main feature of this indicator is Scalper algorithm, which generate price-breakout-based signals directly on your chart.
Alongside these signals you can leverage 1) MTF Dashboard to track latest trade's data from chosen asset and its four timeframes, 2) risk visualization functionality (TP&SL) to improve understanding of current market risks and 3) Support & Resistance zones, which serve as a great confirmation tool for Scalper signals, but can also work with any other signal generation tool to enhance its performance.
ℹ️ If you have questions about this or any other our indicator, please leave it in the comments.

Multitimeframe Order Block Finder (Zeiierman)█ Overview
The Multitimeframe Order Block Finder (Zeiierman) is a powerful tool designed to identify potential institutional zones of interest — Order Blocks — across any timeframe, regardless of what chart you're viewing.
Order Blocks are critical supply and demand zones formed by the last opposing candle before an impulsive move. These areas often act as magnets for price and serve as smart-money footprints — ideal for anticipating reversals, retests, or breakouts.
This indicator not only detects such zones in real-time, but also visualizes their mitigation, bull/bear volume pressure, and a smoothed directional trendline based on Order Block behavior.
█ How It Works
The script fetches OHLCV data from your chosen timeframe using request.security() and processes it using strict pattern logic and volume-derived strength conditions. It detects Order Blocks only when the structure aligns with dominant pressure and visually extends valid zones forward for as long as they remain unmitigated.
⚪ Bull/Bear Volume Power Visualization
Each OB includes proportional bars representing estimated buy/sell effort:
Buy Power: % of volume attributed to buyers
Sell Power: % of volume attributed to sellers
This adds a visual, intuitive layer of intent — showing who controlled the price before the OB formed.
⚪ Order Block Trendline (Butterworth Filtered)
A smoothed trendline is derived from the average OB value over time using a two-pole Butterworth low-pass filter. This helps you understand the broader directional pressure:
Trendline up → favor bullish OBs
Trendline down → favor bearish OBs
█ How to Use
⚪ Trade From Order Blocks Like Institutions
Use this tool to find institutional footprints and reaction zones:
Enter at unmitigated OBs
⚪ Volume Power
Volume Pressure Bars inside each OB help you:
Confirm strong buyer/seller dominance
Detect possible traps or exhaustion
Understand how each zone formed
⚪ Find Trend & Pullbacks
The trendline not only helps traders detect the current trend direction, but the built-in trend coloring also highlights potential pullback areas within these trends.
█ Settings
Timeframe – Selects which timeframe to scan for Order Blocks.
Lookback Period – Defines how many bars back are used to detect bullish or bearish momentum shifts.
Sensitivity – When enabled, the indicator uses smoothed price (RMA) with rising/falling logic instead of raw candle closes. This allows more flexible detection of trend shifts and results in more Order Blocks being identified.
Minimum Percent Move – Filters out weak moves. Higher = only strong price shifts.
Mitigated on Mid – OB is removed when price touches its midpoint.
Show OB Table – Displays a panel listing all active (unmitigated) Order Blocks.
Extend Boxes – Controls how far OB boxes stretch into the future.
Show OB Trend – Toggles the trendline derived from Order Block strength.
Passband Ripple (dB) – Controls trendline reactivity. Higher = more sensitive.
Cutoff Frequency – Controls smoothness of trendline (0–0.5). Lower = smoother.
-----------------
Disclaimer
The content provided in my scripts, indicators, ideas, algorithms, and systems is for educational and informational purposes only. It does not constitute financial advice, investment recommendations, or a solicitation to buy or sell any financial instruments. I will not accept liability for any loss or damage, including without limitation any loss of profit, which may arise directly or indirectly from the use of or reliance on such information.
All investments involve risk, and the past performance of a security, industry, sector, market, financial product, trading strategy, backtest, or individual's trading does not guarantee future results or returns. Investors are fully responsible for any investment decisions they make. Such decisions should be based solely on an evaluation of their financial circumstances, investment objectives, risk tolerance, and liquidity needs.
