Malama's Heikin CountMalama's Heikin Count is a Pine Script indicator designed to enhance price action analysis by combining Heikin Ashi candlestick calculations with a normalized measurement of upper and lower shadow sizes. The indicator overlays Heikin Ashi candles on the chart and displays the relative sizes of upper and lower shadows as numerical labels (scaled from 1 to 10) for candles within the last two days, starting from 9:00 AM each day. This tool aims to help traders identify the strength of price movements and potential reversals by quantifying the significance of candlestick shadows in the context of Heikin Ashi’s smoothed price data. It is particularly useful for day traders and swing traders who rely on candlestick patterns to gauge market sentiment and momentum.
The indicator solves the problem of interpreting raw candlestick data by providing a smoothed visualization through Heikin Ashi candles and a simplified, numerical representation of shadow sizes. This allows traders to quickly assess whether a candle’s upper or lower shadow indicates strong buying or selling pressure, aiding in decision-making for entries, exits, or reversals.
Originality and Usefulness
Originality: While Heikin Ashi candles are a well-known technique for smoothing price data and reducing noise, Malama's Heikin Count introduces a novel feature by calculating and normalizing the sizes of upper and lower shadows relative to the total candle height. Unlike standard Heikin Ashi implementations, which focus solely on candle body trends, this indicator quantifies shadow proportions and presents them on a standardized 1–10 scale. This normalization makes it easier for traders to compare shadow significance across different timeframes and assets without needing to manually interpret raw measurements. The restriction of shadow size labels to the last two days from 9:00 AM ensures relevance for active trading sessions, avoiding clutter from older data.
Usefulness: The indicator is particularly valuable for traders who combine candlestick pattern analysis with trend-following strategies. By integrating Heikin Ashi’s trend-smoothing capabilities with shadow size metrics, it provides a unique perspective on market dynamics. For example, large upper shadows (high normalized values) may indicate rejection at resistance levels, while large lower shadows may suggest support or buying pressure. Unlike other open-source Heikin Ashi indicators, which typically focus only on candle plotting, this script’s shadow size normalization and time-based filtering offer a distinctive tool for intraday and short-term trading strategies.
Detailed Methodology ("How It Works")
The core logic of Malama's Heikin Count revolves around three main components: Heikin Ashi candle calculations, shadow size analysis, and time-based filtering for label display. Below is a breakdown of how these components work together:
Heikin Ashi Candle Calculations:
The script calculates Heikin Ashi candles to smooth price data and reduce market noise, making trends easier to identify.
Formulas:
haClose = (open + high + low + close) / 4: The Heikin Ashi close is the average of the current bar’s open, high, low, and close prices.
haOpen = na(haOpen ) ? (open + close) / 2 : (haOpen + haClose ) / 2: The Heikin Ashi open is either the average of the current bar’s open and close (for the first bar) or the average of the previous Heikin Ashi open and close.
haHigh = max(high, max(haOpen, haClose)): The Heikin Ashi high is the maximum of the current bar’s high, Heikin Ashi open, and Heikin Ashi close.
haLow = min(low, min(haOpen, haClose)): The Heikin Ashi low is the minimum of the current bar’s low, Heikin Ashi open, and Heikin Ashi close.
These calculations produce smoothed candles that emphasize trend direction and reduce the impact of short-term price fluctuations.
Shadow Size Analysis:
The script calculates the upper and lower shadows of each Heikin Ashi candle to assess market sentiment.
Formulas:
upperShadow = haHigh - max(haClose, haOpen): Measures the length of the upper shadow (distance from the top of the candle body to the high).
lowerShadow = min(haClose, haOpen) - haLow: Measures the length of the lower shadow (distance from the bottom of the candle body to the low).
totalHeight = haHigh - haLow: Calculates the total height of the candle (from high to low).
upperShadowPercentage = (upperShadow / totalHeight) * 100: Converts the upper shadow length to a percentage of the total candle height.
lowerShadowPercentage = (lowerShadow / totalHeight) * 100: Converts the lower shadow length to a percentage of the total candle height.
Normalization: The normalizeShadowSize function scales the shadow percentages to a 1–10 range using math.round(value / 10). This ensures that shadow sizes are presented in an easily interpretable format, where 1 represents a very small shadow (less than 10% of the candle height) and 10 represents a very large shadow (90–100% of the candle height). The normalization caps values between 1 and 10 for consistency.
Time-Based Filtering:
The script only displays shadow size labels for candles within the last two days, starting from 9:00 AM each day. This is achieved by calculating a start timestamp using timestamp(year(timenow), month(timenow), dayofmonth(timenow) - daysBack, startHour, startMinute), where daysBack = 2, startHour = 9, and startMinute = 0.
The condition time >= startTime ensures that labels are only plotted for candles within this time window, keeping the chart relevant for recent trading activity and avoiding clutter from older data.
Signal Generation:
The script does not generate explicit buy or sell signals but provides visual cues through shadow size labels. Large upper shadow sizes (e.g., 8–10) may indicate selling pressure or resistance, while large lower shadow sizes may suggest buying pressure or support. Traders can use these metrics in conjunction with the Heikin Ashi candle colors (green for bullish, red for bearish) to make trading decisions.
Strategy Results and Risk Management
Backtesting: The script is an indicator and does not include built-in backtesting or strategy logic for generating buy/sell signals. As such, it does not assume specific commission, slippage, or account sizing parameters. Traders using this indicator should incorporate it into their existing strategies, applying their own risk management rules.
Risk Management Guidance:
Traders can use the shadow size labels to inform risk management decisions. For example, a large upper shadow (e.g., 8–10) at a resistance level may prompt a trader to set a tighter stop-loss above the candle’s high, anticipating a potential reversal. Conversely, a large lower shadow at a support level may suggest a wider stop-loss below the low to account for volatility.
Default settings (e.g., 2-day lookback, 9:00 AM start) are designed to focus on recent price action, which is suitable for intraday and short-term swing trading. Traders should combine the indicator with other tools (e.g., support/resistance levels, trendlines) to define risk limits, such as risking 5–10% of equity per trade.
The indicator does not enforce specific risk management settings, allowing traders to customize their approach based on their risk tolerance and trading style.
User Settings and Customization
The script includes the following user-customizable inputs:
Days Back (daysBack = 2):
Description: Controls the lookback period for displaying shadow size labels. The default value of 2 means labels are shown for candles within the last two days.
Impact: Increasing daysBack extends the time window for label display, which may be useful for longer-term analysis but could clutter the chart. Decreasing it focuses on more recent data, ideal for intraday trading.
Start Hour (startHour = 9) and Start Minute (startMinute = 0):
Description: Defines the start time of the trading day (default is 9:00 AM). Labels are only shown for candles after this time each day within the lookback period.
Impact: Traders can adjust these settings to align with their preferred trading session (e.g., 9:30 AM for U.S. market open). Changing the start time shifts the time window for label display, affecting which candles are analyzed.
These settings allow traders to tailor the indicator to their trading timeframe and session preferences, ensuring that the shadow size labels remain relevant to their analysis.
Visualizations and Chart Setup
The indicator plots the following elements on the chart:
Heikin Ashi Candles:
Plotted using plotcandle(haOpen, haClose, haHigh, haLow), these candles overlay the standard price chart.
Color Coding: Green candles indicate bullish momentum (Heikin Ashi close ≥ open), while red candles indicate bearish momentum (Heikin Ashi close < open).
These candles provide a smoothed view of price trends, making it easier to identify trend direction and continuations.
Shadow Size Labels:
Upper Shadow Labels: Displayed above each candle at the Heikin Ashi high, showing the normalized upper shadow size (1–10). These labels are green with white text and use the label.style_label_down style for clear visibility.
Lower Shadow Labels: Displayed below each candle at the Heikin Ashi low, showing the normalized lower shadow size (1–10). These labels are red with white text and use the label.style_label_up style.
Labels are only shown for candles within the last two days from 9:00 AM, ensuring that only recent and relevant data is visualized.
Debugging Labels (Optional):
A blue label at the bottom of the chart displays the text "Upper: Lower: " for each candle, showing both shadow sizes for debugging purposes. This can be removed or commented out if not needed, as it is primarily for development use.
The visualizations are designed to be minimal and focused, ensuring that traders can quickly interpret the Heikin Ashi trend and shadow size metrics without unnecessary clutter. The use of color-coded candles and labels enhances readability, while the time-based filtering keeps the chart clean and relevant.
Search in scripts for "Candlestick"

Canuck Trading IndicatorOverview
The Canuck Trading Indicator is a versatile, overlay-based technical analysis tool designed to assist traders in identifying potential trading opportunities across various timeframes and market conditions. By combining multiple technical indicators—such as RSI, Bollinger Bands, EMAs, VWAP, MACD, Stochastic RSI, ADX, HMA, and candlestick patterns—the indicator provides clear visual signals for bullish and bearish entries, breakouts, long-term trends, and options strategies like cash-secured puts, straddles/strangles, iron condors, and short squeezes. It also incorporates 20-day and 200-day SMAs to detect Golden/Death Crosses and price positioning relative to these moving averages. A dynamic table displays key metrics, and customizable alerts help traders stay informed of market conditions.
Key Features
Multi-Timeframe Adaptability: Automatically adjusts parameters (e.g., ATR multiplier, ADX period, HMA length) based on the chart's timeframe (minute, hourly, daily, weekly, monthly) for optimal performance.
Comprehensive Signal Generation: Identifies short-term entries, breakouts, long-term bullish trends, and options strategies using a combination of momentum, trend, volatility, and candlestick patterns.
Candlestick Pattern Detection: Recognizes bullish/bearish engulfing, hammer, shooting star, doji, and strong candles for precise entry/exit signals.
Moving Average Analysis: Plots 20-day and 200-day SMAs, detects Golden/Death Crosses, and evaluates price position relative to these averages.
Dynamic Table: Displays real-time metrics, including zone status (bullish, bearish, neutral), RSI, MACD, Stochastic RSI, short/long-term trends, candlestick patterns, ADX, ROC, VWAP slope, and MA positioning.
Customizable Alerts: Over 20 alert conditions for entries, exits, overbought/oversold warnings, and MA crosses, with actionable messages including ticker, price, and suggested strategies.
Visual Clarity: Uses distinct shapes, colors, and sizes to plot signals (e.g., green triangles for bullish entries, red triangles for bearish entries) and overlays key levels like EMA, VWAP, Bollinger Bands, support/resistance, and HMA.
Options Strategy Signals: Suggests opportunities for selling cash-secured puts, straddles/strangles, iron condors, and capitalizing on short squeezes.
How to Use
Add to Chart: Apply the indicator to any TradingView chart by selecting "Canuck Trading Indicator" from the Pine Script library.
Interpret Signals:
Bullish Signals: Green triangles (short-term entry), lime diamonds (breakout), blue circles (long-term entry).
Bearish Signals: Red triangles (short-term entry), maroon diamonds (breakout).
Options Strategies: Purple squares (cash-secured puts), yellow circles (straddles/strangles), orange crosses (iron condors), white arrows (short squeezes).
Exits: X-cross shapes in corresponding colors indicate exit signals.
Monitor: Gray circles suggest holding cash or monitoring for setups.
Review Table: Check the top-right table for real-time metrics, including zone status, RSI, MACD, trends, and MA positioning.
Set Alerts: Configure alerts for specific signals (e.g., "Short-Term Bullish Entry" or "Golden Cross") to receive notifications via TradingView.
Adjust Inputs: Customize input parameters (e.g., RSI period, EMA length, ATR period) to suit your trading style or market conditions.
Input Parameters
The indicator offers a wide range of customizable inputs to fine-tune its behavior:
RSI Period (default: 14): Length for RSI calculation.
RSI Bullish Low/High (default: 35/70): RSI thresholds for bullish signals.
RSI Bearish High (default: 65): RSI threshold for bearish signals.
EMA Period (default: 15): Main EMA length (15 for day trading, 50 for swing).
Short/Long EMA Length (default: 3/20): For momentum oscillator.
T3 Smoothing Length (default: 5): Smooths momentum signals.
Long-Term EMA/RSI Length (default: 20/15): For long-term trend analysis.
Support/Resistance Lookback (default: 5): Periods for support/resistance levels.
MACD Fast/Slow/Signal (default: 12/26/9): MACD parameters.
Bollinger Bands Period/StdDev (default: 15/2): BB settings.
Stochastic RSI Period/Smoothing (default: 14/3/3): Stochastic RSI settings.
Uptrend/Short-Term/Long-Term Lookback (default: 2/2/5): Candles for trend detection.
ATR Period (default: 14): For volatility and price targets.
VWAP Sensitivity (default: 0.1%): Threshold for VWAP-based signals.
Volume Oscillator Period (default: 14): For volume surge detection.
Pattern Detection Threshold (default: 0.3%): Sensitivity for candlestick patterns.
ROC Period (default: 3): Rate of change for momentum.
VWAP Slope Period (default: 5): For VWAP trend analysis.
TradingView Publishing Compliance
Originality: The Canuck Trading Indicator is an original script, combining multiple technical indicators and custom logic to provide unique trading signals. It does not replicate existing public scripts.
No Guaranteed Profits: This indicator is a tool for technical analysis and does not guarantee profits. Trading involves risks, and users should conduct their own research and risk management.
Clear Instructions: The description and usage guide are detailed and accessible, ensuring users understand how to apply the indicator effectively.
No External Dependencies: The script uses only built-in Pine Script functions (e.g., ta.rsi, ta.ema, ta.vwap) and requires no external libraries or data sources.
Performance: The script is optimized for performance, using efficient calculations and adaptive parameters to minimize lag on various timeframes.
Visual Clarity: Signals are plotted with distinct shapes and colors, and the table provides a concise summary of market conditions, enhancing usability.
Limitations and Risks
Market Conditions: The indicator may generate false signals in choppy or low-liquidity markets. Always confirm signals with additional analysis.
Timeframe Sensitivity: Performance varies by timeframe; test settings on your preferred chart (e.g., 5-minute for day trading, daily for swing trading).
Risk Management: Use stop-losses and position sizing to manage risk, as suggested in alert messages (e.g., "Stop -20%").
Options Trading: Options strategies (e.g., straddles, iron condors) carry unique risks; consult a financial advisor before trading.
Feedback and Support
For questions, suggestions, or bug reports, please leave a comment on the TradingView script page or contact the author via TradingView. Your feedback helps improve the indicator for the community.
Disclaimer
The Canuck Trading Indicator is provided for educational and informational purposes only. It is not financial advice. Trading involves significant risks, and past performance is not indicative of future results. Always perform your own due diligence and consult a qualified financial advisor before making trading decisions.

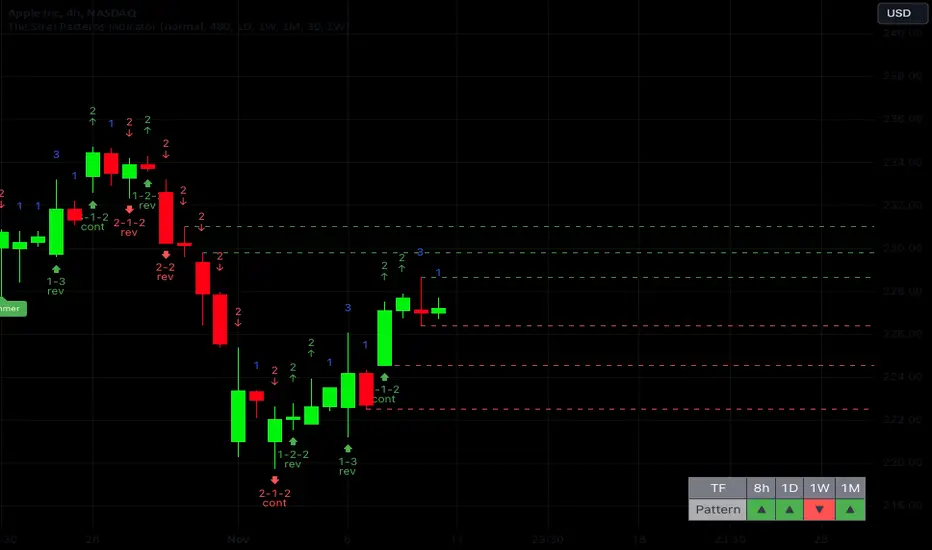
The Strat Patterns Indicator v1.0The Strat Patterns Indicator is a tool that draws Strat patterns in real-time, highlights Strat scenarios, key levels, and helps traders effectively apply the Strat trading strategy.
It combines features such as pattern recognition, timeframe continuity analysis, target level highlighting, and custom alerts to simplify trading decisions and maximize profit potential.
Display All Strat Patterns
The Strat Patterns Indicator shows all Strat patterns directly on your chart, making it easier to spot trading opportunities in real-time. You can choose to show or hide specific patterns based on your preferences. The patterns include:
2-2 Continuation
2-2 Reversal
3-2-2 Reversal
2-1-2 Continuation
2-1-2 Reversal
1-2-2 Reversal
3-1-2 Continuation
1-3 Reversal
3-1-2 Reversal
Highlight Major Candlestick Patterns
The indicator highlights important candlestick formations that are crucial for forecasting the major trend reversals in the market. These candlestick patterns include:
Hammer
Shooting Star
Doji
Gravestone Doji
Dragonfly Doji
Morning Doji Star
Evening Doji Star
By showcasing these patterns, the indicator helps traders quickly identify possible reversals or continuations, providing an extra layer of confirmation for trading decisions.
Timeframe Continuity Table
This indicator includes a customizable table that displays timeframe continuity, allowing you to align your trades with the overall market trend. You can select up to four higher timeframes to monitor, helping you ensure that your trades follow the broader trend direction.
This feature makes it easy to identify whether the market trend is aligned across multiple timeframes, enhancing your ability to make high-probability trades.
Show Target Levels (Previous Highs/Lows)
The indicator highlights target levels based on previous highs or lows, making it easier to set realistic profit targets and manage trades effectively.
By identifying these key levels, you can better gauge potential price movements and plan your trades with greater precision, ensuring that you maximize profit opportunities while minimizing risk.
Highlight Higher Timeframe Target Levels
This feature allows you to display target levels from a higher timeframe while trading on a lower timeframe.
For example, if you are trading on a 4-hour chart, you can choose to show daily target levels, including high/low levels and Fibonacci golden ratios. This helps you identify more significant profit targets and enhances your ability to capture larger moves while staying aligned with the overall trend.
Breakout Confirmation
The indicator provides an option to display the previous candlestick's high or low value, helping you confirm breakouts in Strat patterns. This feature is useful for validating whether a true breakout has occurred, giving you greater confidence in your trade entries and helping you avoid potential false breakouts.
Alerts for Strat Patterns
With this feature, you can set up alerts that trigger whenever a Strat pattern forms. This ensures you never miss a trading opportunity, keeping you informed and ready to act when key patterns emerge. The alerts provide real-time notifications, allowing you to stay on top of market movements without constantly monitoring your charts.
Engulfing BoxThe Engulfing Box indicator is a custom script designed to visually highlight and track bullish and bearish engulfing candlestick patterns on a price chart. These patterns are often used to identify potential reversal points, making them valuable for technical analysis. The script dynamically draws colored boxes around these patterns, helping users easily spot them in the price action.
Key Features:
Bullish Engulfing Pattern: When a candlestick fully engulfs the previous bearish candle (i.e., the close of the current candle is higher than the open of the previous candle, and the open is lower than the close of the previous candle), the script draws a green box around the bullish engulfing candle. This box is drawn from the open of the previous candle to the low of the previous candle.
Bearish Engulfing Pattern: When a candlestick fully engulfs the previous bullish candle (i.e., the close of the current candle is lower than the open of the previous candle, and the open is higher than the close of the previous candle), a red box is drawn around the bearish engulfing candle. This box is drawn from the open of the previous candle to the high of the previous candle.
Dynamic Box Management: Once an engulfing pattern is detected, a box is drawn with the following attributes:
Bullish Engulfing Box: Green, with a transparent background.
Bearish Engulfing Box: Red, with a transparent background.
The box will adjust its color to gray if the price moves past certain thresholds, indicating that the engulfing pattern may no longer be as relevant.
Max Pattern Tracking: The script limits the number of engulfing boxes tracked on the chart to prevent clutter. The maximum number of bullish and bearish engulfing patterns shown is customizable (set to 500 by default), and once this limit is exceeded, older boxes are deleted to maintain a clean chart.
Pattern Expiry: Boxes are deleted if price action moves beyond the pattern’s range, ensuring that outdated signals are removed. If the low price falls below the bottom of the bullish engulfing box, or the high price rises above the top of the bearish engulfing box, the respective box is removed. Additionally, if the low price moves below the top of the bullish box or the high price exceeds the bottom of the bearish box, the box's color is changed to a more neutral tone.
How it Works:
Pattern Detection: The script compares the current price data with the previous candlestick to detect the bullish or bearish engulfing patterns.
Box Creation: If a pattern is detected, a colored box is drawn around the candle to visually highlight the pattern.
Pattern Expiry and Cleanup: The script continuously monitors past boxes. If the price moves too far from the box’s range, the box is either deleted or altered to reflect the reduced significance of the pattern.
B ox Count Limit: To avoid clutter, the script ensures that no more than 500 bullish or bearish engulfing boxes are shown at any time.
Customization:
The number of previous bars to scan for engulfing patterns can be adjusted (maxBarsback).
The maximum number of patterns displayed at any time can be modified.

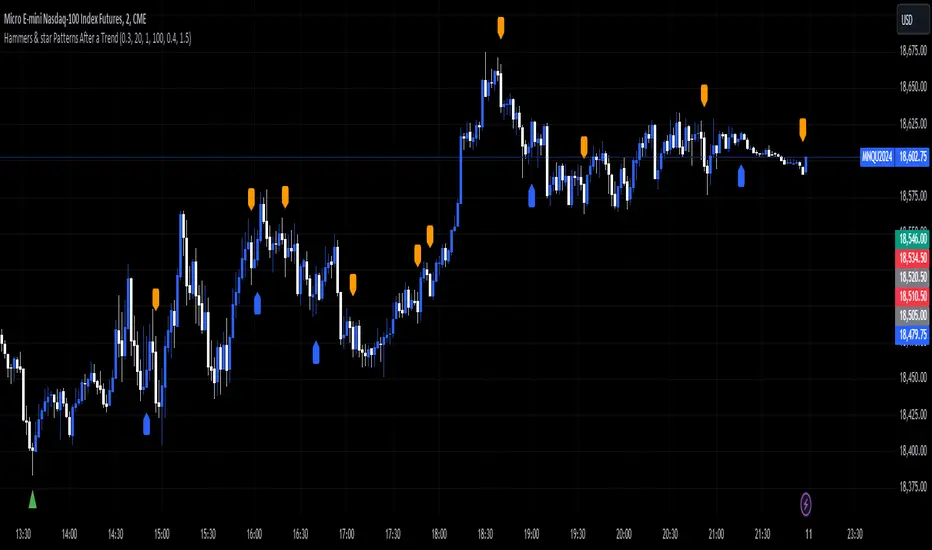
Hammers & star Patterns After a Trend
1. **Candlestick Patterns Detection:**
- **Hammers** and **Inverted Hammers** are specific candlestick patterns that can indicate potential reversals in the market.
- **Hammer**: A candle with a small body and a long lower wick, showing a possible reversal after a downtrend.
- **Inverted Hammer**: A candle with a small body and a long upper wick, indicating a possible reversal after an uptrend.
2. **Volume Consideration:**
- The script checks if these patterns occur with **high trading volume**. If the volume is significantly higher than the average volume over a certain period, the pattern is highlighted.
3. **Trend Detection:**
- The script looks for a significant trend before the pattern appears:
- **Downtrend**: A significant downward movement in price is required before a Hammer is considered.
- **Uptrend**: A significant upward movement is required before an Inverted Hammer is considered.
4. **Additional Patterns:**
- **Morning Star** and **Evening Star** patterns are also detected:
- **Morning Star**: A three-candle pattern where the first candle is a large bearish candle, followed by a small-bodied candle, and then a large bullish candle, indicating a potential reversal from downtrend to uptrend.
- **Evening Star**: The opposite pattern, signaling a potential reversal from uptrend to downtrend.
5. **Visual Indicators:**
- The script **plots arrows** and **labels** on the chart to show where these patterns occur:
- **Hammers** and **Inverted Hammers** are marked with triangle arrows.
- **Morning Stars** and **Evening Stars** are marked with labels.
In summary, this script helps traders identify key candlestick patterns that may signal potential reversals in price trends, with special emphasis on patterns that occur with high volume and after significant price movements.
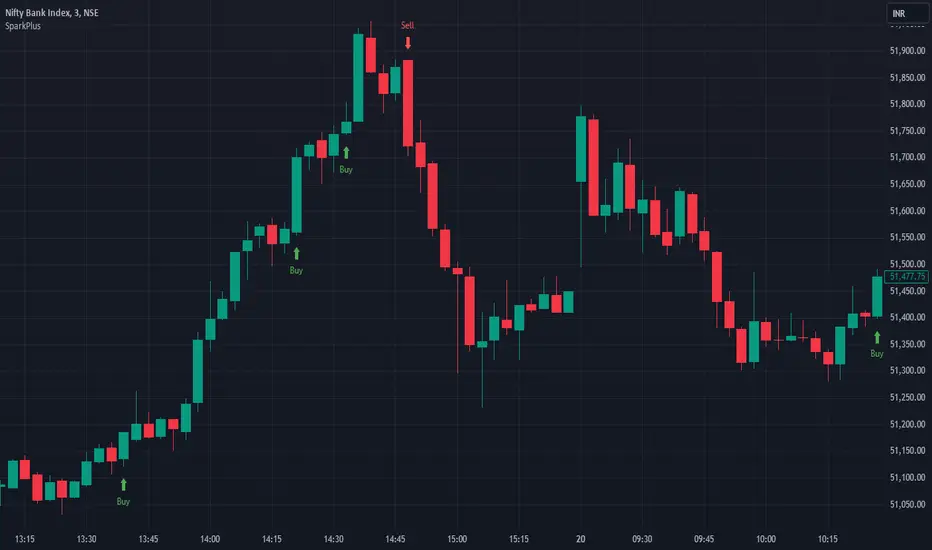
SparkPlusSparkPlus Indicator
The SparkPlus indicator is an advanced tool designed for real-time options trading, leveraging a unique combination of candlestick patterns and custom trade management logic. Unlike standard candlestick pattern indicators, SparkPlus integrates multiple layers of functionality to provide traders with actionable insights and comprehensive trade management. Here are the key features that set SparkPlus apart:
1. Unique Candlestick Patterns:
- Bullish Spark Pattern: Detects specific bullish candlestick formations over three bars, ensuring higher reliability in identifying upward trends.
- Bearish Spark Pattern: Identifies bearish formations over three bars, providing precise signals for potential downward movements.
2. Integrated Trade Management:
- The indicator not only signals potential trades but also manages them by setting entry points, stop loss, and multiple target levels.
- Dynamic Stop Loss and Target Calculation: The stop loss and target levels are dynamically calculated based on the volatility (using ATR), ensuring they adapt to market conditions.
3. Real-time Alerts:
- Provides real-time alerts for trade setups, entry points, stop loss hits, and target achievements, keeping traders informed and ready to act.
4. Detailed Trade Dashboard:
- A comprehensive dashboard is integrated into the chart to track the number of trades triggered, wins, losses, and points gained or lost for both long and short trades.
- This dashboard updates in real-time, providing an at-a-glance overview of the trading performance.
5. Visual Trade Representation:
- The script draws lines for entry, stop loss, and target levels on the chart, offering a clear visual representation of each trade.
- This feature helps traders easily track and manage active trades directly from the chart.
6. Enhanced User Control:
- Users can toggle specific features such as stop loss/target display and Spark alerts, allowing for a customizable trading experience.
By combining these elements, SparkPlus offers a robust and versatile tool for traders, enhancing their ability to make informed decisions and manage trades effectively.
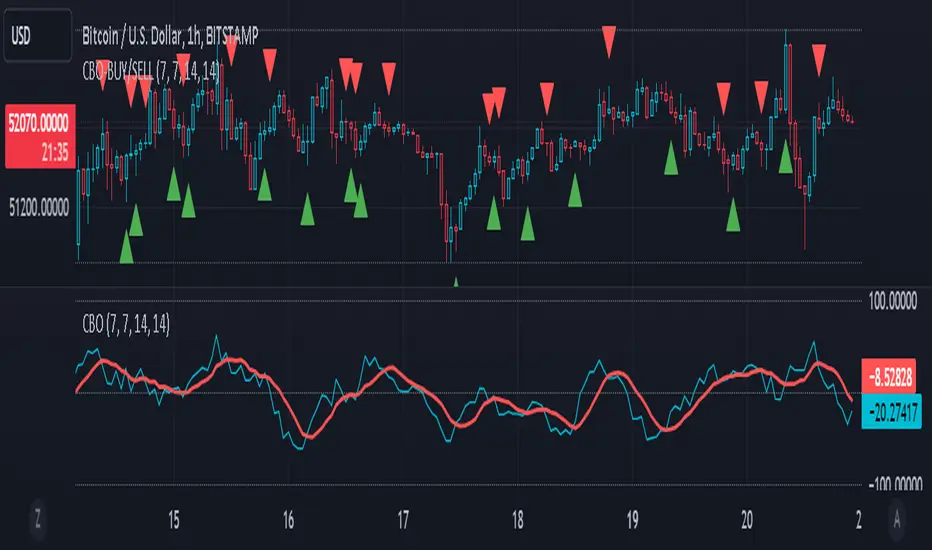
CBO (Candle Bias Oscillator)The Candle Bias Oscillator (CBO) with volume and ATR scaling is a unique technical analysis tool designed to capture market sentiment through the analysis of candlestick patterns, volume momentum, and market volatility. This indicator is built on the foundation of assessing the bias within a candlestick's body and wicks, adjusted for market volatility using the Average True Range (ATR), and further refined by comparing the Rate of Change (ROC) in volume and the adjusted bias. The culmination of these calculations results in the CBO, a smoothed oscillator that highlights potential market turning points through divergence analysis.
Key Features:
Bias Calculations: Utilizes the relationship between the candle's body and wicks to determine the market's immediate bias, offering a nuanced view beyond simple price action. Have you ever wanted to quantify exactly how bullish or bearish a particular candle or candlestick pattern is? Whether it's dojis, hammers, engulfing, gravestones, evening morning star, three soldiers etc. you don't have to memorize 50 candlestick patterns anymore.
Volatility Adjustment: Employs the ATR to adjust the bias calculation, ensuring the oscillator remains relevant across varying market conditions by accounting for volatility.
Momentum and Divergence: Measures the momentum in volume and bias through ROC calculations, identifying divergence that may signal reversals or significant price movements.
Signal Line: A smoothed version of the CBO, derived from its own values, serving as a benchmark for identifying potential crossovers and divergences.
Utility and Application:
The CBO with Divergence Scaling is developed for traders who seek a deeper understanding of market dynamics beyond price movements alone. It is particularly useful for identifying potential reversals or continuation patterns early, by highlighting divergence between market sentiment (as expressed through candlestick bias) and actual volume movements. In this way, it aligns us retail traders with institutional traders and smart money. This indicator is versatile and can be applied across various time frames and market instruments, offering value to both short-term traders and long-term investors.
How to Use:
Trend Identification: The direction and value of the CBO provide insights into the prevailing market trend. A positive oscillator value may indicate bullish sentiment, while a negative value suggests bearish sentiment.
Signal Line Crossovers: Crossovers between the CBO and its signal line can be used as potential buy or sell signals. A crossover above the signal line might indicate a buying opportunity, whereas a crossover below could suggest a selling point.
Divergence: Discrepancies between the CBO and price action (especially when confirmed by volume ROC) can highlight potential reversals.
Customization and Parameters: This script allows users to adjust several parameters, including oscillator periods, signal line periods, ATR periods, and ROC periods for divergence, to best fit their trading strategy and the characteristics of the market they are analyzing.
Conclusion:
The Custom Bias Oscillator with Divergence Scaling is a comprehensive tool designed to offer traders a multi-faceted view of market conditions, combining elements of price action, volatility, and momentum. By integrating these aspects into a single indicator, it aims to provide a more rounded and actionable insight into market trends and potential turning points.
To comply with best practices and ensure clarity regarding the informational nature of the Custom Bias Oscillator (CBO) tool, it's crucial to include a disclaimer about the non-advisory nature of the script. Here's a suitable disclaimer that you can add to the end of your script description or publication:
Disclaimer:
The Custom Bias Oscillator (CBO) with Divergence Scaling and its accompanying analysis are provided as tools for educational and informational purposes only and should not be construed as financial advice. The creator of this indicator does not guarantee any specific outcomes or profit, and all users should be aware of the risks involved in trading and investing. Users should conduct their own research and consult with a professional financial advisor before making any investment decisions. The use of this indicator is at the user's own risk, and the creator bears no responsibility for any direct or consequential loss arising from any use of this tool or the information provided herein.
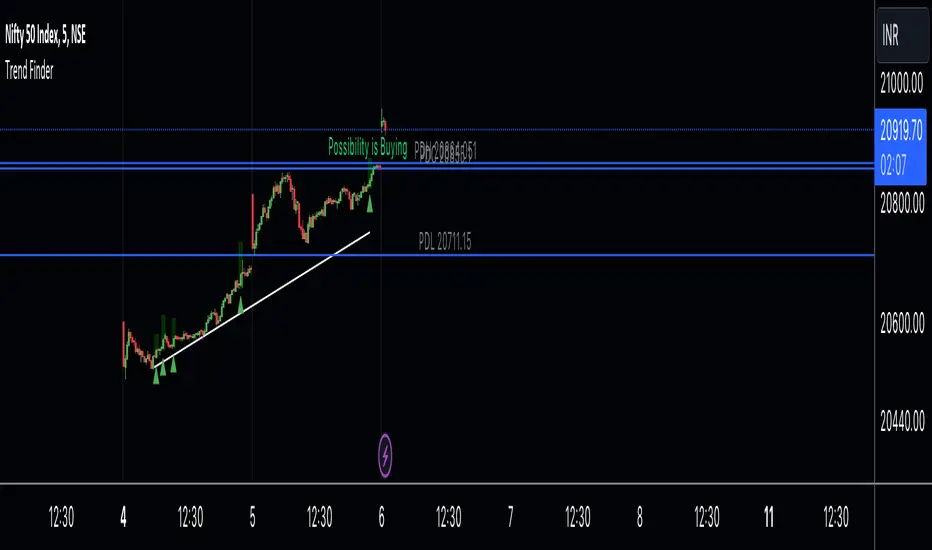
Trend Finder A Trend Finder is a specialized indicator designed to analyze market trends by combining pivot points and candlestick patterns. This hybrid approach aims to provide more accurate signals for identifying potential market directions. Here's a refined description of its features and usage:
**Overview:**
A Trend Finder indicator utilizes a combination of pivot points and candlestick patterns to offer insights into the prevailing market trend. By incorporating both elements, it seeks to enhance the accuracy of trend analysis.
**How to Use Trend Finder:**
Using the Trend Finder is straightforward and involves interpreting the signals provided by different coloured boxes:
1. **Green Box (Bull Box):**
- Indicates a potential uptrend in the market.
- Highlights possible market direction and key points.
- Offers insights into bullish market conditions.
2. **Red Box (Downtrend Box):**
- Signals a potential downtrend in the market.
- Illustrates possible downward market direction and pivotal points.
- Provides an estimate of potential market decline using pivot point calculations.
**Customization Options:**
The Trend Finder comes with customization options to tailor the analysis based on candlestick patterns. Users can adjust these settings to refine the accuracy of trend identification.
**Additional Features:**
The indicator includes extra features to enhance its functionality:
- Displays the previous day's high, low, and close values.
- Utilizes this historical data to suggest potential trend directions.
- Enables users to make informed trading decisions based on past market behaviour.
**Usage Guidelines:**
Traders can use the Trend Finder by observing the signals within the coloured boxes, considering the pivot point calculations, and factoring in candlestick patterns. The indicator's flexibility allows users to adjust settings to better align with their preferred trading strategies.
In essence, the Trend Finder serves as a comprehensive tool for traders seeking a nuanced understanding of market trends. By combining pivotal technical indicators, it aims to provide a more accurate depiction of potential market movements, assisting traders in making informed decisions.
Hikkake Hunter 2.0This script serves as a successor to a previous script I wrote for identifying Hikkakes nearly two years ago.
The old version has been preserved here:
█ OVERVIEW
This script is a rework of an old script that identified the Hikkake candlestick pattern. While this pattern is not usually considered a part of the standard candlestick patterns set, I found a lot of value when finding a solution to identifying it. A Hikkake pattern is a 3-candle pattern where a middle candle is nested in between the range of the prior candle, and a candle that follows has a higher high and a higher low (bearish setup) or a lower high and a lower low (bullish setup). What makes this pattern unique is the "confirmation" status of the pattern; within 3 candles of this pattern's appearance, there must be a candle that closes above the high (bullish setup) or below the low (bearish setup) of the second candle. Additional flexibility has been added which allows the user to specify the number of candles (up to 5) that the pattern may have to confirm after its appearance.
█ CONCEPTS
This script will cover concepts mainly focusing on candlestick analysis, price analysis (with higher timeframes), and statistical analysis. I believe there is also educational value presented with the use of user-defined-types (UDTs) in accomplishing these concepts that I hope others will find useful.
Candlestick Analysis - Identification and confirmation of the patterns in the deprecated script were clunky and inefficient. While the previous script required the use of 6 candles to perform the confirmations of patterns (restricted solely to identifying patterns that confirmed in 3 candles or less), this script only requires 3 candles to identify and process patterns by utilizing a UDT representing a 'pattern object'. An object representing a pattern will be created when it has been identified, and fields within that object will be set for processing by the functions it is passed to. Pattern objects are held by a var array (values within the array persist between bars) and will be removed from this array once they have been confirmed or non-confirmed.
This is a significant deviation from the previous script's methods, as it prevents unnecessary re-evaluations of the confirmation status of patterns (i.e. Hikkakes confirmed on the first candle will no longer need to be checked for confirmations on the second or third; a pitfall of the deprecated version which required multiple booleans tracking prior confirmation statuses). This deviation is also what provides the flexibility in changing the number of candles that can pass before a pattern is deemed non-confirmed.
As multiple patterns can be confirmed simultaneously, this script uses another UDT representing a linked-list reduction of the pattern object used to process it. This liked-list object will then be used for Price Analysis.
Price Analysis - This script employs the use of a UDT which contains all the returns of confirmed patterns. The user specifies how many candles ahead of the confirmed pattern to calculate its return, as well as where this calculation begins. There are two settings: FROM APPEARANCE and FROM CONFIRMATION (default). Price differences are calculated from the open of the candle immediately following the candle which had confirmed the pattern to the close of the candle X candles ahead (default 10). ( SEE FEATURES )
Because of how Pine functions, this calculation necessitates a lookback on prior candles to identify when a pattern had been confirmed. This is accomplished with the following pseudo-code:
if not na(confirmed linked-list )
for all confirmed in list
GET MATRIX PLACEMENT
offset = FROM CONFIRMATION ? 0 : # of candles to confirm
openAtFind = open
percent return = ((close - openAtFind) / openAtFind) * 100
ADD percent return TO UDT IN MATRIX
All return UDTs are held in a matrix which breaks up these patterns into specific groups covered in the next section.
Higher Timeframes - This script makes a request.security call to a higher timeframe in order to identify a price range which breaks up these patterns into groups based on the 'partition' they had appeared in. The default values for this partitioning will break up the chart into three sections: upper, middle, and lower. The upper section represents the highest 20% of the yearly trading range that an asset has experienced. The lower section represents the trading range within a third (33%) of the yearly low. And the middle section represents the yearly high-low range between these two partitions.
The matrix containing all return UDTs will have these returns split up based on the number of candles required to confirm the pattern as well as the partition the pattern had appeared in. The underlying rationale is that patterns may perform better or worse at different parts of an asset's trading range.
Statistical Analysis - Once a pattern has been confirmed, the matrix containing all return UDTs will be queried to check if a 'returnArray' object has been created for that specific pattern. If not, one will be initialized and a confirmed linked-list object will be created that contains information pertinent to the matrix position of this object.
This matrix contains the returns of both the Bullish and Bearish Hikkake patterns, separated by the number of candles needed to confirm them, and by the partitions they had appeared in. For the standard 3 candles to confirm, this means the matrix will contain 18 elements (dependent on the number of candles allowed for confirmations; its size will range from 12 to 30).
When the required number of candles for Price Analysis passes, a percent return is calculated and added to the returnArray contained in the matrix at the location derived from the confirmed linked-list object's values. The return is added, and all values in the returnArray are updated using Pine's built in array.___ functions. This returnArray object contains the array of all returns, its size, its average, the median, the standard deviation of returns, and a separate 3-integer array which holds values that correspond to the types of returns experienced by this pattern (negative, neutral, and positive)*.
After a pattern has been confirmed, this script will place the partition and all of the aforementioned stats values (plus a 95% confidence interval of expected returns) related to that pattern onto the tooltip of the label that identifies it. This allows users to scroll over the label of a confirmed pattern to gauge its prior performance under specific conditions. The percent return of the specific pattern identified will later be placed onto the label tooltip as well. ( SEE LIMITATIONS )
The stats portion of this script also plays a significant role in how patterns are presented when using the Adaptive Coloring mode described in FEATURES .
*These values are incremented based on user-input related to what constitutes a 'negative' or 'positive' return. Default values would place any return by a pattern between -3% and 3% in the 'neutral' category, and values exceeding either end will be placed in the 'negative' or 'positive' categories.
█ FEATURES
This script contains numerous inputs for modifying its behavior and how patterns are presented/processed, separated into 5 groups.
Confirmation Setting - The most important input for this script's functioning. This input is a 'confirm=true' input and must be set by the user before the script is applied to the chart. It sets the number of candles that a pattern has to confirm once it has been identified.
Alert Settings - This group of booleans sets which types of alerts will fire during the scripts execution on the chart. If enabled, the four alerts will trigger when: a pattern has been identified, a pattern has been confirmed, a pattern has been non-confirmed, and show the return for that confirmed pattern in an alert. Because this script uses the 'alert' function and not 'alertcondition', these must be enabled before 'any alert() function call' is set in TradingView's 'alerts' settings.
Partition Settings - This group of inputs are responsible for creating (and viewing) the partitions that breaks the returns of the patterns identified up into their respective groups. The user may set the resolution to grab the range from, the length back of this resolution the partitions get their values from, the thresholds which breaks the partitions up into their groups, and modify the visibility (if they're shown, the colors, opacity) of these partitions.
Stats Settings - These inputs will drastically alter how patterns are presented and the resulting information derived from them after their appearance. Because of this section's importance, some of these inputs will be described in more detail.
P/L Sample Length - Defines the number of candles after the starting point to grab values from in the % return calculation for that pattern.
P/L Starting Point - Defines the starting point where the P/L calculation will take place. 'FROM APPEARANCE' will set the starting point at the candle immediately following the pattern's appearance. 'FROM CONFIRMATION' will place the starting point immediately following the candle which had confirmed the pattern. ( SEE LIMITATIONS )
Min Returns Needed - Sets how many times a specific pattern must appear (both by number of candles needed to confirm and by partition) before the statistics for that pattern are displayed onto the tooltip (and for gradient coloration in Adaptive Coloring mode).
Enable Adaptive Coloring - Changes the coloration of the patterns based on the bullish/bearishness of the specified Gradient Reference value of that pattern compared to the Return Tolerance values OR the minimum and maximum values of that specified Gradient Reference value contained in the matrix of all returns. This creates a color from a gradient using the user-specified colors and alters how many of the patterns may appear if prior performance is taken into account.
Gradient Reference - Defines which stats measure of returns will be used in the gradient color generation. The two settings are 'AVG' and 'MEDIAN'.
Hard Limit - This boolean sets whether the Return Tolerance values will not be replaced by values that exceed them from the matrix of returns in color gradient generation. This changes the scale of the gradient where any Gradient Reference values of patterns that exceed these tolerances will be colored the full bullish or bearish gradient colors, and anything in between them will be given a color from the gradient.
Visibility Settings - This last section includes all settings associated with the overall visibility of patterns found with this script. This includes the position of the labels and their colors (+ pattern colors without Adaptive Coloring being enabled), and showing patterns that were non-confirmed.
Most of these inputs in the script have these kinds of descriptions to what they do provided by their tooltips.
█ HOW TO USE
I attempted to make this script much easier to use in terms of analyzing the patterns and displaying the information to the user. The previous script would have the user go to the 'data window' side bar on TradingView to view the returns of a pattern after they had specified which pattern to analyze through the settings, needlessly convoluted. This aim at simplicity was achieved through the use of UDTs and specific code-design.
To use, simply apply the indicator to a chart, set the number of candles (between 2 and 5) for confirming this specific pattern and adjust the many settings described above at your leisure.
█ LIMITATIONS
Disclaimer - This is a tool created with the hopes of helping identify a specific pattern and provide an informative view about the performance of that pattern. Previous performance is not indicative of future results. None of this constitutes any form of financial advice, *use at your own risk*.
Statistical Analysis - This script assumes that all patterns will yield a NORMAL DISTRIBUTION regarding their returns which may not be reflective of reality. I personally have limited experience within the field of statistics apart from a few high school/college courses and make no guarantees that the calculation of the 95% confidence interval is correct. Please review the source code to verify for yourself that this interval calculation is correct (Function Name: f_DisplayStatsOnLabel).
P/L Starting Point - Because of when the object related to the confirmation status of a pattern is created (specifically the linked-list object) setting the 'P/L Starting Point' to 'FROM APPEARANCE' will yield the results of that P/L calculation at the same time as 'FROM CONFIRMATION'.
█ EXAMPLES
Default Settings:
Partition Background (default):
Partition Background (Resolution D : Length 30):
Adaptive Coloration:
Show Non-Confirmed:

PinBar Detector [Mr_Zed]Pinbar Detector is a technical analysis tool designed to detect Pinbar patterns in financial markets. Pinbars are reversal patterns that indicate a potential change in trend.
This indicator is based on an existing Pinbar detector in MQ4/5 format, originally developed by "earnforex".
The PineScript version is written to work in TradingView, and can be applied to any chart to identify Pinbar formations. The indicator uses specific criteria to identify Pinbars, such as the length of the wick and the relationship between the wick and the body of the candlestick. By displaying the Pinbars on the chart, traders can make informed decisions about entering or exiting trades based on their analysis of the market's potential trend reversal.
enjoy !

MTFT Actionable Signal Targets, TheStrat Suite (4of5)Multi Time Frame Tools
Multi Time Frame Tools (MTFT) is a suite of scripts aimed to establish a standard timeframe-based color scheme. This can be utilized to overlay different timeframes calculations/values over a single timeframe. As one example, this would allow to observe the 5-month moving average, 5-week moving average, and 5-day moving average overlaid over each other. This would allow to study a chart, get accustomed to the color scheme and study all these at the same time much easier.
All indicators calculated using the below specific timeframes as input, will always use the color scheme outlined below. This is to get you in habit of recognizing the different timeframes overlaid in top of each other. These can be personalized.
Longer TF analysis.
Yearly - Black
Semi-Annual - Yellow
Quarterly - White
Monthly - Maroon
Weekly - Royal Blue
Daily - Lime
Shorter TF analysis.
4 hour - Fuchsia
1 hour - Orange
30 min - Red
15 min - Brown
10 min - Purple
5 min - Lilac
All color coordination is able to be modified in either the “Inputs” or “Style” section. If you need to make changes, make sure to select “Save as Default” on the bottom right of the settings menu.
Recommended Chart Color Layout
I played around with color coordination a lot. The final product was what worked best for me. I personally use the following chart settings to accent all available TF colors.
-> Click on the settings wheel on your chart. -> Click on “Appearance”.
Background - Solid -> On the top row pick the 6th color from the left.
Vert Grid Lines and Horz Grid Lines -> On the top row pick the 7th color from the left.
You may of course change these and the indicator line colors as you like.
Adding indicator to Chart
-> Open the TradingView “Indicators & Strategies” library, the icon has “ƒx”. -> All premium scripts will be located under “Invite-Only Scripts” -> Click indicator to add to your chart.
MTFT TheStrat Suite (5 Scripts)
Rob Smith is the creator of ‘TheStrat’ trading strategy. For ‘TheStrat’ I have put together a suite of 5 premium scripts that combined will offer people interested in learning ‘TheStrat’ a cleaner learning process. For 2 of the 5 scripts specifically, the MTFT approach of overlaying multiple longer timeframes(TF) over a shorter TF selected as a display cannot be utilized. The other 2 scripts will have full MTFT functionality and they are my personal favorite. I will be providing very basic info to utilize this script; it is up to you to dive deep into learning this strategy. I am not an expert with the tool or a financial advisor. As with all aspects of life, I recommend you research, learn, discern and practice extensively in order to become a master.
1. MTFT Patterns Pro/Noob
2. MTFT Full Time Frame Continuity Table
3. MTFT Last HML wOpen
*4. MTFT Actionable Signal Targets
5. MTFT Reversal Lines
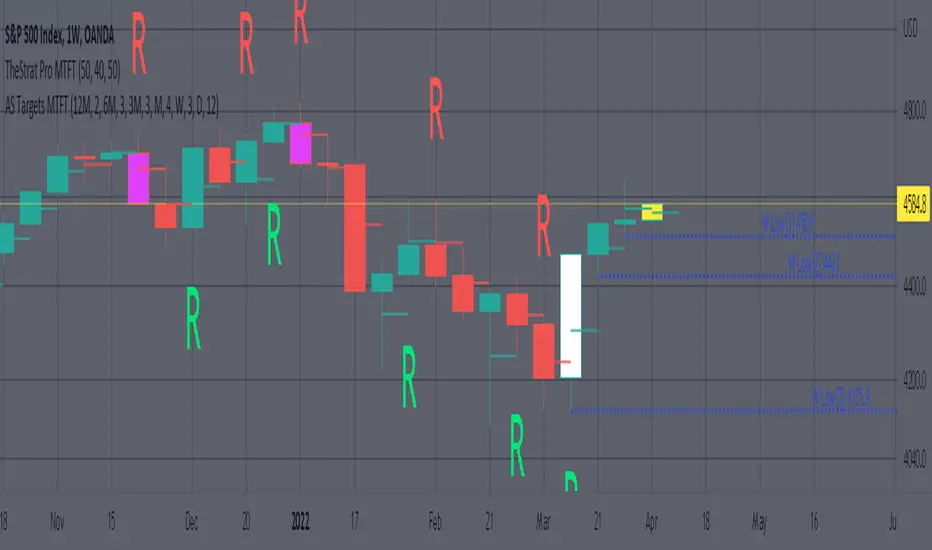
MTFT Actionable Signal Targets, TheStrat Suite (4of5)
Plots the previous highs/lows for the selected timeframe. Will not plot the high/low for a candlestick that is still active/open. You will have to manually Enable/Disable the high/low depending on the type of actionable signal that you are observing. Previous high/low lines will start from the near exact time that it opened so you can see exactly from what previous candlestick you are tracking each target.
Features includes:
1. Six Different Timeframes per script instance. Example below shows a weekly timeframe selected with a Shooting Star as the actionable signal that is being considered along with the past 3 lows for the Week timeframe being enabled. These would be your targets if you were to enter this SHORT trade. Keep in mind that every new week that opens the script will update to the newest 3 lows so if you are still inside a trade you might have to increase the number of past lines in order to keep an eye on the original targets. Which is why I selected 3 in this example, even if there is only 2 targets in mind.
The script will allow you to observe how price moves after an actionable signal is triggered and as it approaches the targets on smaller timeframes. Here is the setup from above on a daily timeframe selected showing how priced moved to the targets. This is all based on Robs teachings, but broken down to better grasp how price moves between pivots.
2. 20 different TF to pick from per slot. Timeframes(TF) include: Yearly(Y), Semi-annually(S), Quarterly(Q), Monthly(M), 2-Week(2W), Weekly(W), 3-Day(3D), Daily(D), 12 hour, 8 hour, 6 hour, 4 hour, 3 hour, 2 hour, 1 hour, 30 min, 15 min, 10 min, 5 min. NOTICE: 2W, 3D, 2D, 12h, 8h, 6h, 3h, and 2h don’t have a supported color scheme as I do not personally use them. They are available to pick from in the timeframe selection and you can set a color for these timeframes under the “Unsupported Color Scheme” section in the settings menu for the script if you would like to use them.
3. Show exact price at the pivots. Since drawing lines vs plots doesn’t show the value in the price bar on the right side this setting will show the value of the targets. Image below shows an example of how this looks.
4. Auto-hide timeframes based on specific timeframes selected. For this script, I look for timeframes smaller than the selected timeframe and auto hide these. This applies to all timeframes. For example, in the above Weekly Shooting Star example. If I were to select the monthly timeframe it would hide this timeframe selected so would not show the weekly targets. In the higher timeframes these targets are irrelevant.
IMPORTANT NOTE: One of the lessons I would consider most important in attaining clarity regarding trading, is “TheStrat” by Rob Smith. His lesson on “actionable signals” is something that can be applied to any strategy. For this reason, I am including “MTFT TheStrat Patterns Pro” script in all images that will depict confluence for a better trade selection.
Example using TheStrat Pro MTFT with this indicator.
Look for a “TheStrat actionable signal” or a “TheStrat Reversal signal” on a smaller timeframe that has an instance of this indicator on a larger timeframe calculation that is in range of the candlestick that formed your actionable signal. This means that the indicators plot you are observing must be above the low and below the high of the candlestick that is the actionable signal/reversal signal. Image below shows what this would look like with this indicator.
The Image below shows what this would look like with this indicator. The selected timeframe is the Weekly, it shows an ‘S’ char above which is an indication of a Shooting Star Actionable signal and the low from 4 months ago in range showing some potential resistance. This actionable signal is meant to be played for SHORTS. If the low is breached than you would enter a short. For targets you would look at the previous pivots, for this example all targets were hit. This wont always play out so nice and clean, but given that there is so many stocks and so many signals this is just a thought to improve the quality of the signal as it has extra confluence.
Trade Central 2-Bars ScalperTrade Central 2-Bar Scalper is a scalping signal indicator based on short term price action using candlesticks. If 2 consecutive green candles form which are less than the max bar length defined in settings then indicator gives a buy signal. Similarly, if 2 consecutive red candles form then it gives a sell signal. It sounds very simple but it is a very powerful and popular scalping method. Along with the signal, you should pay attention to the candle formations, e.g. if there is a buy signal but you see a significant wick on top of signal candles then you may want to avoid that signal. Same for short.
Indicator shows bars in 3 colors - Green, Red and White. Signal candles, i.e. long and short, are green and red respectively. Rest of the candles are white and no action is needed when candles are white.
Trading using the script is simple - you enter a long trade on a green bar and enter a short trade on red bar. Detailed rules for trade execution are mentioned below.
Trading Rules
Recommended Timeframe: 3 minute
Go LONG after a green bar when signal candle high is broken. For example, on BTC chart if signal candle (green) high is 50000 then enter at least 3-5 points above it, i.e. 50003. If the signal candle high isn't broken then wait for that to happen, but signal/trade gets invalidated if the signal candle low is broken before signal candle high is broken .
Go SHORT after a red bar when signal candle low is broken. For example, on BTC chart if signal candle (red) low is 50000 then enter at least 3-5 points below it, i.e. 49997. If the signal candle low isn't broken then wait for that to happen, but signal/trade gets invalidated if the signal candle high is broken before signal candle low is broken .
For SL, we will use fixed profit and SL targets. For BTC, we recommend setting 100 points SL and 50 points target. That's a risk-to-reward of 1:0.5 which may look very bad, but the success rate of this strategy is very high (>70%) hence you would still be profitable. You can also try with 1:1 risk-to-reward ratio and that too should work fine though we haven't backtested it.
Default settings work best on 3 minute timeframe and has been tested on BTC. If you're applying the indicator on something else then ensure that you update the length as per security price you plan to trade. Will share backtested data and detailed explanation over a YouTube video.
Will strongly recommend paper trading in desired market/asset before executing live trades.

Bull and Bear Marubozus Candlestick PatternMarubozus are an interesting candle pattern wherein the close and open of the candle are also the high / low points of the candle. In other words, a candle with no shadows or wicks.
How reliable are they, though? Probably not very reliable on their own. It may also depend on the size of the candle. You would probably want to incorporate this candle pattern with other filters, like RSI, MACD, to filter trade opportunities.

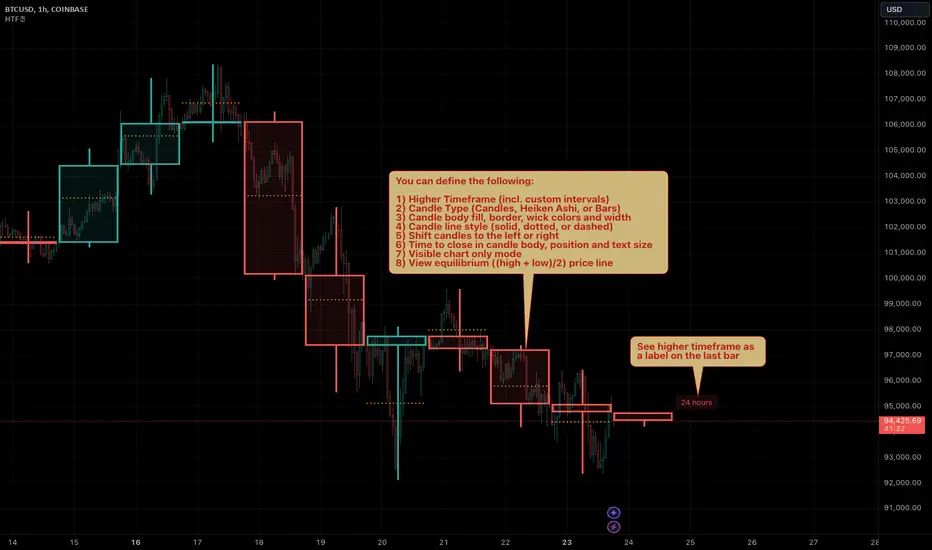
HTF Candles by Prosum SolutionsOverview of Features
This indicator was inspired by the work of "informanerd" in the script called "HTF Candles" as well as the built-in script called "Multi-Time Period Charts" by TradingView. The script will provide a highly customizable interface to specify the higher timeframe resolution for the candlesticks, the type of candle, as well as various styling options for the body, borders and wicks.
Usage Information
The indicator can be applied to any chart at any time frame, but resolutions less than 1 minute may demonstrate gaps between bars and the candles may not render properly.
When the "Same as chart" option is chosen for the "Resolution" field, the indicator will attempt to find a higher timeframe resolution to ensure the candlesticks are drawn.
Enjoy! 👍
Trend ResumptionWe again keep it really simple.
This indicator just plots the combination of RGRR and GRGG candlesticks. (R = Red / Bearish, G = Green / Bullish)
When either pattern occurs, trade the combined high and combined low of recent 2 RR or recent 2 GG candles. I.e.,
Buy above GG's high with SL at GG's low.
Sell below RR's low with SL at RR's high.
Refer the shared chart for example. The signals were plotted on both the sides, and wherever triggered - gave rewards.
Only 1 at 05-Apr, 10:50 a.m. did not trigger, but that must then be ignored. Do not hurry to enter the trade, wait for breakout / breakdown above combined high / low.

Inside Bar FailureThis indicator provides a statistical report on the Inside Bar Failure candlestick pattern popularized by Trader Dante. Based on the chart's bars, it can improve your edge on any markets and timeframes.
The Inside Bar Failure pattern refers to an Inside Bar breakout that failed to sustain momemtum and closed back within it.
The report is broken down into the different following sections: retracement , invalidation , continuation and breakout .
Each of them provides hindsights about the pattern price behavior and brings answers to questions such as: How often does price retrace? Does the pattern often invalidate? If it doesn't then does it break in the pattern's direction? How far does price go? What are the odds of a false breakout?
While there are many ways to make use of the metrics, my favorite use case is for developing directional and daily/weekly biases while refining my stop/entry/target positioning.
Miscellaneous
Highlights patterns on the chart;
Supports bar to bar analysis and replay functionalities;
Provides counts on the `Data Window` panel for debugging or computing your own metrics;
Settings
Show/hide for toggling different sections;
Report coloring and offset on the x axis;
Gaining Access
This is a private indicator and is available only for my Patrons. You can reach my Patreon page below from the link in my signature.

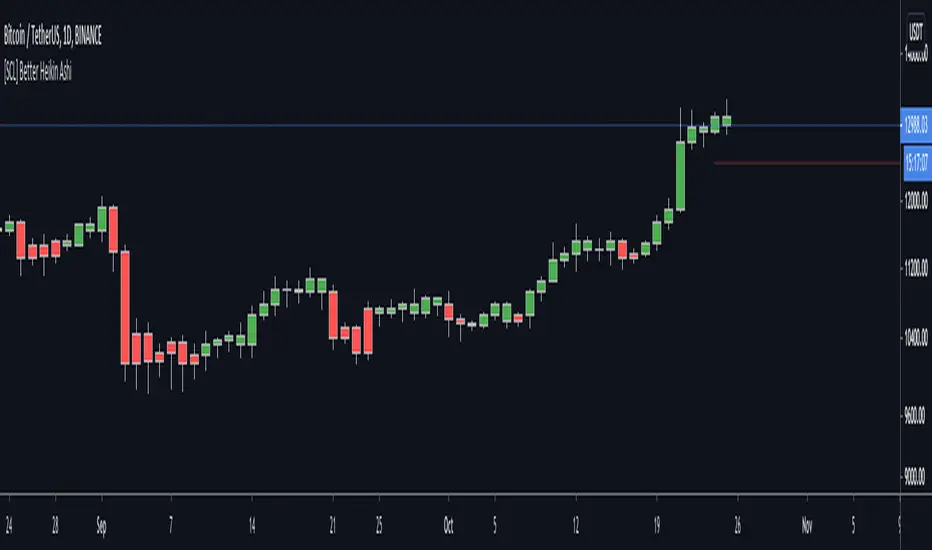
[SCL] Better Heikin AshiTo display the Heikin Ashi candle direction on your normal chart, using this script is better than switching between layouts. It includes different display modes so that you can use it alongside other indicators without clashing visually (bar colour/plotted shapes/shapes on flip only), and alerts on changes in direction. Many scripts include some or other of these features; here I've included them all in one for flexibility. One feature that AFAIK is unique is the "predictive close", which shows you where the current candle needs to close in order to change the Heikin Ashi direction.
Heikin Ashi is a different method of calculating candlesticks. It has several advantages:
+ It can help to show the dominant trend in a smoother way than normal candles.
+ Flips in direction can show either trend reversal, or a pause and continuation, which can be a place to join a trend.
Disadvantages of using Heikin Ashi include:
+ Having to change to a different chart layout
+ Difficulties working directly with Heikin Ashi values, because the values of the Open, Low, High, and Close displayed are different to the "real" prices.
This indicator solves this problem by bringing trend information from Heikin Ashi candles (whether they're bullish or bearish) onto your normal candle chart. It displays in the main chart pane.
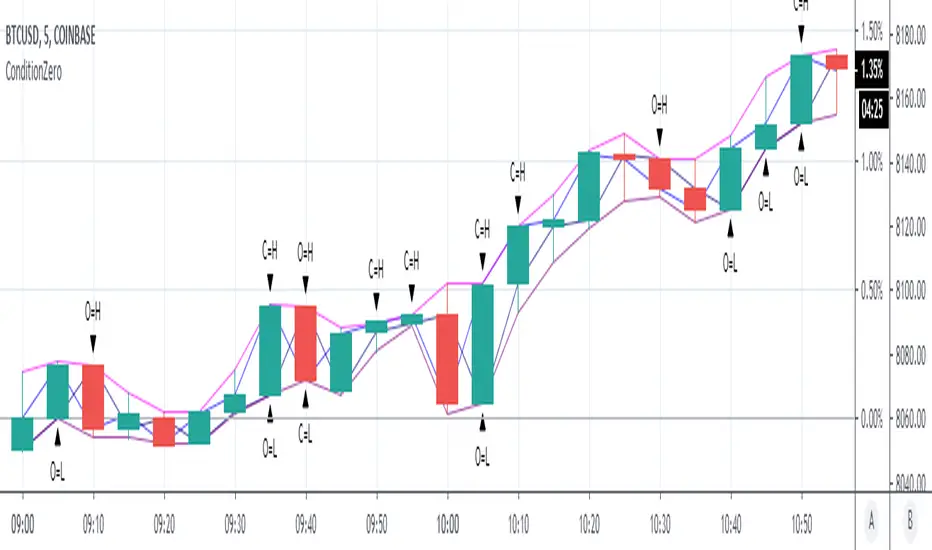
ConditionZeroThis study is a proof of concept analysis of situations that can lead to divide with zero or divide by zero conditions. Such situations can lead to mathematical errors, and can increase the potential for false alerts.
One common formula that is prone to this situation is:
pct=(high-close)/(high-low)
This is used to calculate percentage change of a candlestick.
Common outcomes are 0/0, 0/x, x/0, where x is a non zero value.
Visualizing this situation allows for more robust script development and deployment.
There are no user configurations.
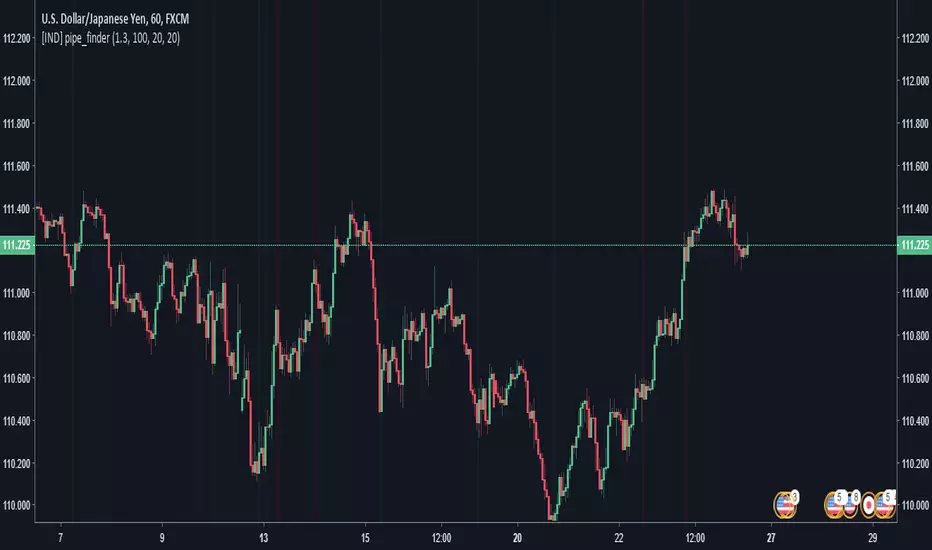
pipe_finder. Reversal Indicator for Pipe Top & Bottom Patterns.Simple indicator to find pipe bottom and top patterns.
Definition:
- Pipe Bottom:
- Positive Difference from Open and Close is greater than the average thickness of the last "x" candles multiplied by sensitivity "y"
- The previous candle is red and the current candle is green
- Trend Definition - (Trend for EMA length 'z" has a slope less than 0 or pointed downwards)
- The average of the current and previous candle's volume is greater than the average volume for the last "n" candles.
- Pipe Top:
- Positive Difference from Open and Close is greater than the average thickness of the last "x" candles multiplied by sensitivity "y"
- The previous candle is green and the current candle is red
- Trend Definition - (Trend for EMA length 'z" has a slope greater than 0 or pointed upwards)
- The average of the current and previous candle's volume is greater than the average volume for the last "n" candles.
Settings:
Sensitivity: How thick do the pipe candles have to be? (Greater sensitivity = more alerts)
Candle Thickness Average Period: The number of past candles used for measuring the average body size of candlestick.
Filter EMA Length: Length of the EMA used to filter between bull trends and bear trends.
Volume EMA Length: Length of the volume EMA.
Opening Power Bar Strategy (Trade Your Edge)💎 GENERAL OVERVIEW:
The Opening Power Bar Strategy indicator identifies high-momentum “Power Bars” during the first 60 minutes of the New York session and generates Long/Short signals using levels from the pre-market session. The indicator plots Stop-Loss and three Take-Profit levels, manages dynamic trailing stop-loss logic (optional), displays pre-market levels, and supports alerts.
This indicator was developed by Flux Charts in collaboration with Steven Adams (Trade Your Edge).
🔹What is the purpose of the Opening Power Bar Strategy?:
The purpose of the Opening Power Bar Strategy is to trade the most active and meaningful part of the trading day, the opening move. It’s designed to take advantage of the volume and volatility that happens right after the market opens, when traders react to overnight news and pre-market movement. The indicator helps identify when that early move has real strength by looking for a large, decisive candle (a Power Bar) forming around key pre-market levels. Once it detects one, it builds a full trade plan automatically with entry, stop-loss, and take-profits.
🔹Why are signals only during the first 60 minutes?:
Most of the day’s total trading volume happens within the first 60 minutes after the market opens. This period usually sets the high or low of the day and defines the bias: whether the market will trend or stay in a range. After this first hour, volume and volatility typically decrease, and price movement becomes less consistent.
🔹What’s the theory behind the Opening Power Bar Strategy?:
The Opening Power Bar Strategy is built on a simple principle: the first hour after the market open sets the tone for the rest of the day. This period consistently shows the highest trading volume, as traders react to overnight news, economic data releases, pre-market movements, etc.
These early reactions often establish the day’s high/low, revealing where buyers or sellers are strongest. When a large, decisive candle (a Power Bar) forms during this time near the pre-market high or low, it confirms that one side is taking control. The pre-market high and low define the range that institutions and short-term traders had already reacted to before the market open. Thus, when a Power Bar forms near one of these levels during the first hour, it often marks the start of a breakout or rejection that shapes the rest of the session.
🎯 OPENING POWER BAR STRATEGY FEATURES:
The Opening Power Bar Strategy indicator includes 5 main features:
Power Bars
Pre-Market High / Low / Mid Levels
Long / Short Signals + Risk Management
Simple Moving Average (SMA)
Alerts
1️⃣ Power Bars:
🔹What are Power Bars?:
Power Bars are large, high-momentum candles that show strength in one direction of the market. They form when a candle’s body (the distance between open and close) dominates most of the candle’s total range (the distance between high and low), meaning price moved strongly in one direction with little to no pullback. To qualify, the candle must also be large relative to nearby candles. This size difference confirms that the candle is a true burst of momentum. In short, Power Bars reveal where real strength has just entered the market and where momentum is most likely to continue.
🔹How to interpret and use Power Bars:
When a Power Bar forms, it signals that price just made a strong directional move with little to no pullback. Traders can use these bars to identify momentum shifts and potential trade setups during the opening session.
A bullish Power Bar means buyers controlled the entire candle, often marking the start of upward momentum. A bearish Power Bar means sellers were in control the entire candle, often signaling the start of downwards momentum. In the Opening Power Bar Strategy, these candles are only used for signals when they appear within the pre-market high and low range. Their location relative to the pre-market midline determines direction bias:
Bullish Power Bars forming near the pre-market low can signal potential long opportunities.
Bearish Power Bars forming near the pre-market high can signal potential short opportunities.
🔹How are Power Bars identified?:
Power Bars are detected and confirmed only after the candle closes, ensuring that the full candlestick body and range can be measured. The indicator does not repaint or change past bars. Once a Power Bar is confirmed, it stays fixed on the chart. Power Bars can be detected on any timeframe or symbol that produces standard candlestick data. However, since the Opening Power Bar Strategy focuses on the first 60 minutes of the trading session, they’re most meaningful on lower intraday timeframes such as 1-minute to 5-minute charts.
The indicator identifies Power Bars using two user-defined inputs: Sensitivity and Body %.
🔹Sensitivity:
The Sensitivity setting determines how large a candle’s body must be relative to nearby candles. It uses the Average True Range (ATR) to compare the current candle’s size with recent candles, and the Sensitivity value acts as a multiplier of that ATR. A higher Sensitivity value means the candle must be much larger than recent candles to qualify, so fewer Power Bars will form. A lower value makes the filter less strict, allowing more candles to qualify.
🔹Body %:
The Body % setting controls what percentage of the candle’s total range must be body rather than Wick. A higher value requires the body to take up more of the candle’s total range, so fewer candles pass the filter. A lower value allows candles with more wick to qualify, so more Power Bars will form.
Body % Example:
If Body % is set to 50, the candle body must cover at least half of the candle’s total range. For example, if a candle’s high is $11, its low is $10, its open is $10.20, and its close is $10.80, then the total range is $1 ($11 - $10) and the body is $0.60 ($10.80 - $10.20). Body % = (Body / Total Range) * 100 = (0.60 ÷ 1.00 × 100) = 60%. Since 60% is greater than the input of 50%, this candle passes the Body % criteria.
Once a candlestick closes and it meets both the Sensitivity and Body % requirements, it will be plotted in a different color, using barcolor() function. Users can adjust the bullish/bearish colors of Power Bars by adjusting the ‘Candle Coloring’ setting. The Power Bar candle coloring is purely visual and does not affect signal logic or strategy calculations.
🔹Do Power Bars form outside the first 60 minutes?:
Power Bars can technically form at any time of day, but the Opening Power Bar Strategy only uses those formed between 9:30 AM and 10:30 AM ET for trade signals.
2️⃣ Pre-Market Levels
The indicator tracks pre-market price action from 4:10 AM EST until 9:29 AM EST to determine the session’s High and Low. When pre-market ends, both levels are drawn and continuously projected to the right throughout the regular session. A midline is calculated as the midpoint between those levels and is used to determine bullish or bearish bias at the open. This midline is calculated in the indicator’s background and not visually plotted.
Long signals require price to be positioned below the midline before breaking upward, and Short signals require price to be positioned above the midline before breaking downward.
Users can enable retest labels, which appear if price touches the pre-market low, and closes above it, or if price touches the pre-market high, and closes below it. Users can also enable/disable the pre-market levels. If disabled, the pre-market high and pre-market low levels will not be displayed.
3️⃣Long/Short Signals:
Long and Short signals only trigger during the first hour of the New York trading session, between 9:30 AM and 10:30 AM EST. These signals form between the Pre-Market Low (PML) and Pre-Market High (PMH).
▫️ A Long entry requires:
1) A bullish power bar forms
1.a) The candle’s low is < the 50% area or Midpoint of the PML/PMH range
1.b) The candle closes above the PML, but below the PMH
2) If this candle occurs between 09:30 AM and 10:30 AM, a long signal will appear.
▫️ A Short Entry requires:
1) A bearish power bar forms
1a) The candle’s high is > the 50% area or Midpoint of the PML/PMH range
1b) The candle closes below the PMH, but above the PML
2) If this candle occurs between 09:30 AM and 10:30 AM, a short signal will appear.
Only one trade can be active at a time. Users can enable or disable Long Signals and Short Signals independently. Entry markers appear directly on the chart at confirmation.
When a signal is plotted on the Power Bar’s candle close, the indicator automatically builds a rule-based trade structure and plots the following information:
Stop-Loss (SL)
Take-Profit 1 (TP 1)
Take-Profit 2 (TP 2)
Take-Profit 3 (TP 3)
For Long signals, the SL is placed at the low of the bullish Power Bar and TP 1 is placed at the PMH. The distances for TP 2 and TP 3 are then measured using the move from the entry price to TP 1. That same distance is added once above TP 1 to set TP 2, and added again above TP 2 to set TP 3.
For Short signals, the SL is placed at the high of the bearish Power Bar, and TP 1 is placed at the PML. The distances for TP 2 and TP 3 are then measured using the absolute value of the move from the entry price to TP 1. That same distance is subtracted once below TP 1 to set TP 2, and subtracted again below TP 2 to set TP 3.
🔹Trailing Stop-Loss Feature:
When the Trailing Stop-Loss setting is enabled, the Stop-Loss (SL) automatically adjusts as price reaches take-profit levels. This feature helps secure profits while keeping the trade logic completely rule-based and non-discretionary.
Here’s exactly how it works step-by-step:
▫️ Initial Stop-Loss placement:
For a Long trade, the initial SL is set at the low of the Power Bar that triggered the entry.
For a Short trade, the initial SL is set at the high of the Power Bar that triggered the entry.
This level stays fixed until one of the Take-Profit targets is reached.
▫️ After TP 1 is hit:
The SL automatically moves to the entry price (breakeven).
This eliminates all downside risk on the trade.
▫️ After TP2 is hit:
The SL automatically moves to TP 1
This locks in a partial profit while allowing the trade to continue toward TP 3.
▫️ Final exit condition:
The trade is considered complete once either the trailing Stop-Loss or TP 3 is reached.
4️⃣Simple Moving Average (SMA)
In addition to the core trade logic, the indicator includes an optional Simple Moving Average (SMA) that provides extra confirmation and context for interpreting Power Bar signals. The SMA is not related to any of the signal generation logic. It does not influence when or where Power Bars or trade signals appear. Instead, it serves as a contextual confirmation tool and should be used as an additional way to interpret the strength and quality of a setup once a signal is triggered.
There are a few ways the SMA can be used for extra context with the Opening Power Bar Strategy:
▫️ #1 Directional Confirmation:
The SMA is mainly used as a confirmation tool for countertrend Power Bar setups. It helps traders identify when a strong reversal may be developing against the prior trend.
When the SMA is sloping downward but a bullish Power Bar closes above it, that can signal a potential shift from bearish to bullish momentum.
When the SMA is sloping upward but a bearish Power Bar closes below it, that can indicate a possible transition from bullish to bearish conditions.
▫️ #2 Timing Entries
When a large Power Bar prints a signal far away from the SMA, it often indicates that price has moved quickly and temporarily extended away from its average level. In these cases, the SMA can be used as a pullback area where price may retrace before resuming its move. Waiting for this pullback can often lead to a better risk-to-reward trade setup.
For example, in the chart below, a strong bullish Power Bar formed and triggered a Long signal while closing well above the SMA. Entering immediately after the signal would have produced a 0.22 risk-to-reward to TP 1. However, waiting for price to retrace back toward the SMA before entering would have resulted in a much stronger 2.46 risk-to-reward ratio.
The SMA provides a simple way to identify areas for safer pullback entries when a Power Bar signal forms too far from its average level. This helps traders maintain consistency with their risk-to-reward targets and align entries with their trading plan.
▫️ #3 Risk/Trade Management:
During active trades, the SMA can also be used to gauge the healthiness of a trend.
If price continues to respect the SMA after entry, it supports holding the position toward later Take-Profit levels. Additionally, the SMA can highlight areas where traders may consider adding to existing positions if price respects it.
If price closes strongly back through the SMA in the opposite direction, traders may use that as an early exit or a signal that momentum has shifted.
▫️ Optional and Visual Only:
The SMA is an optional visual overlay that can be turned on or off in the indicator’s settings. It is purely there for traders who want an added layer of confirmation and structure when evaluating setups from the Opening Power Bar Strategy.
Users can customize the length of the SMA and the color within the settings.
📢 Alerts:
The indicator supports alerts, so you never miss a key market move. You can choose to receive alerts for each of the following conditions:
Long Signal
Short Signal
TP 1 (Take-Profit 1)
TP 2 (Take-Profit 2)
TP 3 (Take-Profit 3)
SL (Stop-Loss)
Pre-Market Low Retest
Pre-Market High Retest
🚩UNIQUENESS:
This indicator automates a structured opening-range strategy that traders typically manage manually each morning. It identifies valid Power Bars only when they occur inside the pre-market high/low range, confirms direction using pre-market midline context, and automatically builds risk targets using the pre-market range itself. Once a valid trigger occurs during the defined trade window, the indicator immediately generates a complete trade idea (entry/SL/TP 1-3) with built-in trailing logic and alerts.

Market NavigatorIntroducing Market Navigator: The Ultimate Trading Indicator for Forex and Gold Markets
In today’s fast-paced trading world, having all-in-one tools that provide clarity and actionable insights is more critical than ever. The FINAL EMA 05 indicator is a comprehensive TradingView tool designed to help traders spot trends, key levels, and market reversals—all on a single chart.
This indicator combines 8 EMAs, Delta Zones, Swing Highs/Lows, Candle Patterns, and Liquidity Channels—making it perfect for Forex, Gold (XAUUSD), and other major markets.
1. Multi-Timeframe EMAs for Trend Clarity
The indicator includes 8 EMAs:
EMA 7 & 9 – Short-term trend detection
EMA 10 & 20 – Short-to-mid-term trend confirmation
EMA 50 & 89 – Mid-to-long-term trend
EMA 100 & 200 – Long-term trend and strong support/resistance levels
Each EMA can be customized with a different length, color, width, and timeframe, making it easy to visualize both local and major market trends.
✅ Why it matters: EMAs help traders quickly identify whether the market is in an uptrend or downtrend, and spotting EMA crossovers can signal potential trade entries.
2. Delta Zones: Detect Buy & Sell Pressure
Delta Zones identify buying and selling pressure by analyzing price movement deviations. The system plots green “Buy Boxes” when bullish pressure is high and red “Sell Boxes” when bearish pressure dominates.
Configurable StdDev levels and lookback periods
Alerts when buy or sell pressure is detected
✅ Why it matters: Delta Zones give traders an edge by visually highlighting where buyers or sellers are strongest, helping to anticipate market moves.
3. Swing Highs & Lows with Candle Patterns
FINAL EMA 05 automatically detects:
Swing Highs (HH/LH) and Swing Lows (LL/HL)
Key candlestick patterns including Hammer, Inverted Hammer, Bullish Engulfing, Hanging Man, Shooting Star, and Bearish Engulfing
Labels are plotted directly on the chart, with tooltips explaining the pattern, making it perfect for beginners and experienced traders alike.
✅ Why it matters: Swing levels and candle patterns help identify market reversals and trend continuations, allowing precise entry and exit timing.
4. Liquidity Channels: Spot Key Levels for Big Moves
Liquidity Channels detect important highs and lows where large traders may have placed their orders. The channels expand over time and are visually highlighted:
Teal lines for bullish liquidity
Red lines for bearish liquidity
Customizable channel growth, line style, and deletion timing
✅ Why it matters: These levels often act as support and resistance zones, and price reactions at these points can indicate major breakouts or reversals.
5. Why Bangladeshi Traders Should Use FINAL EMA 05
Gold (XAUUSD) & Forex Focus: The EMAs and Delta Zones provide accurate trend direction, while liquidity levels show where institutional traders are active.
Multi-Timeframe Insights: Short-term traders can focus on EMA 7, 9, and 10, while swing traders can watch EMA 50, 89, and 200.
All-in-One View: No need to add multiple indicators; this script combines trend, pressure, patterns, and liquidity in one.
Conclusion
The FINAL EMA 05 indicator is not just another EMA or candlestick tool—it’s a complete trading toolkit. By combining trend analysis, pressure zones, swing levels, candlestick patterns, and liquidity channels, it empowers traders to make informed, precise, and confident decisions.
Whether you’re trading USDJPY trends, Gold XAUUSD, or Forex pairs, this indicator helps you spot

True Three Soldiers Method (TTSM) - Breakout ConfirmationIndicator Overview
True Three Soldiers Method (TTSM) - Made in China is a quantifiable evolution beyond traditional candlestick pattern recognition. It replaces subjective visual analysis with an objective, data-driven momentum system featuring smart breakout confirmation.
Core Innovation: Beyond Traditional Pattern Recognition
Traditional three-soldier patterns merely check for three consecutive bullish/bearish candles. TTSM goes much deeper:
Dual Signal System: It identifies both single-candle and three-candle momentum signals, providing earlier warnings of potential trend changes.
Quantifiable Strength Metrics: Each signal must meet customizable thresholds for both absolute price movement (percentage change) and relative efficiency (close-to-open distance relative to total range).
Breakout Confirmation Logic: The real innovation lies in the "True Signal" mechanism. Preliminary signals are tracked, and only when price breaks above the highest high of recent bullish signals (or below the lowest low of recent bearish signals) does it trigger a confirmed entry signal. This eliminates false breakouts and ensures you're trading with confirmed momentum.
Absolute Strength: Quantifies momentum via percentage price change.
Relative Strength: Measures candlestick efficiency (close-to-open vs. total range).
True Signal Validation: A "True" entry signal triggers only after price confirms momentum by breaking above/below a cluster of recent preliminary signals, filtering out false moves.
Dual-Layer Signal System
Key Features
🔴 Amber Signals (Preparation): Single-candle or three-candle patterns that meet strength criteria. These indicate potential momentum building and can be used for preparation or light positioning.
🟢 Green Signals (True Breakout): Triggered only when price breaks above/below the recent signal cluster extremes. These represent confirmed momentum and are ideal for main entries.
🎚 Fully Customizable: Every parameter—absolute/relative strength thresholds, lookback periods, and average calculations—can be adjusted to match your trading style and market conditions.
📊 Clear Visual Feedback: Color-coded labels and reference lines make signal identification instant and intuitive.
Parameter Customization Guide
All parameters are organized in intuitive groups:
Strength Thresholds: Adjust absolute (%) and relative (%) strength requirements for both long and short signals.
First Signal Thresholds: Special thresholds for when a signal is the first in the lookback period.
Lookback & Averages: Control how many bars are considered for signal tracking and moving averages.
Strategic Application
Preparation Signals: Use amber signals to prepare for potential moves, set alerts, or enter with smaller positions.
True Signals: Green/red "True" signals indicate confirmed momentum—ideal for main entries with proper risk management.
Combination Strategy: Pair TTSM with trend indicators (like Supertrend) for higher probability trades—only take True Signals in the direction of the main trend.

GYD-VOLinesCalculate support and resistance lines through the volume of large-level cycles, so that when subsequent candlesticks reach these lines, they can serve as a reference for trading decisions! The larger the cycle, the better the support and resistance effect!
通过大级别周期的成交量计算出支撑阻力线,以便后续K线表达到这里的时候,为交易决策做参考!越大周期的线,撑压效果越好!
