GANN Friday RulesFriday Rules Indicator Description
Purpose:
The Friday Rules indicator identifies and marks specific Friday candlestick patterns based on
weekly price action and candle body-to-wick relationships.
How it Works:
The indicator tracks the weekly high and low from Monday to Friday, then analyzes Friday's
candle to determine its significance and body/wick characteristics.
Signal Types:
🟢 Green F ▲ - Strong Bullish Friday
- Friday makes the weekly high
- Body closes within 1% of the high (minimal upper wick)
- Indicates strong buying pressure with little rejection
🟡 Yellow F ▲ - Weak Bullish Friday
- Friday makes the weekly high
- Body does NOT close near the high (significant upper wick)
- Shows buying interest but with selling pressure/rejection at highs
🔴 Red F ▼ - Strong Bearish Friday
- Friday makes the weekly low
- Body closes within 1% of the low (minimal lower wick)
- Indicates strong selling pressure with little support
🟠 Orange F ▼ - Weak Bearish Friday
- Friday makes the weekly low
- Body does NOT close near the low (significant lower wick)
- Shows selling pressure but with buying support at lows
⚪ White F - Neutral Friday
- Friday does not make weekly high or low
- Regular Friday with no extreme weekly price action
Key Features:
- Resets weekly tracking every Monday
- All signals positioned above the candle for clean visibility
- Arrow direction indicates bullish (▲) vs bearish (▼) bias
- Color coding shows strength: Green/Red = strong, Yellow/Orange = weak, White = neutral
Usage:
Use this indicator to identify significant Friday price action that may influence next week's
trading, weekend sentiment, and weekly closing patterns.
Search in scripts for "Candlestick"

[LTS] Marubozu Candle StrategyOVERVIEW
The Marubozu Candle Strategy identifies and trades wickless candles (Marubozu patterns) with dynamic take-profit and stop-loss levels based on market volatility. This indicator combines traditional Japanese candlestick pattern recognition with modern volatility-adjusted risk management and includes a comprehensive performance tracking dashboard.
A Marubozu candle is a powerful continuation pattern characterized by the complete absence of wicks on one side, indicating strong directional momentum. This strategy specifically detects:
- Bullish Marubozu: Close > Open AND Low = Open (no lower wick)
- Bearish Marubozu: Close < Open AND High = Open (no upper wick)
When price returns to test these levels, the indicator generates trading signals with predefined risk-reward parameters.
CORE METHODOLOGY
Detection Logic:
The script scans each bar for Marubozu formations using precise price comparisons. When a wickless candle appears, a horizontal line extends from the opening price, marking it as a potential support (bullish) or resistance (bearish) level. These levels remain active until price touches them or until the maximum line limit is reached.
EMA Filter (Optional):
An exponential moving average filter enhances signal quality by requiring proper trend alignment. For bullish signals, price must be above the EMA when touching the level. For bearish signals, price must be below the EMA. This filter reduces counter-trend trades and improves win rates in trending markets. Users can disable this filter for range-bound conditions.
Dynamic Risk Management:
The strategy employs ATR-based (Average True Range) position sizing rather than fixed point values. This approach adapts to market volatility automatically:
- In low volatility: Tighter stops and targets
- In high volatility: Wider stops and targets proportional to market movement
Default settings use a 2:1 reward-to-risk ratio (1x ATR for take-profit, 0.5x ATR for stop-loss), but users can adjust these multipliers to match their trading style.
HOW IT WORKS
Step 1 - Pattern Detection:
On each bar, the indicator evaluates whether the candle qualifies as a Marubozu by comparing the high, low, open, and close prices. When detected, the opening price becomes the key level.
Step 2 - Level Management:
Horizontal lines extend from each Marubozu's opening price. The indicator maintains two separate arrays: one for unbroken levels (actively extending) and one for broken levels (historical reference). Users can configure how many of each type to display, preventing chart clutter while maintaining relevant context.
Step 3 - Signal Generation:
When price returns to touch a Marubozu level, the indicator evaluates the EMA filter condition. If the filter passes (or is disabled), the script draws TP/SL boxes showing the expected profit and loss zones based on current ATR values.
Step 4 - Trade Tracking:
Each valid signal enters the tracking system, which monitors subsequent price action to determine outcomes. The script identifies whether the take-profit or stop-loss was hit first (discarding trades where both trigger on the same candle to avoid ambiguous results).
PERFORMANCE DASHBOARD
The integrated dashboard provides real-time strategy analytics to automatically convert results to dollar values for any instrument:
Tracked Metrics:
- Total Trades: Complete count of closed positions
- Wins/Losses: Individual counts with color coding
- Win Rate: Success percentage with dynamic color (green >= 50%, red < 50%)
- Total P&L: Cumulative profit/loss in dollars
- Avg Win: Mean dollar amount per winning trade
- Avg Loss: Mean dollar amount per losing trade
NOTE: The dollar values shown in the dashboard are for trading only a single share/contract/etc. You will need to manually multiply those numbers by the amount of shares/contracts you are trading to get a true value.
The dollar conversion works automatically across all markets:
- Futures contracts (ES, NQ, CL, etc.) use their contract specifications
- Forex pairs use standard lot calculations
- Stocks and crypto use their respective point values
This eliminates manual calculation and provides immediate performance feedback in meaningful currency terms.
CUSTOMIZATION OPTIONS
ATR Settings:
- ATR Period: Lookback length for volatility calculation (default: 14)
- TP Multiplier: Take-profit distance as multiple of ATR (default: 3.0)
- SL Multiplier: Stop-loss distance as multiple of ATR (default: 1.5)
EMA Settings:
- EMA Length: Period for trend filter calculation (default: 9)
- Use EMA Filter: Toggle trend confirmation requirement (default: enabled)
Visual Settings:
- Bullish Color: Color for long signals and wins (default: green)
- Bearish Color: Color for short signals and losses (default: red)
- EMA Color: Color for trend filter line (default: orange)
- Line Width: Thickness of Marubozu level lines (1-5, default: 2)
- EMA Width: Thickness of EMA line (1-5, default: 2)
Line Management:
- Max Unbroken Lines: Limit for active extending lines (default: 10)
- Max Broken Lines: Limit for historical touched lines (default: 5)
Dashboard Settings:
- Show Dashboard: Toggle performance display on/off
- Dashboard Position: Corner placement (4 options)
- Dashboard Size: Text size selection (Tiny/Small/Normal/Large)
HOW TO USE
1. Add the indicator to your chart
2. Adjust ATR multipliers based on your risk tolerance (higher values = more conservative)
3. Configure the EMA filter based on market conditions (enable for trending, disable for ranging)
4. Set line limits to match your visual preference and chart timeframe
5. Monitor the dashboard to track strategy performance in real-time
6. Use the TP/SL boxes as reference levels for manual trades or automation
Best Practices:
- Enable EMA filter in strongly trending markets
- Disable EMA filter if you want more trade signals but at lower quality
- Increase ATR multipliers in highly volatile markets
- Decrease ATR multipliers for tighter, more frequent trades
- Review avg win/loss ratio to ensure positive expectancy
UNIQUE FEATURES
Unlike basic Marubozu detectors, this strategy provides:
1. Automatic level tracking with memory management
2. Volatility-adjusted risk parameters instead of fixed values
3. Optional trend confirmation via EMA filter
4. Real-time performance analytics with automatic dollar conversion
5. Separate tracking of wins/losses with individual averages
6. Configurable visual display to prevent chart clutter
7. Complete transparency with all logic visible in open-source code

Swing Points LiquiditySwing Points Liquidity
Unlock advanced swing detection and liquidity zone marking for smarter trading decisions.
Overview:
Swing Points Liquidity automatically identifies key swing highs and swing lows using a five-candle “palm” structure, marking each significant price turn with precise labels: “BSL swing high” for potential bearish liquidity and “SSL swing low” for potential bullish liquidity. This transparent swing logic provides a robust way to highlight areas where price is most likely to react—making it an invaluable tool for traders applying Smart Money Concepts, supply and demand, or liquidity-based strategies.
How It Works:
The indicator scans every candle on your chart to detect and label swing highs and lows.
A swing high (“BSL swing high”) is identified when a central candle’s high is greater than the highs of the previous two and next two candles.
A swing low (“SSL swing low”) is identified when a central candle’s low is lower than the lows of the previous two and next two candles.
Labels are plotted for every detected swing point, providing clear visualization of important market liquidity levels on any symbol and timeframe.
How to Use:
Liquidity levels marked by the indicator are potential price reversal zones. To optimize your entries, combine these levels with confirmation signals such as reversal candlestick patterns, order blocks, or fair value gaps (FVGs).
When you see a “BSL swing high” or “SSL swing low” label, observe the price action at that area—if a reliable reversal pattern or order block/FVG forms, it can signal a high-probability trade opportunity.
These marked liquidity swings are also excellent for locating confluence zones, setting stop losses, and identifying where institutional activity or smart money may trigger significant moves. Always use market structure and price action in conjunction with these levels for greater consistency and confidence in your trading.
Features:
Customizable label display for swing highs (BSL) and swing lows (SSL)
Automatic detection using robust 5-candle palm logic
Works with all symbols and chart timeframes
Lightweight, clear visual style—easy for manual and algorithmic traders
Notes:
The indicator requires at least two candles both before and after each swing point, so labels will start appearing after enough historical data is loaded.
For deeper historical analysis, simply scroll left or zoom out on your chart to load more candles—the indicator will automatically process and display swing points on all available data.

QT Insights [Pro +]: PSP + TPD Alerts | [cephxs]This indicator's primary function is to highlight chart candlestick divergence with candle closes.
*A full list of the Supported Correlated Asset Pairings (CAPs) will be linked at the bottom.
There are two primary operating modes
PSP Only
All precision candles
There is a tooltip describing what each operating mode does in the indicator settings
Asset Selection
The indicator handles asset selection for divergences automatically for a large variety of asset(s) classes automatically and is ready for use Out of the Box with Major Assets like:
CME_MINI:NQ1! , CME_MINI:ES1! , CBOT_MINI:YM1!
It also works with non-futures for indices (CFD), for best functionality with no stress, we only have support for the following brokers. CAPITALCOM, VANTAGE, OANDA
It works with Forex, Crypto and Energies, also works with Metals.
The default pairings are determined by the active chart
i.e CME_MINI:NQ1! will pair with Asset 2 as CME_MINI:ES1! and Asset 3 as CBOT_MINI:YM1!
Alerts
This version has alerts, I will create a tutorial for that. You can use the alerts by adding alerts and selecting the indicator from the "Contdition" Dropdown in the Alert Creation Pop-up
Customizations
The indicator is fully customizable in the Styles tab under the settings
Play around with it and determine what works best with your aesthetic, it comes out of the box with a lot of clutter and as you can see in the showcase image, it's clean and functional, just how I like it.
*Supported CAPs
CFD
Forex:
EURUSD / GBPUSD (FOREXCOM Only)
Indices:
NAS100 / SPX500 / US 30 (CAPITALCOM / Vantage / Oanda Only)
Metals:
XAUUSD / XAGUSD
Futures
Indices:
NQ / MNQ , ES / MES , YM / MYM
Metals:
GC / MGC , SI / SIL
Crypto
BTCUSD / ETHUSD, this will work for any asset with "BTC" or "ETH" in the asset name
Note: There is support for Micro contracts automatically
Subsequent Updates Will be posted, Stay tuned.
Note: I wrote this description on the fly so there might be flaws, Regardless, made with ❤️ by cephxs

HammerThis indicator automatically detects powerful candlestick formations such as Hammer, Inverted Hammer, Bullish Engulfing, Hanging Man, Shooting Star, and Bearish Engulfing.
It visually marks potential reversal zones on the chart and provides instant Long / Short alerts.
By combining pattern recognition with swing levels, it helps you identify possible trend reversals more clearly.
A simple, fast, and price-action-focused tool for smarter trading decisions.
💡 Yellow dotted lines indicate possible reaction zones around swing points.
DAMMU CANDEL TYPE🧩 Overview
Detects multiple bullish and bearish candlestick patterns.
Plots visual buy/sell signals and labels on chart.
Sends alerts when patterns appear.
Shows table of enabled/disabled patterns.
✅ Main Features
Bullish patterns: Hammer, Inverted Hammer, Bullish Engulfing, Morning Star, Piercing, Dragonfly Doji.
Bearish patterns: Hanging Man, Shooting Star, Bearish Engulfing, Evening Star, Dark Cloud, Gravestone Doji.
Visuals: Green/red arrows and labels.
Alerts: Optional alerts for bullish/bearish signals.
Table: Shows active pattern status.
⚙️ Improvements Suggested
Move table.new outside if block to prevent recreation every bar.
Adjust label position to avoid overlap.
Add “signal strength” (count multiple patterns same bar).
Add MA confirmation for better accuracy.
Upgrade to Pine Script v6 for better performance.
GRG/RGR Signal, MA, Ranges and PivotsThis indicator is a combination of several indicators.
It is a combination of two of my indicators which I solely use for trading
1. EMA 10-20-50-200, Pivots and Previous Day/Week/Month range
2. 3/4-Bar GRG / RGR Pattern (Conditional 4th Candle)
You can use them individually if you already have some of them or just use this one. Belive me when I say, this is all you need, along with market structure knowlege and even if you don’t have that, this indicator has been doing wonders for me. This is all I use. I do not use anything else.
**Note - Do checkout the indicators individually as I have added valuable information in the comment section.
It contains the following,
1. 10 EMA/SMA - configurable
2. 20 EMA/SMA - configurable
3. 50 EMA/SMA - configurable
4. 200 EMA/SMA - configurable
5. Previous Day's Range - configurable
6. Previous Week's Range - configurable
7. Previous Month's Range - configurable
8. Pivots - configurable
9. Buy Sell Signal - configurable
The Moving Averages
It is a very important combination and using it correctly with price action will strengthen your entries and exits.
The ema's or sma's added are the most powerful ones and they do definitely act as support and resistance.
The Daily/Weekly/Monthly Ranges
The Daily/Weekly/Monthly ranges are extremely important for any trader and should be used for targets and reversals.
Pivots
Pivots can provide support and resistance level. R5 and S5 can be used to check for over stretched conditions. You can customise them however you like. It is a full pivot indicator.
It is defaulted to show R5 and S5 only to reduce noise in the chart but it can be customised.
The 3/4 RGR or GRG Signal Generator
Combined with a 3/4 RGR or GRG setup can be all a trader needs.
You don't need complex strategies and SMC concepts to trade. Simple EMAs, ranges and RGR/GRG setup is the most winning combination.
This indicator can be used to identify the Green-Red-Green or Red-Green-Red pattern.
It is a price action indicator where a price action which identifies the defeat of buyers and sellers.
If the buyers comprehensively defeat the sellers then the price moves up and if the sellers defeat the buyers then the price moves down.
In my trading experience this is what defines the price movement.
It is a 3 or 4 candle pattern, beyond that i.e, 5 or more candles could mean a very sideways market and unnecessary signal generation.
How does it work?
Upside/Green signal
1. Say candle 1 is Green, which means buyers stepped in, then candle 2 is Red or a Doji, that means sellers brought the price down. Then if candle 3 is forming to be Green and breaks the closing of the 1st candle and opening of the 2nd candle, then a green arrow will appear and that is the place where you want to take your trade.
2. Here the buyers defeated the sellers.
3. Sometimes candle 3 falls short but candle 4 breaks candle 1's closing and candle 2's opening price. We can enter on candle 4.
4. Important - We need to enter the trade as soon as the price moves above the candle 1 and 2's body and should not wait for the 3rd or 4th candle to close. Ignore wicks.
5. But for a more optimised entry I have added an option to use candle’s highs and lows instead of open and close. This reduces lot of noise and provides us with more precise entry. This setting is turned on by default.
6. I have restricted it to 4 candles and that is all that is needed. More than that is a longer sideways market.
7. I call it the +-+ or GRG pattern or Green-Red-Green or Buyer-Seller-Buyer or Seller defeated or just Buyer pattern.
8. Stop loss can be candle 2's mid for safe traders (that includes me) or candle 2's body low for risky traders.
9. Back testing suggests that body low will be useless and result in more points in loss because for the bigger move this point will not be touched, so why not get out faster.
Downside/Red signal
1. Say candle 1 is Red, which means sellers stepped in, then candle 2 is Green or a Doji, that means buyers took the price up. Then if candle 3 is forming to be Red and breaks the closing of the 1st candle and opening of the 2nd candle then a Red arrow will appear and that is the place where you want to take your trade.
2. Sometimes candle 3 falls short but candle 4 breaks candle 1's closing and candle 2's opening price. We can enter on candle 4.
3. We need to enter the trade as soon as the price moves below the candle 1 and 2's body and should not wait for the 3rd or 4th candle to close.
4. But for a more optimised entry I have added an option to use candle’s highs and lows instead of open and close. This reduces lot of noise and provides us with more precise entry. This setting is turned on by default.
5. I have restricted it to 4 candles and that is all that is needed. More than that is a longer sideways market.
6. I call it the -+- or RGR pattern or Red-Green-Red or Seller-Buyer-Seller or Buyer defeated or just Seller pattern.
7. Stop loss can be candle 2's mid for safe traders ( that includes me) or candle 2's body high for risky traders.
8. Back testing suggests that body high will be useless and result in more points in loss because for the bigger move this point will not be touched, so why not get out faster.
Combining Indicators and Signal
Combining these indicators with GRG/RGR signal can be very powerful and can provide big moves.
1. MA crossover and Signal - This is very powerful and provides a very big move. Trades can be held for longer. If after taking the trade we notice that the MA crossover has happened then trades can be held for higher targets.
2. Pivots and Signal - Pivots and add a support or resistance point. Take profits on these points. R5/S5 are over streched conditions so we can start looking for reversal signals and ignore other signals
3. Intraday Range - first 1, 5, 15 min of the day - Sideways days is when price will stay in these ranges. You can take profits at these ranges or if the range is broken and we get a signal, then it can mean that the direction will be sustained.
4. Previous Day/Week/Month Ranges - These can be used as Take Profit points if the price is moving towards them after getting the signal. If the range is broken and we get a signal then it can be a strong signal. They can also be used as reversal points if a strong signal is generated.
Important Settings
1. Include 4th Candle Confirmation - You can enable or disable the 4th candle signal to avoid the noise, but at times I have noticed that the 4th candle gives a very strong signal or I can say that the strong signal falls on the 4th candle. This is mostly a coincidence.
2. Bars to check (default 10) - You can also configure how many previous bars should the signal be generated for. 10 to 30 is good enough. To backtest increase it to 2000 or 5000 for example.
3. Use Candle High/Low for confirmation instead of Candle Open/Close - More optimized entry and noise reduction. This option is now defaulted to false.
4. Show Green-Red-Green (bull) signals - Show only bull entries. Useful when I have a predefined view i.e, I know market is going to go up today.
5. Show Red-Green-Red (bear) signals - Show only bear entries. Useful when I have a predefined view i.e, I know market is going to go down today.
6. 3rd candle should be a Strong candle before considering 4th candle - This will enforce additional logic in 4 candle setup that the 3rd candle is the candle in our direction of breakout. This means something like GRGG is mandatory, which is still the default behaviour. If disabled, the 3rd candle can be any candle and 4th candle will act as our breakout candle. This behaviour has led to breakouts and breakdowns as times, hence I added this as a separate feature. Vice-versa for a RGGR.
For a 4 candle setup till now we were expecting GRGG or RGRR but we can let the system ignore the 3rd candle completely if needed.
This will result in additional signals.
7. Three intraday ranges added for index and stock traders - 1 min, 5 min and 15 min ranges will be displayed. These are disabled by default except 15 min. These are very important ranges and in sideways days the price will usually move within the 15 min. A breakout of this range and a positive signal can be a very powerful setup.
Safe traders can avoid taking a trade in this range as it can lead to fakeouts.
The line style, width, color and opacity are configurable.
Pointers/Golden Rules
1. If after taking the trade, the next candle moves in your direction and closes strong bullish or bearish, then move SL to break even and after that you can trail it.
2. If a upside trade hits SL and immediately a down side trade signal is generated on the next candle then take it. Vice versa is true.
3. Trades need to be taken on previous 2 candle's body high or low combined and not the wicks.
4. The most losses a trader takes is on a sideways day and because in our strategy the stop loss is so small that even on a sideways day we'll get out with a little profit or worst break even.
5. Hold trades for longer targets and don't panic.
6. If last 3-4 days have been sideways then there is a good probability that today will be trending so we can hold our trade for longer targets. Inverse is true when the market has been trending for 2-3 days then volatility followed by sideways is coming (DOW theory). Target to hold the trade for whole day and not exit till the day closes.
7. In general avoid trading in the middle of the day for index and stocks. Divide the day into 3 parts and avoid the middle.
8. Use Support/Resistance, 10, 20, 50, 200 EMA/SMA, Gaps, Whole/Round numbers(very imp) for identifying targets.
9. Trail your SL.
10. For indexes I would use 5 min and 15 min timeframe and at times 10 mins.
11. For commodities and crypto we can use higher timeframe as well. Look for signals during volatile time durations and avoid trading the whole day. Signal usually gives good targets on those times.
12. If a GRG or RGR pattern appears on a daily timeframe then this is our time to go big.
13. Minimum Risk to Reward should be 1:2 and for longer targets can be 1:4 to 1:10.
14. Trade with small lot size. Money management will happen automatically.
15. With small lot size and correct Risk-Reward we can be very profitable. Don't trade with big lot size.
16. Stay in the market for longer and collect points not money.
17. Very imp - Watch market and learn to generate a market view.
18. Very imp - Only 3 type of candles are needed in trading -
Strong Bullish (Big Green candle), Strong Bearish (Big Red candle),
Hammer (it is Strong Bullish), Inverse Hammer (it is Strong Bearish)
and Doji (indecision or confusion).
If on daily timeframe I see Strong Bullish candle previous day then I am biased to the upside the next day, if I see Strong Bearish candle the previous day then I am biased to the downside the next day, if I see Doji on the previous day then I am cautious the next day, if there are back to back Dojis forming in daily or weekly then I am preparing for big move so time to go big once I get the signal.
19. Most Important Candlestick pattern - Bullish and Bearish Engulfing
20. The only Chart patterns I need -
a) Falling Wedge/Channel Bullish Pattern Uptrend or Bull Flag - Buying - Forming over a couple days for intraday and forming over a couple of weeks for swing
b) Falling Wedge/Channel Bullish Pattern Downtrend or Falling Channel - Buying
c) Rising Wedge Bearish Pattern Uptrend or Rising Channel - Selling
d) Rising Wedge Bearish Pattern Downtrend or Bear flag - Selling
e) Head and Shoulder - Over a longer period not for intraday. In 15 min takes few days and for swing 1hr or 4h or daily can take few days
f) M and W pattern - Reversal Patterns - They form within the above 4 patterns, usually resulting in the break of trend line
21. How Gaps work -
a) Small Gap up in Uptrend - Market can fill the gap and reverse. The perception is that people are buying. If previous day candle was Strong Bullish then market view is up.
b) Big Gap up in Uptrend - Not news driven - Profit booking will come but may not fill the entire gap
c) Big Gap up in Uptrend - News driven, war related, tax, interest rate - Market can keep going up without stopping.
c) Flat opening in Uptrend - Big chance of market going up. If previous day candle was Strong Bullish then view is upwards, if it was Doji then still upwards.
d) Gap down in Uptrend - Market is surprised. After going down initially it can go up
e) Small Gap down in Downtrend - Market can fill the gap and keep moving down. If previous day candle was Strong Bearish then view is still down.
f) Flat opening in Downtrend - View is down, short today.
g) Big Gap down in Downtrend - Profit booking and foolish buying will come but market view is still down.
h) Gap down with News - Volatility, sideways then down.
i) Gap Up in Downtrend - Can move up - Price can move up during 2/3rd of the day and End of the day revert and close in red.
22. Go big on bearish days for option traders. Puts are better bought and Calls are better sold.
23. Cluster of green signals can lead to bigger move on the upside and vice versa for red signals.
24. Most of this is what I learned from successful traders (from the top 2%) only the indicator is mine.

Tristan's Three Line Strike PatternThree Line Strike Indicator (5-Minute Timeframe)
This indicator highlights Three Line Strike candlestick patterns on a 5-minute chart . The Three Line Strike is a rare four-candle formation that often signals trend continuation rather than reversal.
Bullish Three Line Strike (green “3LS long” above the candle):
Three strong bullish candles in a row are followed by a large bearish candle that completely engulfs the prior three. Despite looking bearish, this setup often indicates strength in the uptrend.
Bearish Three Line Strike (red “3LS sell” below the candle):
Three consecutive bearish candles are followed by a large bullish engulfing candle. Although it looks like a reversal, the downtrend commonly resumes.
How to use on the 5-min chart:
Watch for the labels marking the pattern.
A bullish signal suggests that the upward move is likely to continue after the engulfing candle.
A bearish signal suggests that the downtrend is likely to continue after the engulfing candle.
These signals are not entry/exit triggers on their own—I suggest you combine them with trend confirmation (e.g., moving averages, momentum indicators, or volume analysis) before acting.
Use good risk management, and don't buy / sell based on these indicators alone.

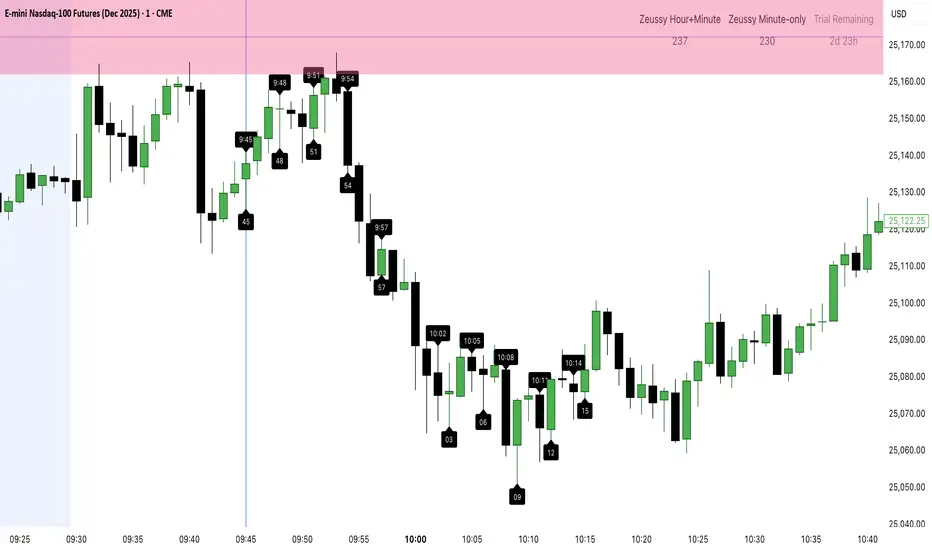
Zeussy 3-6-9 Indicator (NY) – Paid Trial - Trial VersionZeussy 3-6-9 Indicator (NY) – Trial Version
An innovative trading indicator based on the Zeussy 3-6-9 timing system, supporting New York time.
Key Features:
Dynamic Candlestick Colors: Clear coloring for bullish and bearish candles.
Zeussy Labels:
Hour+Minute labels for sums 3, 6, 9.
Minute-only labels for sums 3, 6, 9.
Vertical Line at Minute 45 to highlight key time points.
Daily Statistics: Counts of Zeussy Hour+Minute and Zeussy Minute-only occurrences.
3-Day Trial: All premium features are active automatically for 3 days from the first bar on any chart.
Countdown Timer: Shows remaining days and hours during the trial period.
After the trial expires: all premium features are disabled, and a red warning appears:
"Trial Expired! Please Purchase Paid Version"
Sound Alerts when Zeussy Labels appear (can be enabled/disabled).
Customizable Options: Candle colors, Zeussy Label colors, label size, show/hide trial text, show/hide table and lines.
💰 Purchase Full Version: $30. Contact me directly to buy a permanent license.
Trendoman Indicator Trendoman "Trading Signals" indicator
This is our first indicator that will give signals for buying and selling (With the possibility of setting (Alert). The indicator is optimized for the senior TF (1D and 4h). Signals are given automatically after the closing of the candle.
This indicator combines oscillators (Stochastic, RSI, MACD), adds EMA (50,100,200) to determine the local and medium-term trend, and adds certain conditions (Formulas) to determine entry points and signal generation.
This is the first version of the indicator, and it will be improved and updated. This indicator is provided for informational purposes only.
Индикатор Trendoman "Торговые сигналы"
What does it do and how to use it?
This script was written for me, so I made it for my main timeframe, which is 1D. This is the timeframe I tested it on (Russian and US stock market)
When adding the indicator to the chart, open the daily timeframe (1D).
What will we see?
⚫️BUY or SELL signals on the chart. They appear after the closing of the trading day candlestick, therefore, as soon as you see this signal, you can open a trade (In the settings, you can use (Alert Notification) so that when the signal appears, a notification is triggered on a specific instrument.
⚫️Notification preparation "Prep" on the chart. THIS IS NOT A SIGNAL, it is a regular notification when the price enters the overbought or oversold zone. We use this to set Take-Profit and Stop-lose, as well as to understand that it is dangerous to buy in the overbought zone, and to sell in the oversold zone. If you do not need them, you can disable them in the settings.
⚫️The line in the middle. This is a moving average, which shows the direction of the trend (In the settings
Stop-lose and Take-Profit
Trying to build into this indicator the ability to automatically set Stop-lose and Take-Profit did not lead to anything. The main problems are completely different situations at the time of the signal (Mathematically it is not calculated). Have to count yourself.
To set Stop-lose after the signal.
1. Look at the previous local minimum (If the signal is to buy or local maximum (If the signal is to sell). It can be the body of a candle, the shadow of a candle, or a specific level. The stop is always placed below this level, range, or local minimum or maximum.
To set the Take-Profit after the signal is given. There are several options.
1. Mark the levels. Look at an important support or resistance range, fix part of the position at the level, and set the stop for the remainder at breakeven (Entry Price)
2. Make a risk of 1 to 1. If you do not define levels and markup well, then after changing the Stop-lose, you can put the first take on the same%. Example:
Stop-lose и Take-Profit
When you can't open a position EVEN if the indicator shows a signal.
⚫️ If the indicator shows a signal (BAY or SELL), and the signal candle or the previous one opens with a gap. CANCELLED SIGNAL.
⚫️ If the signal candle has a large impulse (down or up). It's very easy to check, take the last 10 candles, if it's higher than the average, it's better to skip this signal (long stop)
⚫️Illiquid instruments. The second and third echelons are often pumped by market participants. Indicators and candles do not work stably. Do not trade illiquid instruments using this indicator.
Risk management.
As noted above, it is impossible to calculate the exact Stop-lose and Take-Profit mathematically, as each situation is unique (levels, highs, lows, slopes, etc. differ).
If you see that your Take-Profit is less than your Stop-lose, it is best to ignore such a trade (depending on your risk tolerance).
Try to open trades where the Take-Profit is greater than the Stop-lose.


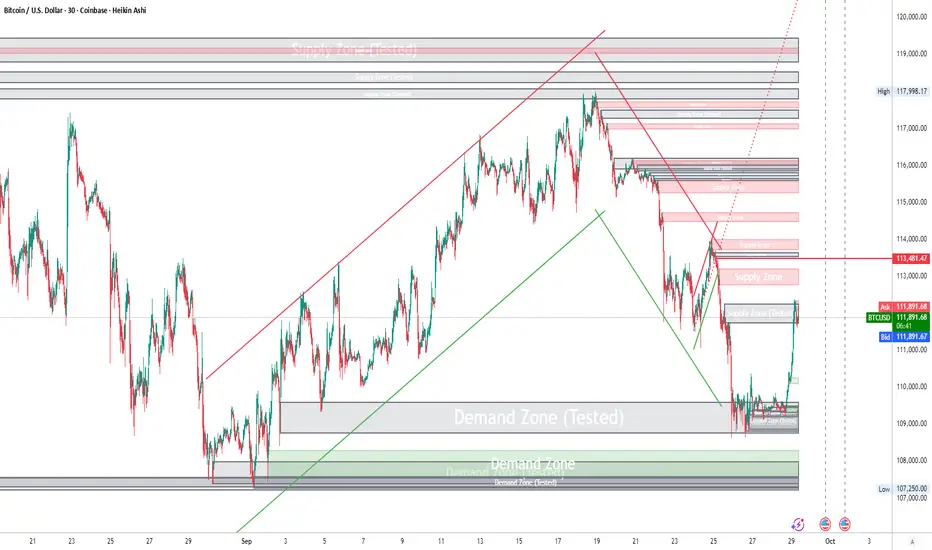
Institutions ZonesInstitutions Zone Tracker
This indicator automatically detects, draws, and manages institutional zones using refined order block logic. It is built to highlight high-probability reversal or breakout areas across any timeframe, with advanced zone management features that go beyond typical open-source versions.
How It Works
The script identifies price regions where significant institutional buying or selling has previously occurred and tracks how they evolve in real time:
Green = Areas of strong institutional buying interest.
Red = Areas of institutional selling interest.
Gray = Tested Zone: If price re-enters a previously drawn zone, it turns gray and relabels as “Tested,” signaling reduced reaction strength.
Unlike many standard supply/demand tools, this script includes automatic zone removal, tested-zone tracking, and no-repaint logic to maintain chart accuracy and reduce clutter.
Features
Dynamic zone creation and removal based on order block and mitigation rules.
Real-time updates with no repainting.
Visual clarity controls (adjustable transparency, labels inside zones).
Automatic zone lifecycle tracking, with clear status indicators (“Demand Zone,” “Supply Zone,” “Tested”).
How to Use
Apply the indicator to any chart and timeframe.
Use Demand Zones as potential long/swing-low areas and Supply Zones as potential short/swing-high areas.
When a zone turns gray, treat it as weakened — reactions may be less reliable.
Combine with your own technical or fundamental analysis for confirmation.
Best Practices
Pair with candlestick reversal signals or momentum indicators for higher accuracy.
Adjust tuning/mitigation parameters to fit your trading style and the asset’s volatility.
Use across multiple timeframes to validate institutional order flow alignment.
Why This Script Is Different
Most open-source supply/demand indicators only plot static zones. This script introduces:
Automatic zone removal to keep charts clean and relevant.
Dynamic “tested zone” logic that tracks weakening institutional levels.
Real-time, no-repaint drawing, ensuring zones remain accurate as price action evolves.
These unique features make the tool more practical for live trading and justify closed-source protection.
⚠️ Disclaimer
This script is for educational and informational purposes only. It does not constitute financial advice. Always conduct your own analysis and consult a licensed professional before trading. The author is not liable for losses or damages. Use at your own risk.
Swing Oracle Stock 2.0- Gradient Enhanced# 🌈 Swing Oracle Pro - Advanced Gradient Trading Indicator
**Transform your technical analysis with stunning gradient visualizations that make market trends instantly recognizable.**
## 🚀 **What Makes This Indicator Special?**
The **Swing Oracle Pro** revolutionizes traditional technical analysis by combining advanced NDOS (Normalized Distance from Origin of Source) calculations with a sophisticated gradient color system. This isn't just another indicator—it's a complete visual trading experience that adapts colors based on market strength, making trend identification effortless and intuitive.
## 🎨 **10 Professional Gradient Themes**
Choose from carefully crafted color schemes designed for optimal visual clarity:
- **🌅 Sunset** - Warm oranges and purples for classic elegance
- **🌊 Ocean** - Cool blues and teals for calm analysis
- **🌲 Forest** - Natural greens and browns for organic feel
- **✨ Aurora** - Ethereal greens and magentas for mystique
- **⚡ Neon** - Vibrant electric colors for high-energy trading
- **🌌 Galaxy** - Deep purples and cosmic hues for night sessions
- **🔥 Fire** - Intense reds and golds for volatile markets
- **❄️ Ice** - Cool whites and blues for clear-headed decisions
- **🌈 Rainbow** - Full spectrum for comprehensive analysis
- **⚫ Monochrome** - Professional grays for focused trading
## 📊 **Core Features**
### **Advanced NDOS System**
- Normalized Distance from Origin of Source calculation with 231-period length
- Smoothed with customizable EMA for reduced noise
- Multi-timeframe confirmation with H1 filter option
- Dynamic gradient coloring based on oscillator position
### **Intelligent Visual Feedback**
- **Primary Gradient Line** - Main NDOS plot with dynamic color transitions
- **Gradient Fill Zones** - Beautiful color-coded areas for bullish, neutral, and bearish regions
- **Smart Transparency** - Colors adjust intensity based on market volatility
- **Dynamic Backgrounds** - Subtle gradient backgrounds that respond to market conditions
### **Enhanced EMA Projection System**
- 75/760 period EMA normalization with 50-period lookback
- Gradient-colored projection line for trend forecasting
- Toggleable display with advanced gradient controls
- Price tracking for precise level identification
### **Multi-Timeframe Analysis Table**
- Real-time trend analysis across 6 timeframes (1m, 3m, 5m, 15m, 1H, 4H)
- Gradient-colored cells showing trend strength
- Customizable table size and position
- Professional emoji indicators (🚀 UP, 📉 DOWN, ➡️ FLAT)
### **Signal System**
- **Gradient Buy Signals** - Triangle up arrows with intensity-based coloring
- **Gradient Sell Signals** - Triangle down arrows with strength indicators
- **Alert Conditions** - Built-in alerts for all signal types
- **7-Day Cycle Tracking** - Tuesday-to-Tuesday weekly cycle visualization
## ⚙️ **Customization Controls**
### **🎨 Gradient Controls**
- **Gradient Intensity** - Adjust color vibrancy (0.1-1.0)
- **Gradient Smoothing** - Control color transition smoothness (1-10 periods)
- **Dynamic Background** - Toggle animated background gradients
- **Advanced Gradients** - Enable/disable EMA projection and enhanced features
### **🛠️ Custom Color System**
- **Bullish Colors** - Define custom start/end colors for bull markets
- **Bearish Colors** - Set personalized bear market gradients
- **Full Theme Override** - Create completely custom color schemes
- **Real-time Preview** - See changes instantly on your chart
## 📈 **How to Use**
1. **Choose Your Theme** - Select from 10 professional gradient themes
2. **Configure Levels** - Adjust high/low levels (default 60/40) for your timeframe
3. **Set Smoothing** - Fine-tune gradient smoothing for your trading style
4. **Enable Features** - Toggle background gradients, candlestick coloring, and advanced EMA projection
5. **Monitor Signals** - Watch for gradient buy/sell arrows and multi-timeframe confirmations
## 🎯 **Trading Applications**
- **Swing Trading** - Perfect for identifying medium-term trend changes
- **Scalping** - Multi-timeframe table provides quick trend confirmation
- **Position Sizing** - Gradient intensity shows signal strength for risk management
- **Market Analysis** - Beautiful visualizations make complex data instantly understandable
- **Education** - Ideal for learning market dynamics through visual feedback
## ⚡ **Performance Optimized**
- **Smart Rendering** - Colors update only on significant changes
- **Efficient Calculations** - Optimized algorithms for smooth performance
- **Memory Management** - Minimal resource usage even with complex gradients
- **Real-time Updates** - Responsive to market changes without lag
## 🚨 **Alert System**
Built-in alert conditions notify you when:
- NDOS crosses above high level (Buy Signal)
- NDOS crosses below low level (Sell Signal)
- Multi-timeframe confirmations align
- Customizable alert messages with emoji indicators
## 🔧 **Technical Specifications**
- **PineScript Version**: v6 (Latest)
- **Overlay**: True (plots on main chart)
- **Calculations**: NDOS, EMA normalization, volatility-based transparency
- **Timeframes**: Compatible with all timeframes
- **Markets**: Stocks, Forex, Crypto, Commodities, Indices
## 💡 **Why Choose Swing Oracle Pro?**
This isn't just another technical indicator—it's a complete visual transformation of your trading experience. The gradient system provides instant visual feedback that traditional indicators simply can't match. Whether you're a beginner learning to read market trends or an experienced trader seeking clearer signals, the Swing Oracle Pro delivers professional-grade analysis with unprecedented visual clarity.
**Experience the future of technical analysis. Your charts will never look the same.**
---
*⚠️ Disclaimer: This indicator is for educational and informational purposes only. Past performance does not guarantee future results. Always conduct your own research and consider risk management before making trading decisions.*
**🔔 Like this indicator? Please leave a comment and boost! Your feedback helps improve future updates.**
---
**📝 Tags:** #GradientTrading #SwingTrading #NDOS #MultiTimeframe #TechnicalAnalysis #VisualTrading #TrendAnalysis #ColorCoded #ProfessionalCharts #TradingToo

[DEM] Exit Signals Exit Signals is designed to identify potential exit points for existing positions by detecting specific candlestick patterns that suggest momentum exhaustion or reversal conditions using ATR-based size requirements. The indicator generates sell signals (red X marks above bars) when either a large bullish candle from the previous session (body size greater than 0.5x ATR over 50 periods) is followed by a bearish close near the previous open, or when the current candle shows exceptionally strong bullish momentum (body size greater than 1.3x ATR over 26 periods). Conversely, buy signals (blue X marks below bars) are triggered when a large bearish candle is followed by a bullish close near the previous open, or when the current candle displays exceptionally strong bearish momentum, helping traders identify potential exit opportunities where extreme price movements may be signaling exhaustion and possible reversal rather than continuation.
STC Oscillator [Panel]📈 STC Oscillator – Short Description
This indicator plots the STC (Schaff Trend Cycle) line, ranging between 0 and 100, in a dedicated sub-panel.
It is intended to be used together with the main overlay script:
➡ "STC Advanced Signals with Early Warnings "
The oscillator provides the internal basis for all signals, such as:
Early warning pivots
Threshold confirmations
Candlestick alignment
Note:
The main overlay indicator does not show the oscillator line itself, in order to keep the price chart clean. Use this sub-panel version to monitor oscillator trends, divergence, or cycle phases directly.

Swing Oracle Stock// (\_/)
// ( •.•)
// (")_(")
📌 Swing Oracle Stock – Professional Cycle & Trend Detection Indicator
The Swing Oracle Stock is an advanced market analysis tool designed to highlight price cycles, trend shifts, and key trading zones with precision. It combines trendline dynamics, normalized oscillators, and multi-timeframe confirmation into a single comprehensive indicator.
🔑 Key Features
NDOS (Normalized Dynamic Oscillator System):
Measures price strength relative to recent highs and lows to detect overbought, neutral, and oversold zones.
Dynamic Trendline (EMA8 or SMA231):
Flexible source selection for adapting to different trading styles (scalping vs. swing).
Multi-Timeframe H1 Confirmation:
Adds higher-timeframe validation to improve signal reliability.
Automated Buy & Sell Signals:
Triggered only on significant crossovers above/below defined levels.
Weekly Cycles (7-day M5 projection):
Tracks recurring time-based market cycles to anticipate reversal points.
Intuitive Visualization:
Colored zones (high, low, neutral) for quick market context.
Optional background and candlestick coloring for better clarity.
Multi-Timeframe Cross Table:
Automatically compares SMA50 vs. EMA200 across multiple timeframes (1m → 4h), showing clear status:
⭐️⬆️ UP = bullish trend confirmation
💀⬇️ Drop = bearish trend confirmation
📊 Built-in Statistical Tools
Normalized difference between short and long EMA.
Projected normalized mean levels plotted directly on the main chart.
Dynamic analysis of price distance from SMA50 to capture market “waves.”
🎯 Use Cases
Spot trend reversals with multi-timeframe confirmation.
Identify powerful breakout and breakdown zones.
Time entries and exits based on trend + cycle confluence.
Enhance market timing for swing trades, scalps, or long-term positions.
⚡ Swing Oracle Stock brings together cycle detection, oscillator normalization, and multi-timeframe confirmation into one streamlined indicator for traders who want a professional edge.

FlowScope [Hapharmonic]FlowScope: Uncover the Market's True Intent 🔬
Ever wished you could look inside the candles and see where the real action is happening? FlowScope is your microscope for the market's flow, designed to give you a powerful edge by revealing the volume distribution that price action alone can't show you.
Instead of just looking at the open, high, low, and close, FlowScope lets you dive deeper into the market's auction process. It groups candles together and builds a detailed Volume Profile for that period, showing you exactly where the trading happened and revealing the story behind the price action.
Let's explore how you can use it to gain a powerful new edge.
🧐 Core Concept: How It Works
At its heart, FlowScope does three key things:
It Groups Candles: You decide how many candles to group together. For example, setting " Group Candles " to 4 on a 5-minute chart effectively gives you a detailed 20-minute candle and profile. This helps you see the bigger picture and filter out market noise.
It Builds a Volume Profile: For each group, FlowScope analyzes the volume at every single price level. It then displays this as a horizontal histogram (we call this a "footprint" or profile). Longer bars mean more volume was traded at that price, indicating a "fair" price or an area of acceptance. Shorter bars mean price moved through quickly, indicating rejection.
It Creates a Custom "Grouped Candle": To summarize the group's overall price action, FlowScope draws a single, custom candle representing the entire group's:
Open: The open of the first candle in the group.
High: The absolute highest price reached within the group.
Low: The absolute lowest price reached within the group.
Close: The close of the last candle in the group.
This gives you a crystal-clear view of the group's net result, free from the back-and-forth noise of the individual candles inside it.
Below are some of the stunning preset color palettes you can choose from to customize your view:
🚀 How to Use: Practical Applications
FlowScope isn't just for looking pretty; it's a powerful analysis tool. Here are a few ways to integrate it into your trading:
Identify High-Volume Nodes (HVNs): Look for the longest bars in the profile. These are price levels where the market spent the most time and traded the most volume. HVNs often act as powerful "magnets" for price, becoming key areas of support and resistance.
Spot Low-Volume Nodes (LVNs): These are areas with very short bars or gaps in the profile. They represent price levels that the market moved through quickly and inefficiently. If price returns to an LVN, it's likely to move through it quickly again.
Analyze the Summary Box: This is where the real magic happens! ✨
Total Volume (Σ): The total volume for the entire group.
Buy (B) vs. Sell (S) Volume: FlowScope analyzes the lower timeframe action to estimate the buying and selling pressure that made up the total volume. Is a big red candle mostly aggressive selling, or was it just a lack of buyers? The B/S data gives you clues. A high-volume candle with nearly 50/50 buy/sell pressure might indicate absorption or a potential reversal.
Use the Grouped Candle for Clarity: Is the market in a clear uptrend, or is it just choppy? The grouped candle can give you a much clearer signal. A series of strong, green grouped candles shows much more conviction than a mix of small green and red candles.
⚙️ Settings & Customization
This is where you can truly make FlowScope your own. Let's walk through each setting.
Profile Settings
Group Candles: The number of standard chart candles you want to combine into a single FlowScope profile. A setting of 1 will analyze every single bar. A higher number gives you a broader market view. When Group Candles is set to 5, the data from the 5 individual candles are combined, and the volume is calculated accordingly.
Max Profile Boxes: This setting is more than just a number; it's a smart limit that ensures your profiles are always readable and relevant to the current market conditions.
Adaptive Sizing (The Ideal Goal): FlowScope first tries to create the perfect profile by making each volume box's height proportional to the current market volatility. It calculates an "ideal" box height based on the Average True Range ( ATR / 10 ). This is powerful because it automatically adapts: you get smaller, more detailed boxes in quiet, low-volatility markets, and larger, clearer boxes in volatile, fast-moving markets.
The Safety Cap (Your Setting): However, what if you group several candles during a massive price move? The price range could be huge! If we only used the small, ATR-based box height, you might end up with hundreds of tiny, unreadable boxes. This is where your Max Profile Boxes setting (defaulting to 50) comes in. It acts as a maximum detail cap . If the adaptive, volatility-based calculation determines that it would need more boxes than your setting (e.g., more than 50), the indicator will override it. It will then simply divide the entire price range of the group into exactly the number of boxes you specified (e.g., 50).
In short: You are setting the maximum allowable detail. FlowScope intelligently adapts the profile's granularity below that limit based on market volatility, ensuring you always get a clear and meaningful picture.
Style
Show Profile BG: A simple toggle to show or hide the faint background color behind the volume bars. Turning it off can create a cleaner look.
Color Mode: This dropdown controls how the volume profile text is colored.
Custom Gradient: This mode uses the three custom colors you select in the "Profile Colors" section to create a beautiful gradient across the profile.
Candle Color: This mode colors the profile based on whether the grouped candle was bullish (green) or bearish (red). The color will be a gradient, with the most intense color applied to the box with the highest volume; the colors of the other boxes will fade out from that point. It's a great way to see the profile's "mood" at a glance.
Profile Colors 🎨
Use Preset Palette: This is the master switch!
If checked: You can choose from 10 stunning, pre-designed color palettes from the Palette dropdown. The custom color pickers below will be disabled.
If unchecked (Default): The Palette dropdown will be disabled, and you can now choose your own three colors for the gradient.
Palette: (Only active when "Use Preset Palette" is checked) . Choose from 10 luxurious, eye-catching color schemes like "Solar Flare" or "Deep Space" to instantly change the look and feel of your chart.
Low Price / Mid Price / High Price: (Only active when "Use Preset Palette" is unchecked) . These three color pickers allow you to design your own unique gradient for the Custom Gradient color mode.
Candle Display
These settings control the custom "Grouped Candle" that summarizes the profile. When using the "Show Custom Candle" feature, you should change the chart's candlestick display to Bars for a cleaner view.
Show Custom Candle: This is the main toggle. When you check this box, the original chart candles will be hidden, and your custom FlowScope candle will be displayed instead. This custom candle is intentionally small to ensure it does not visually overlap with the volume profile boxes.
Show Body: (Only active when "Show Custom Candle" is checked) . Toggles the visibility of the candle's body.
Wick Width & Body Width: (Only active when "Show Custom Candle" is checked) . These sliders let you control the thickness of the wick and body lines to match your personal style.
Up Color / Down Color: (Only active when "Show Custom Candle" is checked) . Choose the colors for your bullish and bearish custom candles.
Experiment with the settings, find a style that works for you, and start seeing the market in a whole new light.
Happy trading! 📈😊

BTC/USD 3-Min Binary Prediction [v7.2 EN]BTC/USD 3-Minute Binary Prediction Indicator v7.2 - Complete Guide
Overview
This is an advanced technical analysis indicator designed for Bitcoin/USD binary options trading with 3-minute expiration times. The system aims for an 83% win rate by combining multiple analysis layers and pattern recognition.
How It Works
Core Prediction Logic
- Timeframe: Predicts whether BTC price will be ±$25 higher (HIGH) or lower (LOW) after 3 minutes
- Entry Signals: Generates HIGH/LOW signals when confidence exceeds threshold (default 75%)
- Verification: Automatically tracks and displays win/loss statistics in real-time
5-Layer Filter System
The indicator uses a sophisticated scoring system (0-100 points):
1. Trend Filter (25 points) - Analyzes EMA alignments and price momentum
2. Leading Indicators (25 points) - RSI and MACD divergence analysis
3. Volume Confirmation (20 points) - Detects unusual volume patterns
4. Support/Resistance (15 points) - Identifies key price levels
5. Momentum Alignment (15 points) - Measures acceleration and deceleration
Pattern Recognition
Automatically detects and visualizes:
- Double Tops/Bottoms - Reversal patterns
- Triangles - Ascending, descending, symmetrical
- Channels - Trending price channels
- Candlestick Patterns - Engulfing, hammer, hanging man
Multi-Timeframe Analysis
- Uses 1-minute and 5-minute data for confirmation
- Aligns multiple timeframes for higher probability trades
- Monitors trend consistency across timeframes
Key Features
Display Panels
1. Statistics Panel (Top Right)
- Overall win rate percentage
- Hourly performance (wins/losses)
- Daily performance
- Current system status
2. Analysis Panel (Left Side)
- Market trend analysis
- RSI status (overbought/oversold)
- Volume conditions
- Filter scores for each component
- Final HIGH/LOW/WAIT decision
Visual Signals
- Green Triangle (↑) = HIGH prediction
- Red Triangle (↓) = LOW prediction
- Yellow Background = Entry opportunity
- Blue Background = Waiting for result
Configuration Options
Basic Settings
- Range Width: Target price movement (default $50 = ±$25)
- Min Confidence: Minimum confidence to enter (default 75%)
- Max Daily Trades: Risk management limit (default 5)
Filters (Can be toggled on/off)
- Trend Filter
- Volume Confirmation
- Support/Resistance Filter
- Momentum Alignment
Display Options
- Show/hide signals, statistics, analysis
- Minimal Mode for cleaner charts
- EMA line visibility
Important Risk Warnings
Binary Options Trading Risks:
1. High Risk Product - Binary options are extremely risky and banned in many countries
2. Not Investment Advice - This tool is for educational/analytical purposes only
3. No Guaranteed Returns - Past performance doesn't predict future results
4. Capital at Risk - You can lose your entire investment in seconds
Technical Limitations:
- Requires stable internet connection
- Performance varies with market conditions
- High volatility can reduce accuracy
- Not suitable for news events or low liquidity periods
Best Practices
1. Paper Trade First - Test thoroughly on demo accounts
2. Risk Management - Never risk more than 1-2% per trade
3. Market Conditions - Works best in normal volatility conditions
4. Avoid Major Events - Don't trade during major news releases
5. Monitor Performance - Track your actual results vs displayed statistics
Setup Instructions
1. Add to TradingView chart (BTC/USD preferred)
2. Use 30-second or 1-minute chart timeframe
3. Adjust settings based on your risk tolerance
4. Monitor F-Score (should be >65 for entries)
5. Wait for clear HIGH/LOW signals with high confidence
Alert Configuration
The indicator provides three alert types:
- HIGH Signal alerts
- LOW Signal alerts
- General entry opportunity alerts
Legal Disclaimer
Binary options trading may not be legal in your jurisdiction. Many countries including the USA, Canada, and EU nations have restrictions or outright bans on binary options. Always check local regulations and consult with financial advisors before trading.
Remember: This is a technical analysis tool, not a money-printing machine. Successful trading requires discipline, risk management, and continuous learning. The displayed statistics are historical and don't guarantee future performance.

Lectura de VelasScript designed to display, on a panel as shown, the candlestick readings for Weekly, Daily, 4-hour, and 1-hour timeframes
Overlay Candles (Multi-TF, right side projection)This script overlays candles from a custom selectable timeframe (5m to 1M) on the right side of the chart as projections.
It helps visualize and compare the ongoing price action with the last higher-timeframe candles without switching chart intervals.
Features:
Choose timeframe for overlay candles (5m, 15m, 1H, 4H, 1D, 1W, 1M).
Adjustable number of candles to display (1–8).
Fixed candle width (in bars) and configurable gap between candles.
Custom colors for bullish and bearish candles.
Adjustable wick and border thickness (px).
Candle borders drawn with four lines to ensure visibility at all zoom levels.
Use cases:
Multi-timeframe price action analysis.
Visualizing higher-timeframe structure alongside lower-timeframe trading.
Educational / visual aid for understanding candlestick context.

High Minus LowThis indicator is a simple yet powerful tool for technical analysis. It measures the range of each candlestick by calculating the difference between its high and low, providing a direct visualization of market volatility.
Key Features:
Volatility at a Glance: The plot's height in the separate panel directly corresponds to the candle's trading range, allowing you to easily spot periods of high or low volatility.
Customizable Color: Easily change the line color to match your chart's theme and personal preferences.
Actionable Insights: Use this indicator to confirm periods of market consolidation before a breakout or to gauge the strength of a trend based on the expansion of candle ranges.

Real Close Overlay for Heiken AshiDescription:
The Real Close on Heiken Ashi indicator solves one of the biggest problems traders face when using Heiken Ashi candles, the fact that the displayed close is not the true market close.
By default, Heiken Ashi modifies the open, high, low, and close values to create smoother-looking candles. This makes them great for identifying trends, but it also means entries and exits can be misleading if you rely only on the chart.
This tool fixes that by overlaying the real closing price (traditional candlestick close) directly onto your Heiken Ashi chart.
How It Works:
- Plots the true closing price of each bar (from standard candles) onto your Heiken Ashi chart.
- Displays a small, unobtrusive marker (black dot by default) so you can instantly see where price actually closed. Not only does it plot the close, but it moves with real price as the candle is forming so price action is not lost.
- Updates in real time with every new bar.
Why It Matters:
- Use Heiken Ashi for trend clarity without losing price accuracy.
- Avoid entering/exiting based on inaccurate Heiken Ashi body closes.
- Improves stop-loss and take-profit placement by showing where price truly ended the candle.
- Essential for scalpers and short-term traders who need precision without losing true price action.
Best Uses:
- Combine with Heiken Ashi for momentum trading.
- Verify breakout confirmations against the real close.
- Use as an execution reference if you trade a HA-based system.
Disclaimer:
This script is for educational purposes only. It is open source and fully accessible. It does not provide financial advice. Always test thoroughly before applying to live markets.
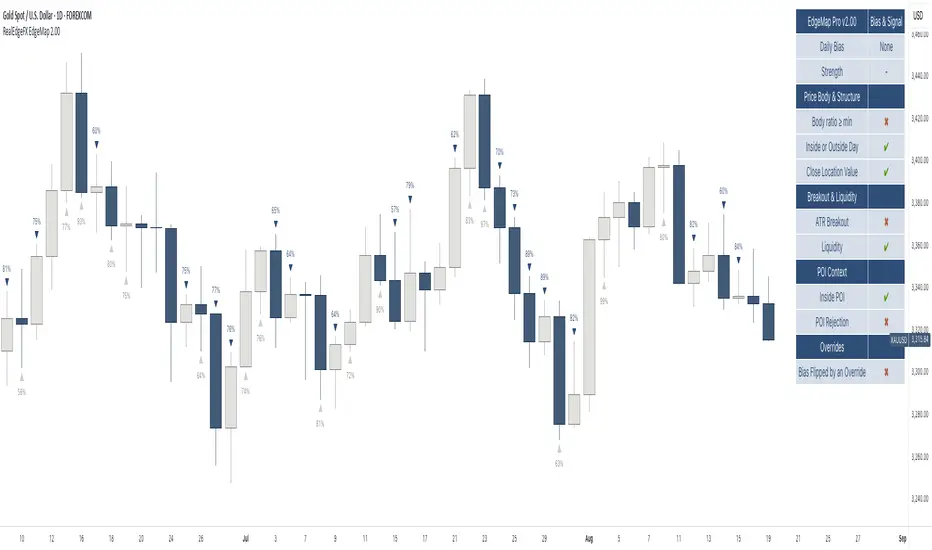
RealEdgeFX EdgeMap ProPresentation
RealEdgeFX EdgeMap Pro is built for systematic intraday decision-making. It combines a rule-based Daily Bias engine with an intraday (1-hour) regime engine based on medium timeframe engulfing (a structure change where a new directional run overwhelms the prior one). The study continuously evaluates candlestick behavior, session-level displacement, previous-day range interaction, and clearly defined points of interest (price areas left by sharp moves that often act as magnets or rejection zones). Intraday highs/lows inside an active regime are updated in real time on lower timeframes, so levels expand tick-by-tick when price makes new extremes.
Description
RealEdgeFX EdgeMap Pro is built on the idea that price alternates between contraction and expansion. Expansion begins when price drives in one direction with conviction. The study blends higher-timeframe daily context with a confirmed 1-hour structure shift called ME (Medium timeframe engulfing)—the moment a fresh run closes beyond the opening level that began the previous opposite run. From that confirmation forward, the active range’s high and low are maintained in real time on lower timeframes, expanding tick-by-tick whenever price prints new extremes. The tool also marks points of interest derived from zones where the price usually reacts following the 1h order flow context. Only the most relevant, side-aligned area is shown, and it is removed as soon as price trades decisively through it.
The engine outputs a Buy/Sell/Neutral stance and a 0–100 strength score. The definitive rules are the ones displayed in the on-chart table: the bias is produced when at least three of those criteria are active, or when a rule-based override flips the stance. Strength is calculated from the same table and increases with the number and intensity of active checks.
Tools
- Daily Bias & Strength (table-driven): Produces a Buy/Sell/Neutral bias and a 0–100 strength score for the day. The decision follows the rules shown in the on-chart table; the bias is set when at least three table criteria are active, or when a rule-based override flips it. Strength scales with how many checks are active and how strong they are.
- Medium-Timeframe Engulfing (ME) on 1-Hour: Detects a confirmed 1-hour structure shift when a new move closes beyond the opening price that started the prior opposite move. From that moment, the active range’s high/low is maintained in real time on lower timeframes, expanding tick-by-tick as new extremes print. A 1-hour close through the invalidation clears the ME and its dependents.
- Points of Interest (POI): Marks areas created by a distinct three-candle move on the 1-hour chart where the middle bar’s range does not overlap the bar from two candles earlier, or the initial candle that produces the Medium-Timeframe Engulfing. Only POIs formed after the current ME begins and lying inside the active ME range are eligible. Overlapping same-side areas merge; only the nearest, side-aligned POI is shown and it is removed once price trades decisively through it.
- ME-Based Fibonacci Levels: Draws three live reference lines tied to the active ME range—100% at the active extreme, 50% at the midpoint, and 0% at the opposite extreme. These levels extend forward, update in real time as the ME range grows, and hide automatically when no valid ME is active.
- Intraday Visuals: On the first bar of each new trading day (on intraday charts), prints an up/down arrow reflecting the current Daily Bias and a clean text label with its strength. Sizes and colors are configurable to keep the chart readable.
- On-Chart Diagnostic Table: Displays the exact rules used to build the Daily Bias and Strength, broken down by sections (Price Body & Structure, Breakout & Liquidity, POI Context, Overrides). A check mark means the criterion is currently contributing; this table is the single source of truth for the engine’s decisions.
What can you customize?
- ME Level & Label (Medium-Timeframe Engulfing): Choose line style (solid, dashed, dotted), line width, and separate colors for bullish and bearish levels. Set the label text (e.g., “ME”), its color, and size. Control how far the line/label project forward in time. Once a 1-hour close invalidates the setup, the ME line and label are removed automatically, keeping the view clean.
- POI Areas (Points of Interest): Toggle on/off. Pick separate fill colors for bullish/bearish areas, adjust transparency, and set border color, width, and style. Define how far each area extends forward. Only the most relevant, side-aligned area is shown; when price closes decisively through it, the box is cleared to avoid clutter.
- ME-Based Fibonacci Levels (100/50/0): Toggle the three reference lines, and customize each level’s color, width, and style. Turn labels on/off and set label text size and color. Control forward extension so levels project the way you prefer. Levels auto-update in real time as the ME range expands and hide when no valid ME is active.
- Intraday Day-Change Arrows & Strength Labels: Select arrow size (Tiny, Small, Normal, Large) and separate colors for buy/sell arrows. Choose text color and size for the strength percentage, also separated for buy/sell. Control the history window (how many past days’ arrows/labels remain visible) to keep the chart minimal or more informative.
- Diagnostics Table (Daily Bias & Strength): Toggle the table on/off and place it in any corner (top/bottom, left/right). Customize header background/text colors, row background/text colors, and the colors used for Buy/Sell/Neutral states. Set border width and overall text size to match your chart theme.
- Forward Extensions & History Windows: Independently control how far ME lines, POI boxes, and ME-Fibonacci levels extend into the future, and how much intraday arrow/label history is kept. These controls let you balance context vs. cleanliness on any timeframe.
How to use properly
- Add RealEdgeFX EdgeMap Pro to any TradingView symbol and timeframe.
- For execution, use intraday charts (e.g., 1–15 minutes).
- The study pulls its higher-timeframe context from the Daily and confirms structure on the 1-hour engine.
Originality & value
This study is not a mashup; it integrates a daily rule engine with a 1-hour regime detector that maintains live extremes on lower timeframes and a single, side-aligned point-of-interest filter with merging/invalidations. The combination produces a table-audited bias and strength built from measurable, configurable checks rather than generic overlays.
Terms and Conditions
Purpose and no advice. These charting tools are provided for informational and educational purposes only. They do not predict markets or provide financial, investment, or trading advice. Past performance is not indicative of future results.
User responsibility and liability. By using these tools, you agree that all decisions and outcomes are your sole responsibility. RealEdgeFX EdgeMap Pro and its creator(s) are not liable for any losses or consequences arising from the use of these products. You agree to indemnify and hold RealEdgeFX EdgeMap Pro harmless from any claims related to your use.
Access and use. Access may be granted via TradingView invite and requires an active subscription. Access is personal and non-transferable. Sharing, reselling, redistributing, copying, decompiling, or attempting to reverse engineer the code is prohibited. Access may be suspended or revoked for violations of these terms or platform policies.
Subscriptions, discounts, and cancellation. If you receive access through a Friends & Family program or use a discount code, the discount applies only to the first purchase or first billing cycle unless explicitly stated otherwise. You are solely responsible for canceling—or requesting cancellation of—your subscription if you do not wish to continue after the discounted period and/or at full price.
Refund policy. No reimbursements, refunds, or chargebacks are provided, to the maximum extent permitted by law.
Acceptance and updates. By continuing to use these tools, you acknowledge and agree to these Terms and Conditions. RealEdgeFX EdgeMap Pro may update these terms from time to time; continued use after updates constitutes acceptance of the revised terms.