Ori Bitcoin ComparisonDraws candlestick data of BTCUSD for better comparisons. Blue and Purple candles belongs to script , green and red ones belongs to original graphic.
Search in scripts for "Candlestick"

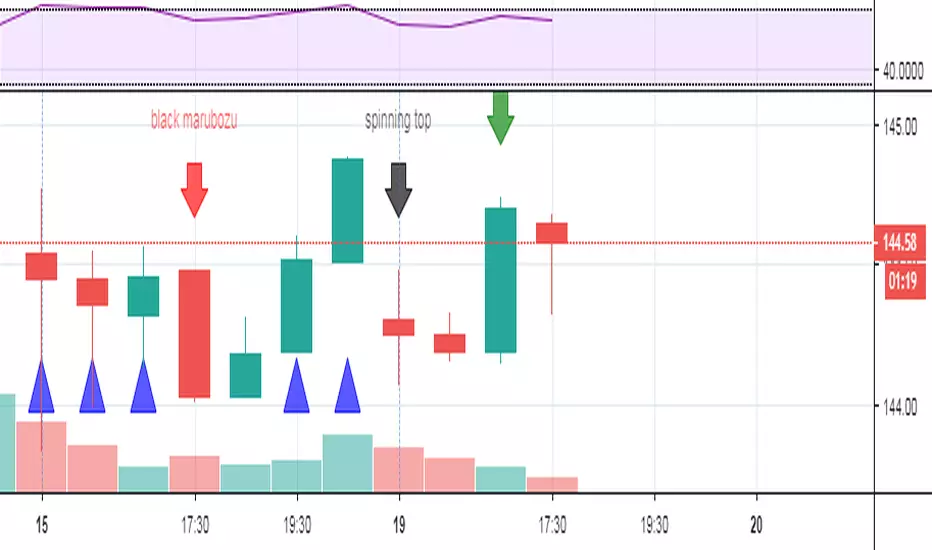
Candlestick identificationThis is a first draft of a candlestick pattern recognition study. As of now individual candles and some two-candle patterns can be identified. More to come ...
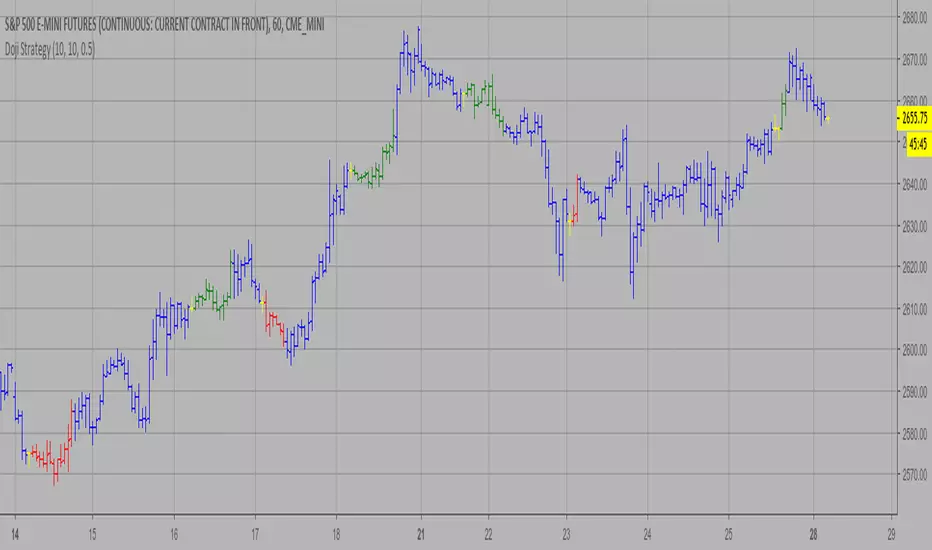
Doji Strategy This is a candlestick where the open and close are the same.
WARNING:
- This script to change bars colors.
BlockGain Candlestick for Scalping VER. 1.2This is a new tool for scalping with candleskick and EMAS .... show signals for buy and sell

Multi Moving Average by Cbgbm788フィボナッチと移動平均線(MMA)を組合わせたくて作りました。試作品です。
直近200barに対する高値安値とそのフィボナッチ0.618、0.382でざっくりと現在地を確認します。
ロウソク足とMMAでトレンドとエントリーとイグジットのタイミングを確認します。
【google translate】
I made it to combine Fibonacci and moving average line (MMA). It is a prototype.
We will check your current location roughly with the high price low against the last 200 bar and its Fibonacci 0.618, 0.382.
Candlestick and MMA will check the timing of trends, entries and exits.

HDW open_close上位時間軸のロウソク足を表示したくて、それに代わるものが見つからなかったので作ってみました。
1時間足、日足、週足の 始値 と 終値 をラインで表示するものです。
ヒゲの部分は作っていません。実体を見て判断します。
【Google translate】
I wanted to display the candlestick on the upper time axis, so I could not find an alternative to it, so I made it.
It displays the start value and closing price of 1 hour foot, daily stick, weekly leg with a line.
The Lie Detector [LucF]Sometimes the simplest things turn out to be surprisingly useful.
Wyckoff's second law of cause and effect implies that price movement (up or down) should be proportional to the effort (volume) supplied. Price is not subject to gravity; without volume it cannot move.
This one-line indicator acts a bit like a lie detector for price action.
It simply identifies bars with decreasing volume, the idea being that movement on a bar where volume has decreased is considered suspicious.
Falling volume accompanied by much price movement is more suspicious than it is on bars with less movement.
Pure luck would have it that the varying size of the candlestick bodies provides an easy way to visually grasp the degree of suspiciousness their movement should be considered with because it is directly proportional to the body's size. Large, empty bodies are more suspicious than small ones.
Taking things from the opposite perspective, this indicator reveals the more meaningful candles on your chart, the ones telling the truth, since their color is not changed if they are accompanied by rising volume.

Heikin Ashi Historical TF Developmental BarsAn improvement to the built-in security(heikinashi()...) method, this indicator plots Heikin Ashi (HA) candles for an input timeframe (TF) on an underlying regular candlestick chart of a shorter TF. The improvement is that it plots the value of each in-development HA bar as it would have appeared while still repainting, for each underlying chart bar. The last chart bar of each TF matches the value available from security() calls and from HA charts directly.
For best results, be sure to use a HA TF greater than chart TF (I prefer 1 minute unless longer history is required).
1 hour HA on 1 minute underlying price chart
4 hour HA on 1 minute underlying price chart
V3: Release.

420_Jpn_PatternsMy first iteration of a script that ID's japanese candlestick patterns including:
bullish_engulfing www.investopedia.com
bearish_engulfing www.investopedia.com
bullish_harami www.investopedia.com
bearish_harami www.investopedia.com
piercing_line (bullish) www.investopedia.com
dark_cloud_cover (bearish) www.investopedia.com
morning_star (bullish) www.investopedia.com
evening_star (bearish) www.investopedia.com
bullish_belt www.investopedia.com
bearish_belt www.investopedia.com
aka_sanpei (bullish) www.investopedia.com
sanba_garasu (bearish) www.investopedia.com
three_stars_south (bullish) www.investopedia.com
stick_sandwich www.investopedia.com
bullish_meeting_line www.thepatternsite.com
bearish_meeting_line www.thepatternsite.com
bullish_kicking www.thepatternsite.com
bearish_kicking thepatternsite.com
ladder_bottom (bullish) www.thepatternsite.com
inverted_hammer www.thepatternsite.com
shooting_star www.thepatternsite.com www.thepatternsite.com
hanging_man (bearish) www.thepatternsite.com
hammer (bullish) www.thepatternsite.com
xoxo
sn00p

Candlestick SizeThis indicator shows:
Candlestick Range (H-L)
Body Range (O-C)
O-L Range
O-H Range
C-L Range
C-H Range
(absolute value in pips)

Bullish and Bearish Engulfing Patterns auto detectionThis simple indicator detects automatically most important bullish and bearish candlestick patterns formations. Used to locate potential supply and demand imbalances.
Copyright 2017 Alfonso Moreno www.set-and-forget.com


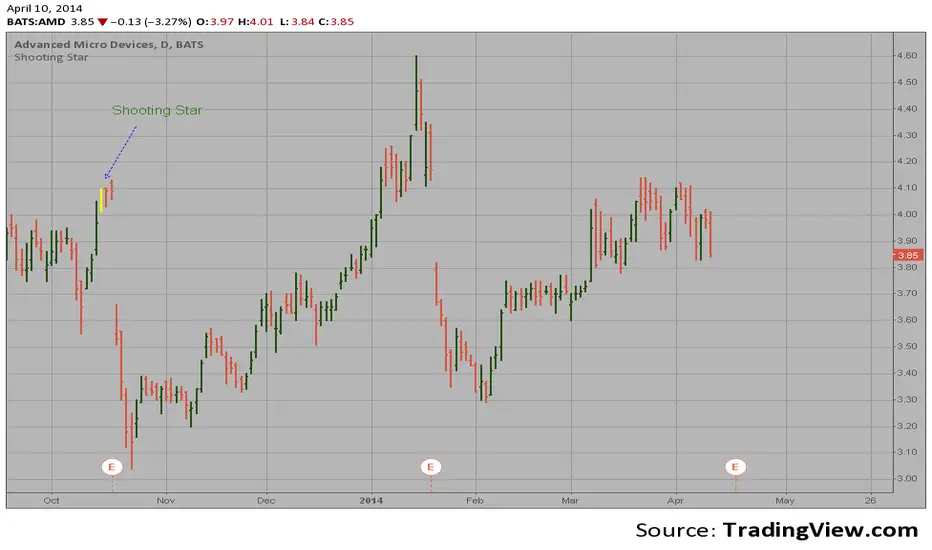
Shooting Star automatic finding scriptHi
Let me introduce my Shooting Star automatic finding script.
This is a bearish reversal candlestick which occurs in an uptrend. It has a long
upper shadow with little, or no lower shadow, and a small real body near the lows
of the session.
Dekidaka-Ashi - Candles And Volume Teaming Up (Again)The introduction of candlestick methods for market price data visualization might be one of the most important events in the history of technical analysis, as it totally changed the way to see a trading chart. Candlestick charts are extremely efficient, as they allow the trader to visualize the opening, high, low and closing price (OHLC) each at the same time, something impossible with a traditional line chart. Candlesticks are also cleaner than bars charts and make a more efficient use of space. Japanese peoples are always better than everyone at an incredible amount of stuff, look at what they made, the candlesticks/renko/kagi/heikin-ashi charts, the Ichimoku, manga, ecchi...
However classical candlesticks only include historical market price data, and won't include other type of data such as volume, which is considered by many investors a key information toward effective financial forecasting as volume is an indicator of trading activity. In order to tackle to this problem solutions where proposed, the most common one being to adapt the width of the candle based on the amount of volume, this method is the most commonly accepted one when it comes to visualizing both volume and OHLC data using candlesticks.
Now why proposing an additional tool for volume data visualization ? Because the classical width approach don't provide usable data regarding volume (as the width is directly related to the volume data). Therefore a new trading tool based on candlesticks that allow the trader to gain access to information about the volume is proposed. The approach is based on rescaling the volume directly to the price without the direct use of user settings. We will also see that this tool allow to create support and resistances as well as providing signals based on a breakout methodology.
Dekidaka-Ashi - Kakatte Koi Yo!
"Dekidaka" (出来高) mean "Volume" in a financial context, while "Ashi" (足) mean "leg" or "bar". In general methods based on candlesticks will have "Ashi" in their name.
Now that the name of the indicator has been explained lets see how it works, the indicator should be overlayed directly to a candlestick chart. The proposed method don't alter the shape of the candlesticks and allow to visualize any information given by the candles. As you can see on the figure below the candle body of the proposed tool only return the border of the candle, this allow to show the high/low wick of the candle.
The body size of the candle is based on two things : the absolute close/open difference, and the volume, if the absolute close/open difference is high and the volume is high then the body of the candle will be clearly visible, if the volume is high but the absolute close/open difference is low, then the body will be less visible. This approach is used because of the rescaling method used, the volume is divided by the sum between the current volume value and the precedent volume value, this rescale the volume in a (0,1) range, this result is multiplied by the absolute close/open difference and added/subtracted to the high/low price. The original approach was based on normalization using the rolling maximum, but this approach would have led to repainting.
You have access to certain settings that can help you obtain a better visualization, the first one being the body size setting, with higher values increasing the body amplitude.
In green body with size 2, in red with size 1. The smooth parameter will smooth the volume data before being used, this allow to create more visible bodies.
Here smooth = 100.
Making Bands From The Dekidaka-Ashi
This tool is made so it output two rescaled volume values, with the highest value being denoted as "Dekidaka-high" and the lowest one as "Dekidaka-low". In order to get bands we must use two moving averages, one using the Dekidaka-high as input and the other one using Dekidaka-low, the body size parameter should be fairly high, therefore i will hide the tool as it could cause trouble visualizing the bands.
Bands with both MA's of period 20 and the body size equal to 20. Larger periods of the MA's will require a larger amount of body size.
Breakout Signals
There is a wide variety of signals that can be made from candles, ones i personally like comes from the HA candles. The proposed tool is no exception and can produce a wide variety of signals. The signals generated are basic ones based on a breakout methodology, here is each signal with their associated label :
Strong Bullish signal "⇈" : The high price cross the Dekidaka-high and the closing price is greater than the opening price
Strong Bearish signal "⇊" : The low price cross the Dekidaka-low and the closing price is lower than the opening price
Weak Bullish signal "↑" : The high price cross the Dekidaka-high and the closing price is lower than the opening price
Weak Bearish signal "↓" : The low price cross the Dekidaka-low and the closing price is greater than the opening price
Uncertain "↕" : The high price cross the Dekidaka-high and the low price cross the the Dekidaka-low
In order to see the signals on the chart check the "Show signals" option. Note that such signals are not based on an advanced study, and even if they are based on a breakout methodology we can see that volatile movement rarely produce signals, therefore signals mostly occur during low volume/volatility periods, which isn't necessarily a great thing.
Conclusion
A trading tool based on candlesticks that aim to include volume information has been presented and a brief methodology has been introduced. A study of the signals generated is required, however i'am not confident at all on their accuracy, i could work on that in the future. We have also seen how to make bands from the tool.
Candlesticks remain a beautiful charting technique that can provide an enormous amount of information to the trader, and even if the accuracy of patterns based on candlesticks is subject to debates, we can all agree that candlesticks will remain the most widely used type of financial chart.
On a side note i mostly use a dark color for a bullish candle, and a light gray for a bearish candle, with the border color being of the same color as the bullish candle. This is in my opinion the best setup for a candlestick chart, as candles using the traditional green/red can kill the eyes and because this setup allow to apply a wide variety of colors to the plot of overlayed indicators without the fear of causing conflict with the candles color.
Thanks for reading ! :3 Nya
A Word
This morning i received some hateful messages on twitter, the users behind them certainly coming from tradingview, so lets be clear, i know i'am not the most liked person in this community, i know that perfectly, but no one merit to be receive hateful messages. I'am not responsible for the losses of peoples using my indicators, nor is tradingview, using technical indicators does not guarantee long term returns, your ability to be profitable will mostly be based on the quality and quantity of knowledge you have.

ADX Momentum Shaded CandlesDescription:
The "ADX Momentum Shaded Candles" indicator (ADXMSC) is an overlay indicator that enhances candlestick charts by adding shading based on the momentum derived from the Average Directional Index (ADX). This indicator provides visual cues about the strength of bullish and bearish momentum by adjusting the transparency of the candlesticks.
How it Works:
The indicator utilizes the ADX indicator to calculate the values of +DI (Directional Indicator Plus) and -DI (Directional Indicator Minus) based on user-defined parameters. It then determines the transparency levels for the bullish and bearish candlesticks based on the calculated values of +DI and -DI. Higher values of +DI or -DI result in lower transparency levels, while lower values increase transparency.
Transparency Calculation:
The transparency of the bullish and bearish candlesticks is adjusted based on the values of +DI and -DI, which reflect the momentum of the price movement. Transparency is inversely proportional to these values, with higher values resulting in lower transparency. To calculate transparency, the indicator uses the formula 100 minus the value of +DI or -DI multiplied by 2. This ensures that higher values of +DI or -DI produce more opaque candlesticks.
Usage:
To effectively use the "ADX Momentum Shaded Candles" indicator (ADXMSC), follow these steps:
1. Apply the indicator to your chart by adding it from the available indicators.
2. Observe the candlesticks on the chart:
- Bullish candlesticks are represented by the original bullish color with adjusted transparency.
- Bearish candlesticks are represented by the original bearish color with adjusted transparency.
3. Analyze the transparency levels of the candlesticks to assess the strength of bullish and bearish momentum. Less transparent candlesticks indicate stronger momentum, while more transparent ones suggest weaker momentum.
4. Combine the visual information from the shaded candlesticks with other technical analysis tools, such as support and resistance levels, trend lines, or oscillators, to confirm potential trade opportunities.
5. Customize the indicator's parameters, such as the ADX length and smoothing, to suit your trading preferences.
6. Implement appropriate risk management strategies, including setting stop-loss orders and position sizing, to manage your trades effectively and protect your capital.

Price Action Color Forecast (Expo)█ Overview
The Price Action Color Forecast Indicator , is an innovative trading tool that uses the power of historical price action and candlestick patterns to predict potential future market movements. By analyzing the colors of the candlesticks and identifying specific price action events, this indicator provides traders with valuable insights into future market behavior based on past performance.
█ Calculations
The Price Action Color Forecast Indicator systematically analyzes historical price action events based on the colors of the candlesticks. Upon identifying a current price action coloring event, the indicator searches through its past data to find similar patterns that have happened before. By examining these past events and their outcomes, the indicator projects potential future price movements, offering traders valuable insights into how the market might react to the current price action event.
The indicator prioritizes the analysis of the most recent candlesticks before methodically progressing toward earlier data. This approach ensures that the generated candle forecast is based on the latest market dynamics.
The core functionality of the Price Action Color Forecast Indicator:
Analyzing historical price action events based on the colors of the candlesticks.
Identifying similar events from the past that correspond to the current price action coloring event.
Projecting potential future price action based on the outcomes of past similar events.
█ Example
In this example, we can see that the current price action pattern matches with a similar historical price action pattern that shares the same characteristics regarding candle coloring. The historical outcome is then projected into the future. This helps traders to understand how the past pattern evolved over time.
█ How to use
The indicator provides traders with valuable insights into how the market might react to the current price action event by examining similar historical patterns and projecting potential future price movements.
█ Settings
Candle series
The candle lookback length refers to the number of bars, starting from the current one, that will be examined in order to find a similar event in the past.
Forecast Candles
Number of candles to project into the future.
-----------------
Disclaimer
The information contained in my Scripts/Indicators/Ideas/Algos/Systems does not constitute financial advice or a solicitation to buy or sell any securities of any type. I will not accept liability for any loss or damage, including without limitation any loss of profit, which may arise directly or indirectly from the use of or reliance on such information.
All investments involve risk, and the past performance of a security, industry, sector, market, financial product, trading strategy, backtest, or individual's trading does not guarantee future results or returns. Investors are fully responsible for any investment decisions they make. Such decisions should be based solely on an evaluation of their financial circumstances, investment objectives, risk tolerance, and liquidity needs.
My Scripts/Indicators/Ideas/Algos/Systems are only for educational purposes!
