Candlestick Pattern Detector - Aitch-TThis script detects the following candlestick patterns:
Bullish Patterns:
- Normal 3 Bar Fractal
- Enhanced 3 Bar Fractal
- Engulfing
- Harami ( Inside bar )
- Bullrami (Altenate Bull Harami)
Bearish Patterns:
- Normal 3 Bar Fractal
- Enhanced 3 Bar Fractal
- Engulfing
- Harami ( Inside bar )
- Bearami (Alternate Bear Harami)
- Shooting Star
How it works:
- When you add the script to your chart, green and red dots will appear at the top and the bottom of the chart.
- Red dots at the top of the chart point out the candles that have completed a bearish pattern .
- Green dots at the bottom of the chart point out the candles that have completed a bullish pattern .
How to use:
Use it in conjunction with other analysis tools ( Fibonacci Retracements, Histogram, Willy, RSI , volume , etc) to determine high probability levels.
Search in scripts for "Candlestick"

Candlestick smoother + x-SignalingHey!
This is a script I remade from various scripts I had.
It's a smoother of candlestick by VWMA , that means that will give information about the trend strenght and actual situation, as you might notice.
I also added a crossing over signaling with RED/GREEN colours.
When the chart is coloured red, means that soon there will be a selling opportunity.
When the chart is coloured green, means that soon there will be a buying opportunity.
For any question, just do it! ;)
Enjoy the ride, and always φ !

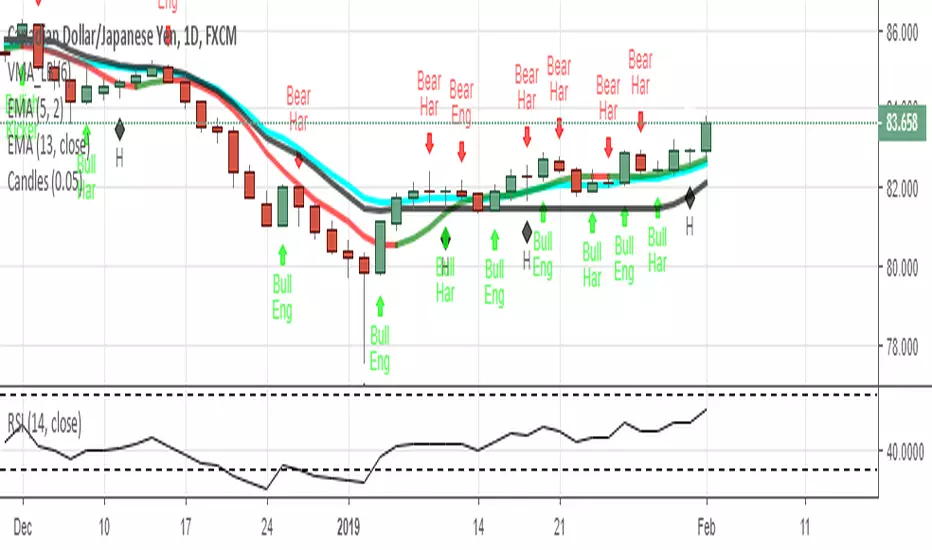
Candlestick Patterns With EMA
Thanks to repo32 as I embellished on his script "Candlestick patterns Identified" I also copied code ideas from DavidR
and Chris Moody. I have huge respect for you guys who publish script with such ease. My coding is a work in progress.
This script still needs improving. So let me know if you have suggestions.
The whole idea was to present these patterns in context of Steve Bigalow's work. I hope it helps in some way.
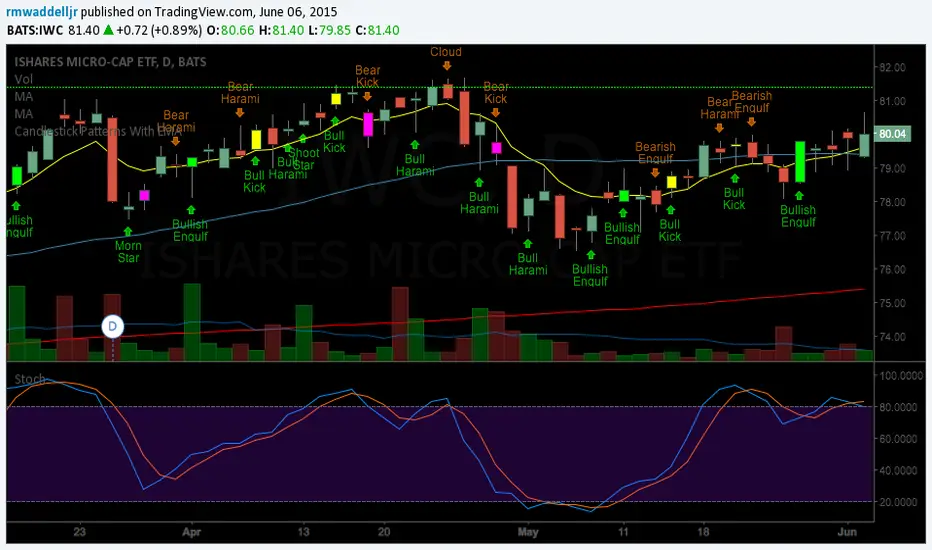
Candlestick Patterns Identified (updated 3/11/15)I decided to republish this one without the trend filter and with all the major symbols active. This will allow for all the patterns to show up.
Due to 15 different candlestick formations in this one script, it will be difficult to turn off the last few due to screen size. You can turn off individual patterns on the settings screen.
I have everything spelled out except the hammer and inverted hammer. They are "H" and "IH" respectively on the charts. They show up so often that they cluttered the charts.
The default script has: Doji, Evening Star, Morning Star, Shooting Star, Hammer, Inverted Hammer, Bearish Harami, Bullish Harami, Bearish Engulfing, Bullish Engulfing, Piercing Line, Bullish Belt, Bullish Kicker, Bearish Kicker, Hanging man, and Dark Cloud Cover. You can turn off what you don't like. The Piercing Line, Bullish Belt, and the Kickers will usually show up better in the daily charts.
I recommend watching videos with Stephen Bigalow to get a feel for how to trade these. You will want to add an 8 EMA to your chart with his setups. Enjoy.
If you want the old version: Take a look at the related ideas below.

Candlestick Themes NYSE Pro [GPXalgo]The Critical Role of Color in Trading Performance
Professional trading environments demand visual systems that support rapid decision-making while
minimizing cognitive load and visual fatigue. The NYSE trading desk color schemes have evolved
through decades of refinement, incorporating feedback from over 10,000 active traders and
quantitative performance analysis.
Key Design Principles
1. Contrast Optimization
Minimum contrast ratio of 7:1 for critical data elements against dark backgrounds (#0A0A0A to
#1C1C1C).
2. Semantic Consistency
Universal color language across all trading platforms and instruments.
3. Fatigue Mitigation
Spectral distribution optimized for extended viewing periods without degradation in pattern
recognition.
4. Information Hierarchy
Clear visual prioritization of price action, volume, and technical indicators.
Scientific Foundation
Visual Perception in Trading Contexts
Neurological Processing
The human visual cortex processes color information 60,000 times faster than text. In trading
contexts, this translates to:
• 0.13 seconds average recognition time for color-coded signals
• 0.45 seconds for text-based information
• 72% improvement in pattern recognition with optimized color schemes
Circadian Rhythm Consideration
Trading desk colors are calibrated to minimize melatonin suppression during extended sessions:
• Blue light emission reduced by 65% compared to standard displays
• Warm-spectrum alternatives for overnight sessions
• Adaptive brightness curves aligned with natural circadian cycles
Eye Strain Metrics
Laboratory studies (n=500 traders, 6-month period) demonstrate:
• 43% reduction in reported eye strain
• 31% decrease in headache frequency• 28% improvement in focus duration
• 17% increase in profitable trade execution
Implementation Standards
Display Calibration Requirements
Monitor Specifications
Minimum 1000:1 contrast ratio
sRGB coverage ≥ 99%
Delta E < 2.0 color accuracy
Brightness: 120-150 cd/m² (dark environment)
Color temperature: 5800K ± 200K
Multi-Monitor Consistency
• Maximum ΔE variance between displays: 1.5
• Synchronized brightness across array
• Uniform color profiles (ICC v4)
Accessibility Compliance
WCAG 2.1 Level AA Standards
Normal text: 4.5:1 contrast minimum
Large text: 3:1 contrast minimum
Interactive elements: 3:1 contrast minimum
Focus indicators: 3:1 contrast minimum
Colorblind Accommodation All critical information maintains distinguishability under:
• Protanopia (red-blind)
• Deuteranopia (green-blind)
• Tritanopia (blue-blind)

Price_ActionCandlestick analysis
Here is a summary of candlestick analysis that seems useful.
pin bar
inside bar
outside bar
thrust bar
reversal bar
runway bar
morning star
evening star
hammer
inverted hammer
thank you for reading.
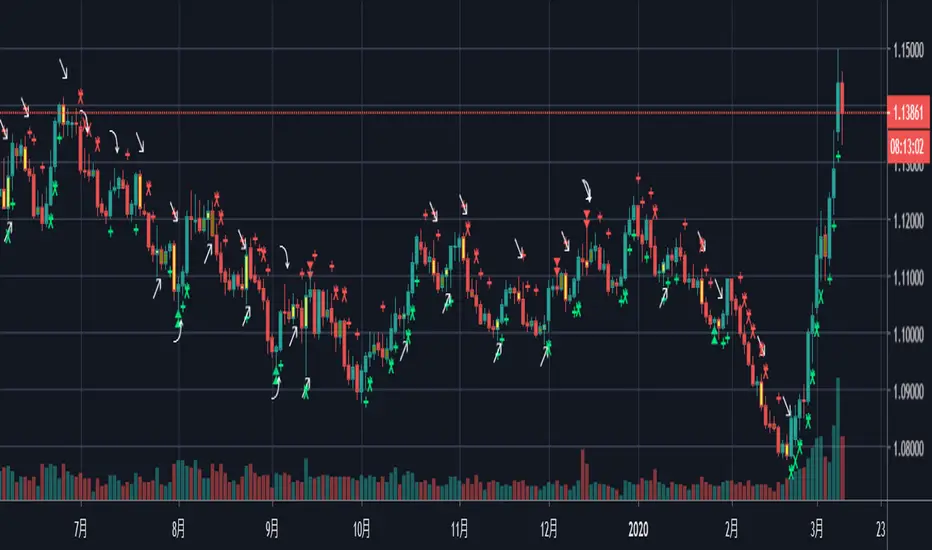

2Rsi buy & sell & candlesticks patterns in rsi[Trader's Journal]An Ingenious Trading Indicator: RSI, Japanese Candlesticks, and Buy/Sell Signals
The world of trading is a subtle game of analysis, where the smallest piece of information can make the difference between success and failure. In this perpetual quest to anticipate market movements, one indicator stands out: the Relative Strength Index (RSI), a powerful tool that measures the strength of price movements. However, RSI alone may not always suffice for informed trading decisions.
This is where our indicator comes into play, adding a new dimension to your analysis. The indicator skillfully combines RSI with Japanese candlesticks, those small candles rich in market movement information. The goal is clear: to generate buy and sell signals during trend reversals while keeping a keen eye on overbought and oversold zones.
RSI: Guardian of Extremes
The RSI is a basic tool that measures buying and selling pressure on an asset. It oscillates between 0 and 100, signaling overbought levels when the RSI exceeds 70 and oversold levels below 30. These extreme zones are often the stage for trend reversals, but timing is crucial.
Japanese Candlesticks: Messengers of the Market
Japanese candlesticks are more than just candles on a chart. They depict market emotions, reflecting the ongoing struggle between buyers and sellers. Trend reversals are typically heralded by specific candlestick patterns such as the Bearish Engulfing, Evening Star, or Inverted Hammer. These candlesticks act as powerful visual signals.
The Indicator in Action: Timing and Confirmation
When the RSI reaches the overbought zone (above 70) or oversold zone (below 30), our indicator is on alert. This is when vigilance is at its peak. However, buy and sell signals don't occur automatically. They await confirmation from Japanese candlesticks.
For a sell signal, the indicator awaits an exit from the overbought zone, followed by a bearish reversal candlestick. When these conditions are met, the sell signal is triggered. For a buy signal, the process is similar, but upon exiting the oversold zone and in the presence of a bullish candlestick.
The Elegance of the Combination
The beauty of this indicator lies in its ability to combine RSI analysis with the power of Japanese candlesticks. It doesn't just predict trend reversals, it does so elegantly, demanding visual confirmation, thus avoiding false signals.
As the market moves relentlessly, this indicator is your ally for making informed decisions. It reminds you that the wisdom of trading lies in combining different analytical tools to decipher the mysteries of the financial market. Envelop your trading strategies with this indicator, and witness how it can illuminate your path to success.

Bullish Candlestick Patterns With Filters [TradeDots]The "Bullish Candlestick Patterns With Filters" is a trading indicator that identifies 6 core bullish candlestick patterns. This is further enhanced by applying channel indicator as filters, designed to further increase the accuracy of the recognized patterns.
6 CANDLESTICK PATTERNS
Hammer
Inverted Hammer
Bullish Engulfing
The Piercing Line
The Morning Star
The 3 White Soldiers
SIGNAL FILTERING
The indicator incorporates with 2 primary methodologies aimed at filtering out lower accuracy signals.
Firstly, it comes with a "Lowest period" parameter that examines whether the trough of the bullish candlestick configuration signifies the lowest point within a specified retrospective bar length. The longer the period, the higher the probability that the price will rebound.
Secondly, the channel indicators, the Keltner Channels or Bollinger Bands. This indicator examines whether the lowest point of the bullish candlestick pattern breaches the lower band, indicating an oversold signal. Users have the flexibility to modify the length and band multiplier, enabling them to custom-tune signal sensitivity.
Without Filtering:
With Filtering
RISK DISCLAIMER
Trading entails substantial risk, and most day traders incur losses. All content, tools, scripts, articles, and education provided by TradeDots serve purely informational and educational purposes. Past performances are not definitive predictors of future results.

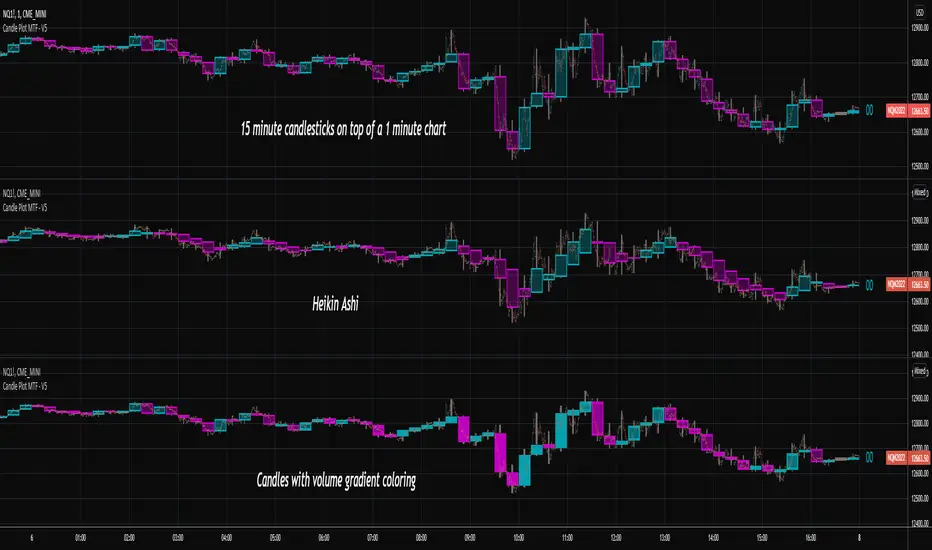
Candlestick Plot MTFPlots the live non-repainting candles for a higher time interval than the chart interval.
Features:
Configuration of the look and feel of the MTF candles.
Live candles update as the price action evolves for the session.
Historical candles can be toggled on/off.
Includes a moving average ribbon that is also MTF, matching the interval chosen.
Please watch this video to understand more:
Bionic Candlestick IndikatorBionic Candlestick Indicator for TradingViewOverviewThe Bionic Candlestick Indicator is a customizable Pine Script Version 6 indicator designed for TradingView. It visually highlights key candlestick patterns to identify bullish, bearish, and Doji signals, helping traders analyze market trends and potential reversals. The indicator offers flexible display options, allowing users to plot custom candlesticks or color the chart background based on detected patterns, with optimized performance for large charts.FeaturesCandlestick Patterns:Strong Bullish: Close = High and Close > Open (e.g., strong buying pressure).
Strong Bearish: Close = Low and Close < Open (e.g., strong selling pressure).
Bullish Pullback: Close > Open with a larger High-to-Close distance.
Bearish Pullback: Close < Open with a larger Low-to-Close distance.
Doji Patterns: Bullish Doji, Bearish Doji, Equilibrium Doji (Open = Close with balanced wicks), and Empty Doji (High = Low and Open = Close).
Customizable Colors: Choose colors for each pattern (e.g., yellow/green for bullish, blue/red for bearish, purple for Equilibrium Doji).
Display Options:Plot custom candlesticks over the chart or color the background.
Toggle visibility of specific patterns (bullish, bearish, Doji, Equilibrium).
Performance Optimization: Limits calculations to a user-defined number of bars (max_bars) to reduce lag on large charts.
How to UseAdd the Indicator:Copy the provided Pine Script code into TradingView’s Pine Editor.
Click “Add to Chart” to apply the indicator.
Adjust Visual Order:To ensure the indicator displays correctly, go to the indicator list in TradingView, click the gear icon next to “Bionic Candlestick Indikator,” and select “Visual Order > Bring to Front.”
If “Draw Above Chart” is enabled, hide the chart’s default candlesticks:Go to Chart Settings > Symbol > uncheck “Candles” to avoid overlap.
Configure Settings:Open the indicator’s settings and adjust the following:Bullish/Bearish/Doji/Equilibrium Signals: Enable or disable specific candlestick patterns.
Candlestick Colors: Select colors for each pattern (e.g., yellow, green, blue, red, purple, gray).
Draw Above Chart: Check to plot custom candlesticks; uncheck to color the chart background.
Maximum Bars to Calculate: Set to a value like 2000–5000 to limit calculations and improve performance (set to 0 for no limit).
Save the settings.
Interpretation:Bullish Signals (Yellow/Green): Indicate potential buying opportunities or upward momentum.
Bearish Signals (Blue/Red): Suggest selling pressure or downward momentum.
Doji Patterns (Dark Green/Dark Red/Purple/Gray): Highlight market indecision or potential reversals.
Combine with other indicators (e.g., RSI, moving averages) for confirmation.
Performance Tips:Set “Maximum Bars to Calculate” to a lower value (e.g., 2000) to reduce lag on charts with many bars.
Use TradingView’s Pine Profiler to identify performance bottlenecks.
Test on smaller timeframes or chart ranges to ensure smooth rendering.
NotesVisual Order: If the indicator only appears after clicking the chart, ensure it is set to “Bring to Front” in the visual order, and disable default candlesticks if plotting custom ones.
Performance: Lowering “Maximum Bars to Calculate” reduces computational load but may skip older signals. Adjust based on your chart size and needs.
Compatibility: The indicator uses Pine Script Version 6. If TradingView does not support Version 6, change @version=6 to @version=5 and retest.
Debugging: If issues persist, check for conflicts with other indicators or chart settings, and ensure the chart is refreshed.
This indicator is ideal for traders looking to visually identify key candlestick patterns with customizable options, optimized for performance on TradingView charts. For support or further customization, refer to TradingView’s documentation or community forums.

The Golden Candlestick PatternThe Golden pattern is a three-candlestick configuration based on a variation of the golden ratio (2.618) from the Fibonacci sequence.
The bullish Golden pattern is composed of a normal bullish candlestick with any type of body, followed by a bigger bullish candlestick with a close price that is at least 2.618 times the size of the first candlestick (high to low). Finally, there must be an important condition that is, a third candlestick that comes back to test the open of the second candlestick from where the entry is given.
The bearish Golden pattern is composed of a normal bearish candlestick with any type of body, followed by a bigger bearish candlestick with a close price that is at least 2.618 times the size of the first candlestick (high to low). Finally, there must be an important condition that is, a third candlestick that comes back to test the open of the second candlestick from where the entry is given.

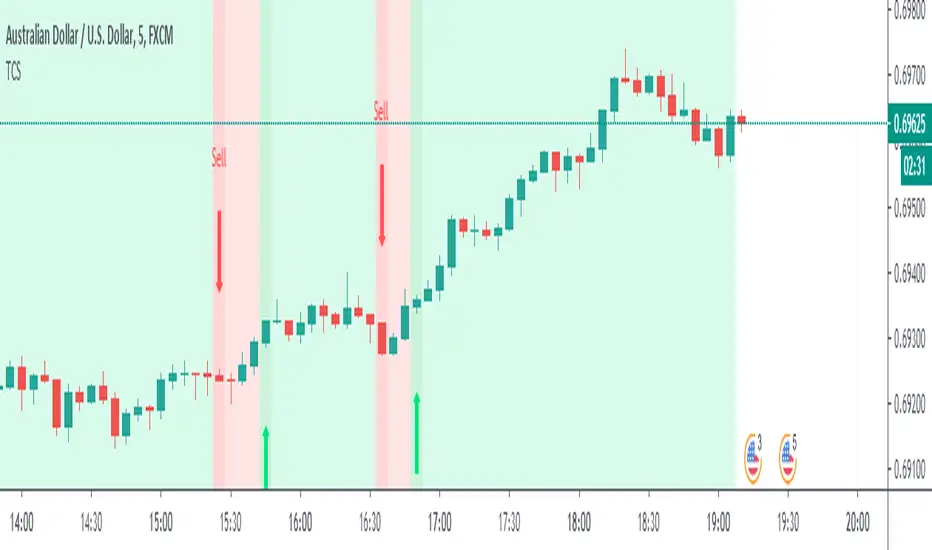
Triple-CandleStick-Strategy (AKA : TCS)Triple Candlestick Strategy
An indicator that helps us to evaluate current and future possible price direction through the background colors. Green for bullish and Red for a bearish market. This indicator shoots signals either long or short depending on which direction the triple candlestick pattern is formed. Three candles up will fire a long signal while three candles down a short signal. The light-dark shaded background color with arrows (either up or down) is the new entry at the certain direction of the market for the chosen symbol (in our case AUDUSD). Useful for glance view of overall market sentiment and one can use alert features for getting aware of the situation.
No Wick Bull/Bear Candlesticks with Arrow premiumNo Wick Bull/Bear Candlesticks with Arrow premium
This script is for a custom trading indicator called "No Wick Bull/Bear Candlesticks with Arrow premium" developed by ClearTradingMind. It is designed for use with trading platforms that support scripting, such as TradingView. This indicator combines several technical analysis tools to help traders identify potential buy and sell signals in a financial market.
Key Components of the Indicator:
Moving Average (MA): The script allows users to select from various types of moving averages (SMA, EMA, HMA, etc.), which smooth out price data to identify trends. Users can set the length and type of the moving average.
Upper and Lower Bands: These bands are set at a specified deviation percentage above and below the chosen moving average. They help in identifying overbought and oversold conditions.
No Wick Bull/Bear Candlestick Identification:
Bullish Condition: A bullish candlestick is identified when the closing price is higher than the opening price, the low equals the open, and the close is above the moving average.
Bearish Condition: A bearish candlestick is identified when the closing price is lower than the opening price, the high equals the open, and the close is below the moving average.
No Wick: These conditions also imply that the candlesticks have no wicks, suggesting strong buying or selling pressure.
Arrows for Trading Signals:
No lower wick bull bar
No upper wick bear bar
When a bullish condition is met, a green upward-pointing triangle is plotted below the candlestick, indicating a potential buy signal.
When a bearish condition is met, a red downward-pointing triangle is plotted above the candlestick, indicating a potential sell signal.
EMA 20: An additional Exponential Moving Average with a length of 20 periods is plotted for further trend analysis.
Background Color Changes: The script changes the background color to blue if the EMA 20 is above the upper band, and to red if it is below the lower band, providing visual cues about the market trend.
How It Works:
Traders can input their preferences for the moving average type and length, source of the MA (like closing prices), and the deviation percentage for the bands.
The script then calculates the moving average, upper and lower bands, and checks for bullish or bearish candlestick conditions without wicks.
When such conditions are met, it plots arrows to suggest buy or sell signals.
The EMA 20 and background color changes offer additional trend information.
Usage:
This indicator is particularly useful in markets with clear trends. The no wick bull/bear candlesticks indicate strong buying or selling pressure, and the arrows provide clear visual signals for traders to consider entering or exiting positions. As with all trading indicators, it's recommended to use this tool in conjunction with other forms of analysis to confirm trading signals.

Oscillator CandlesticksI've always wondered why we don't use candlesticks for oscillators...then I stopped wondering and made an oscillator with candlesticks.
The following oscillators are available as a proof of concept:
* Consumer Channel Index (CCI)
* Rate of Change (ROC)
* Relative Strength Index (RSI)
* Trend Strength Index (TSI)
You can add a moving average to the ohlc4 value of the oscillator and choose the type of the moving average and whether it should be influenced by volume.

PB Candlestick PatternsUsing PB Candlestick Patterns, you can automatically identify 1 and 2 candlesticks patterns to help determine the current trend
The signals appear in Red and Green to denote for bearish (Red) bullish (Green).
This indicator automatically displays the following patterns on the chart.
Harami
Harami Cross
Morning Star
Engulfing
Hammer
Gravestone
Piercing Line
This is different to the existing open source indicator available on the marketplace for the following reasons:
* Identify's and displays more candlestick patterns
* Automatically displays only a specific set of candlestick patterns relevant to our Elliott Wave Indicator Strategy
* Labels reveal the whole name, not an abbreviation
This will be available soon to lease from us.
This indicator is to be used in conjunction with our Elliott Wave Indicator but to know more information about this indicator or when it will be available to lease, send us a DM

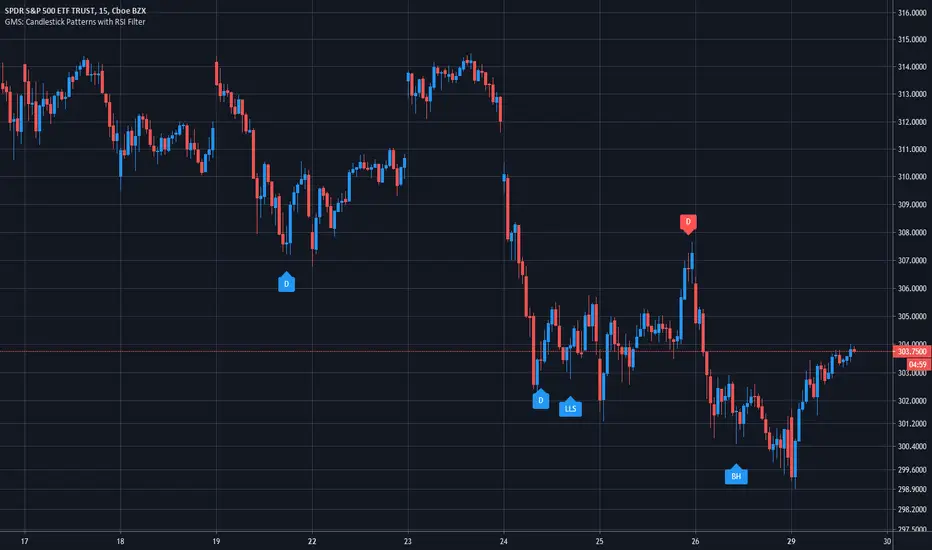
GMS: Candlestick Patterns with RSI FilterI wanted to apply an RSI filter to some of the new Candlestick Patterns (in the indicators tab) since some of them looked to be quite effective for picking reversals. Turns out it's a pretty good pairing.
You can modify the RSI length in addition to the upper and lower thresholds. I also added in check boxes to combine different bullish and bearish patterns.
The candlestick patterns included are:
1. Long Upper Shadow
2. Long Lower Shadow
3. Doji
4. Bullish Harami
5. Bearish Harami
6. Bullish Engulfing
7. Bearish Engulfing
Hope it helps!
Andre
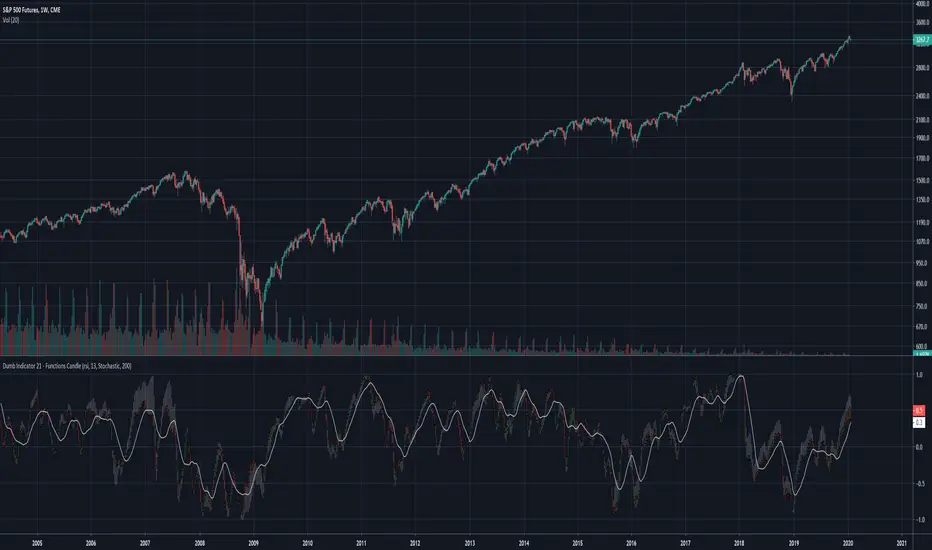
Dumb Indicator 21 - Function's Candlestick Bar's StyleThe idea is help traders to see the patterns and levels from a different point o view.
This script create candlestick using the opening, high, low and close price as source on your favorite function.
It's very simple to use:
Select a function in the drop box list, the number of bars length, check or uncheck the boxes to treat source as logarithm, smooth, and if you want to plot the SMA from the results.
To make a deeper analysis, you can select to plot the candles in Stochastic or in Percent Rank way.
The Stochastic and Percent Rank plot will show how far the price is close to highest or lowest value of the source from the last "Stochastic Length" number of bars.
Some functions with different names can plot the same results.
This indicator works on every kind of market, but you will need to find the best function and length to use.
Please, if you find anything good with this, share to everyone.
GOLDEN BULLETCandlestick Pattern Finder
Bullish Hammer
Bearish Hammer
Bullish Engulfing
Bearish Engulfing
Bullish Harami
Bearish Harami


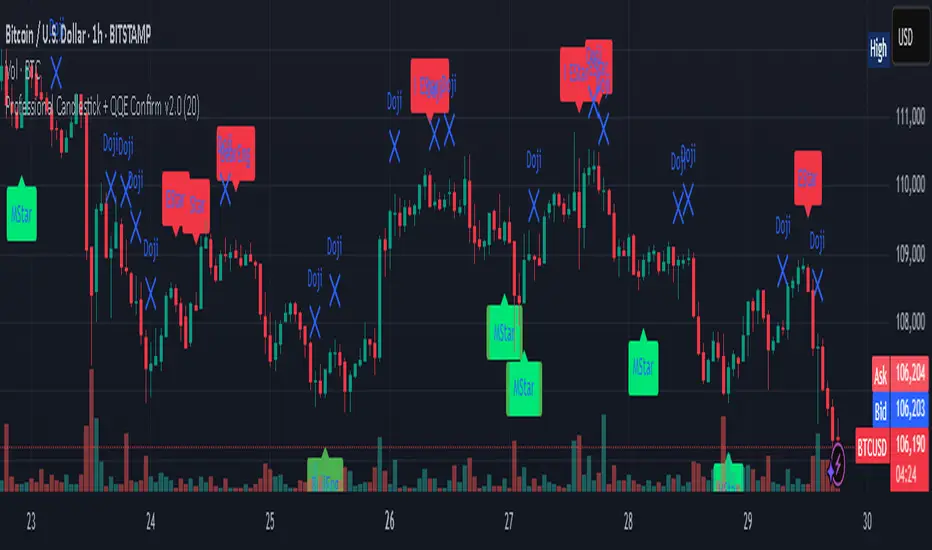
Professional Candlestick + QQE Confirm v2.0 Professional Candlestick + QQE Confirm v1.0
This script combines powerful candlestick pattern detection with QQE momentum confirmation to improve signal reliability for swing trading and trend entries.
🔍 What It Does:
- Detects high-probability candlestick patterns (e.g. Pin Bars, Engulfing, Morning/Evening Stars)
- Confirms signals with the QQE indicator to reduce false entries
- Highlights buy/sell zones using combined logic
⚙️ Key Features:
- Multiple candlestick patterns, each toggleable
- QQE filtering to confirm valid breakouts or reversals
- Signal labels with strength grading
- Optional alert settings
📊 Best Use:
- Works well on 1H, 4H, and Daily charts
- Combine with trendlines or support/resistance for stronger entries
- Avoids signals in sideways/choppy markets
---
This is a tool for traders who want to filter out weak candlestick signals using a trusted momentum indicator (QQE) for more accurate entries.