Search in scripts for "Exponential"

Exponential weighted volatilityEstimator of current annualized volatility that works for daily, weekly, monthly timeframes.
Lambda should be choosen inside the 0 to 1 range, with a lower lambda giving more weight to the movement in the most recent candlesticks. The literature default is 0.97, I'm setting a default value of 0.94 instead.


Exponential Hull MA Oscillator PrototypeClamped EHMA Oscillator Prototype with 21/200 EHMA with additional JMA smoothing (Credit: @everget)
Note: This is an experiment - this is not a polished indicator


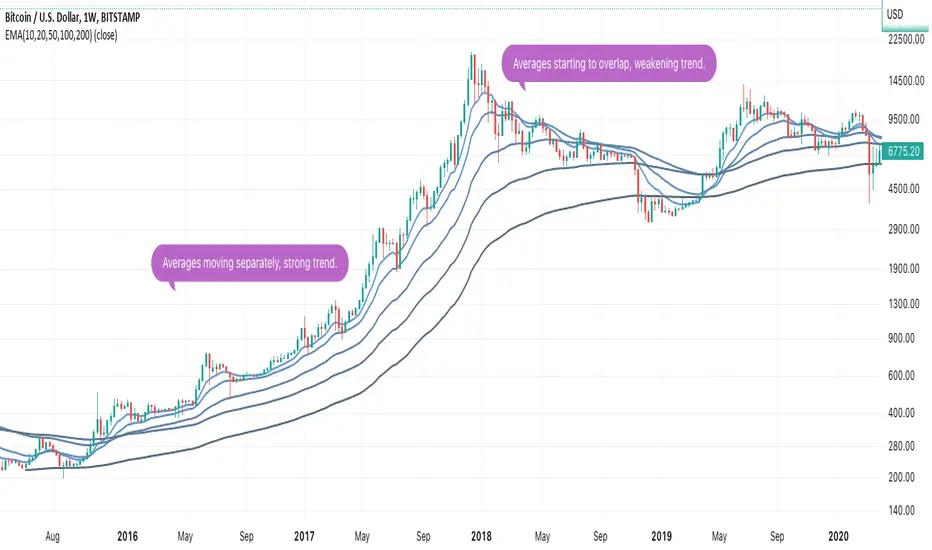
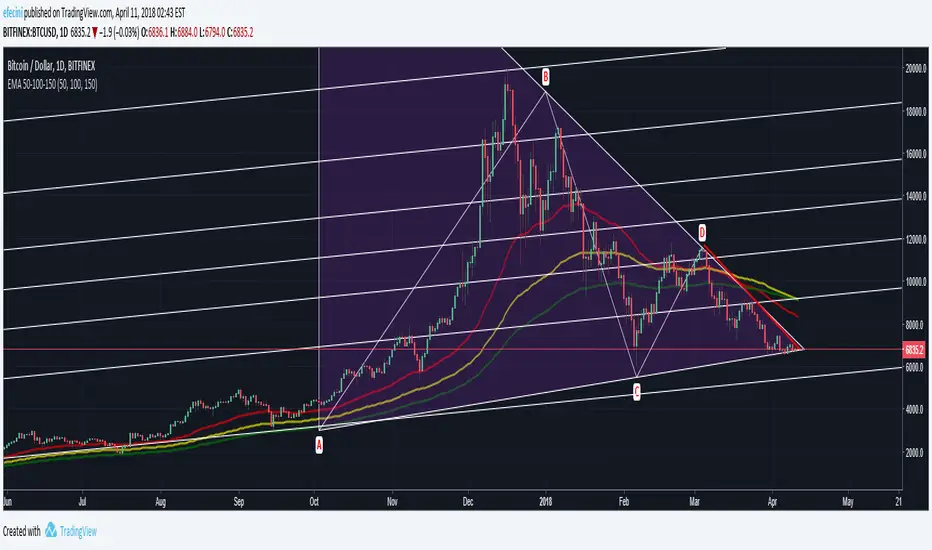
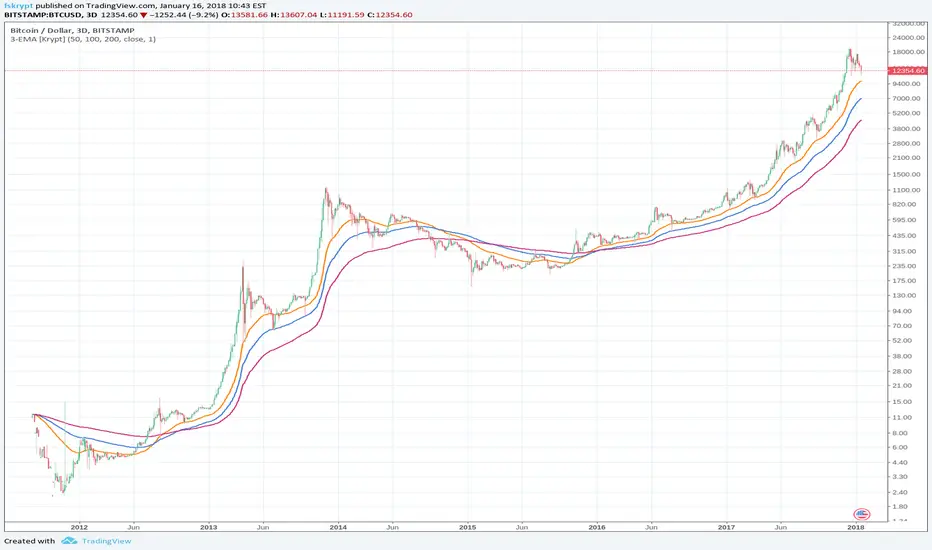
exponential Moving Averagesall in one ema for a select set i use 12/26 then the longer ones 50,100,200


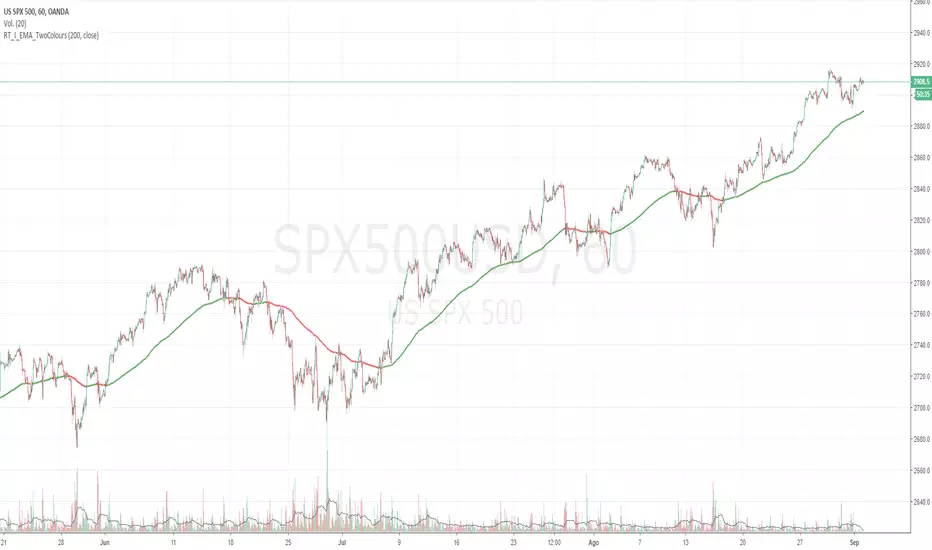
Moving average Two ColoursExponential moving average of 200 periods, which changes color according to the position of the candles.
(200 periods: default configuration Option to change periods allowed)
If the candles are on the EMA, this will have green color, otherwise red color (colors, thickness configurable).
**********************************************************************************************************************************************
Descripción en Español:
Media móvil Exponencial de 200 periodos, la cuál cambia de color según posición de las velas.
(200 periodos: configuración default. Opción de cambio de periodos permitida)
Si las velas están sobre la EMA , esta tendrá color verde, caso contrario color rojo (colores, grosor configurables).


EMA FIBO 4HOURSExponential Moving Averages of 4 Fibonacci Levels((55,144,233,377)*6) in 4 Hour Timezone


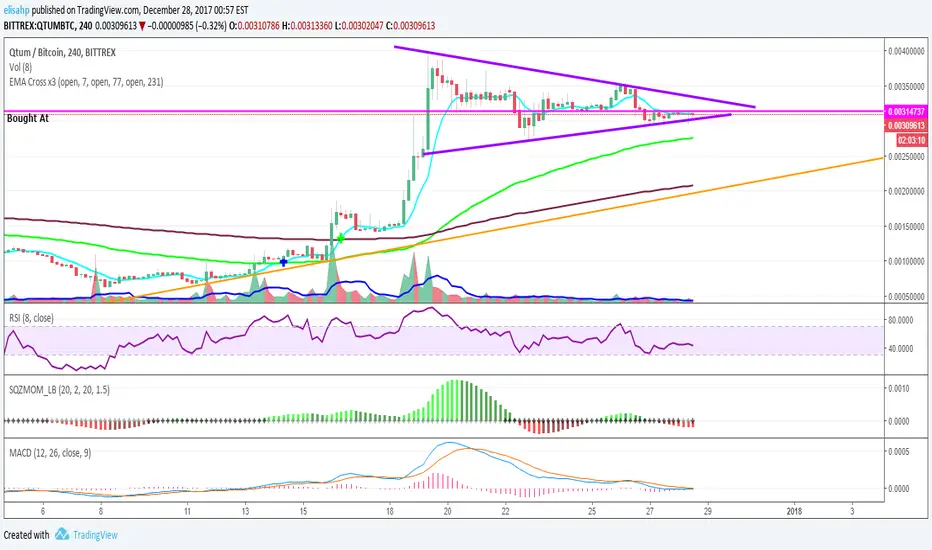
EMA Cross x3 (7, 77, 231)Exponential Moving Average at periods, 7, 77, 231. You will see a blue cross when the short EMA crosses the medium EMA, and a green cross when it crosses the long EMA.
EMA SpreadExponential Moving Average Spread is the percentage spread difference between EMA1 (Slow) and EMA2 (Fast) ie. the gap between two indicators slow and fast. Useful when used alongside EMA cross, MACD, and RSI to strengthen buy/sell signals.

MTF EMAExponential Moving Average indicator that can be configured to display different timeframe EMA's.
Timeframe is set in minutes. Max timeframe currently is the daily (1440 minutes). Any value higher than 1440 will result in no plot.
Examples:
Daily 50 EMA plotted on 4H chart
4H 50 EMA and Daily 50 EMA plotted on 1H chart
Can also work in reverse if needed.
Example, Daily 50 EMA plotted on Weekly Chart


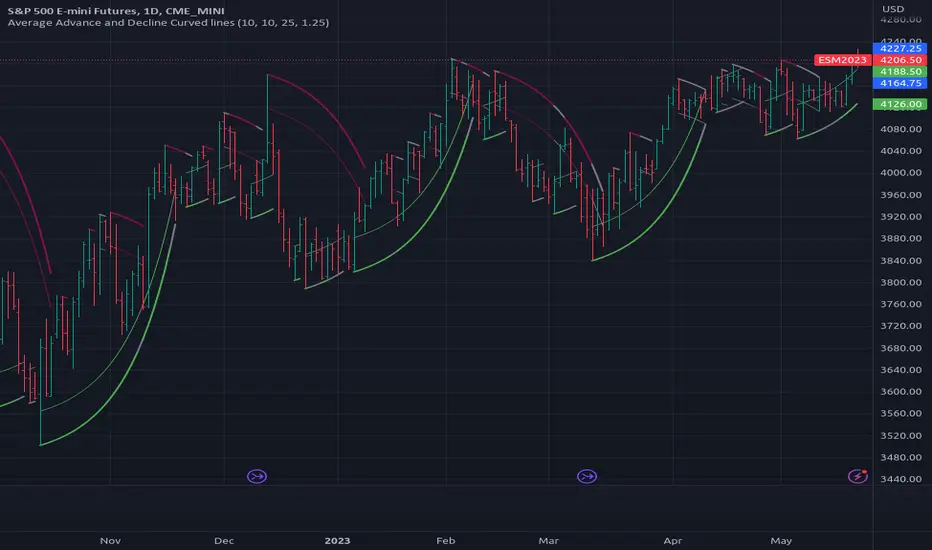
[RS]Average Advance and Decline Curved Lines V0exponential curve linear regression, use falloff multiplier to control curve falloff strength.
Abertura do Dia juscy# Complete Description of TradingView Code: "Daily Open + Moving Averages"
## Overview
This is an advanced TradingView indicator (Pine Script v5) that combines multiple visual elements and technical analysis tools focused on the daily opening price. The indicator is highly customizable and allows traders to quickly visualize key levels based on the daily opening price, plus includes optional moving averages.
## Structure and Main Functionalities
### 1. **Initial Settings**
- **Indicator name**: "Daily Open + Moving Averages"
- **Overlay**: True (draws directly on the price chart)
- **Maximum lines**: 500 (to avoid system overload)
### 2. **Visual Elements Based on Daily Open**
#### **Dynamic Vertical Line**
- Drawn on the first candle of each day
- Automatically adjusts its height to reflect the daily high and low
- Updated in real-time as new extremes form
- Customizable color and transparency
#### **Horizontal Opening Line**
- Dashed line marking the daily opening price
- Extends horizontally throughout the entire session
- Serves as reference for percentage movements
#### **Percentage Levels**
- Four levels calculated relative to the opening:
- +0.5% (green/up)
- +1.0% (green/up)
- -0.5% (red/down)
- -1.0% (red/down)
- Useful for identifying nearby support/resistance zones
#### **Daily VWAP (Volume Weighted Average Price)**
- Calculates volume-weighted average price for each day
- Optional (can be disabled for better performance)
- Updated in real-time during the session
### 3. **Moving Averages System**
The indicator includes 7 popular moving averages:
- **EMA 9**: 9-period exponential moving average (short-term)
- **SMA 12**: 12-period simple moving average
- **SMA 21**: 21-period simple moving average (common in strategies)
- **SMA 34**: 34-period simple moving average
- **SMA 55**: 55-period simple moving average (medium-term)
- **SMA 89**: 89-period simple moving average
- **SMA 200**: 200-period simple moving average (long-term)
Each moving average can be individually enabled/disabled and has customizable colors.
### 4. **Technical Architecture**
#### **Daily State Management**
- Uses `ta.change(time("D"))` to detect new days
- Stores key variables: `daily_open`, `daily_high`, `daily_low`
- Tracks opening bar index (`day_start_bar`)
#### **Array System for Lines**
- Uses arrays (`array.new_line()`) to store and manage graphic lines
- Allows efficient updating of visual elements
- Avoids accumulation of unnecessary graphic objects
#### **Update Logic**
- **During the day**: Updates extremes and VWAP
- **Day change**: Reinitializes variables and creates new elements
- **Last candle**: Extends horizontal lines to end of chart
#### **Performance Control**
- Use of `barstate.islastconfirmedhistory` and `barstate.isrealtime` for optimization
- Conditional creation of visual elements
- Implicit cleanup through replacement of old lines
### 5. **User Interface**
#### **Organized Configuration Groups**
1. **General Settings**: Line transparency and thickness
2. **Visual Elements**: Controls for each graphic component
3. **Moving Averages**: Enable/disable each moving average
4. **Colors**: Complete color customization for all elements
#### **Display Options**
All functionalities can be enabled/disabled:
- Vertical and horizontal lines
- Percentage levels
- VWAP
- Each moving average individually
### 6. **Practical Applications**
#### **For Day Traders**
- Quick identification of daily open as reference level
- Visualization of ±0.5% and ±1.0% zones for targets and stops
- VWAP as dynamic support/resistance level
#### **For Swing Traders**
- Multiple moving averages for trend analysis
- Daily context on important levels
- Combination of intraday and position analysis
#### **For Technical Analysis**
- Study of reactions at opening price
- Identification of daily trading ranges
- Level confluence (opening + moving averages)
### 7. **Design Advantages**
- **Modular**: Each component can be disabled
- **Efficient**: Careful management of graphic resources
- **Customizable**: Adjustable colors, thicknesses, and visibility
- **Real-time**: Automatically updates during session
- **Multi-timeframe**: Useful across various timeframes (from 1 minute to daily)
### 8. **Usage Considerations**
- Best performance on liquid assets
- Most useful in markets with defined openings (stocks, futures)
- Can be combined with other indicators
- Recommended to use alongside volume analysis
This indicator serves as a complete visual "workstation," providing multiple layers of information in a single overlay, facilitating decision-making based on key levels derived from the daily opening price.
