DivergenceLibrary "Divergence"
Calculates a divergence between 2 series
bullish(_src, _low, depth) Calculates bullish divergence
Parameters:
_src : Main series
_low : Comparison series (`low` is used if no argument is supplied)
depth : Fractal Depth (`2` is used if no argument is supplied)
Returns: 2 boolean values for regular and hidden divergence
bearish(_src, _high, depth) Calculates bearish divergence
Parameters:
_src : Main series
_high : Comparison series (`high` is used if no argument is supplied)
depth : Fractal Depth (`2` is used if no argument is supplied)
Returns: 2 boolean values for regular and hidden divergence
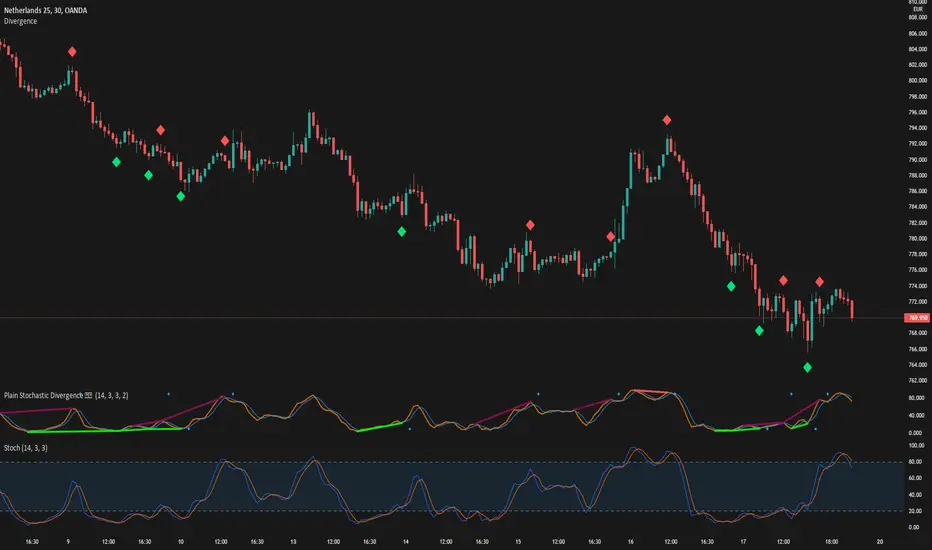
I created this library to plug and play divergences in any code.
You can create a divergence indicator from any series you like.
Fractals are used to pinpoint the edge of the series. The higher the depth, the slower the divergence updates get.
My Plain Stochastic Divergence uses the same calculation. Watch it in action.
Search in scripts for "Fractal"
Bill Williams SystemBill Williams System combine all indicators of Mr. Bill Williams into one window with detail below:
1. Top of window:
Display Fractals with shape triangle down is bottom fractal and shape triangle up is top fractal
2. Bottom of window:
Display Alligator Trend Flat with trend defined as below:
* Up trend: Lips value shift 3 bars greater than Teeth value shift 5 bars. And Teeth value shift 5 bars greater than Jaws value shift 8 bars. By default up trend is green square.
* Down trend: Lips value shift 3 bars less than Teeth value shift 5 bars. And Teeth value shift 5 bars less than Jaws value shift 8 bars. By default down trend is red square.
* Choppy: not up trend and not down trend. By default choppy is gray square.
3. Moving around zero line
* Awesome Oscillator is circles.
* Accelerator Oscillator is columns.
* Gator Oscillator is area.

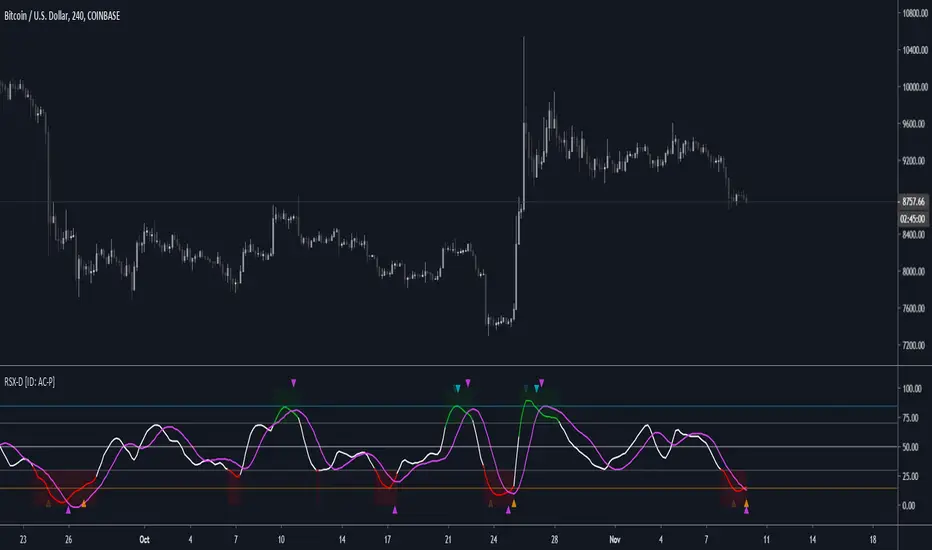
RSX-D [ID: AC-P]The "AC-P" version of Jaggedsoft's RSX Divergence and Everget's RSX script is my personal customized version of RSX with the following additions and modifications:
LSMA-D line that averages in three LSMA components to form a composite, the LSMA-D line. Offset for the LSMA-D line is set to -2 to offset latency from averaging togther the LSMA components to form a composite - recommended to adjust to your timeframe and asset/pair accordingly.
Divergence component from JustUncle, RicardoSantos, and Neobutane divergence scripts
Crossover indication and alerts for Midline, and custom M1 and M2 levels for both RSX and the LSMA-D line from Daveatt's CCI Stochastic Script
EMA21/55 zone cross highlighting option
SMA9/EMA45 MA option from my RSI sma/ema Cu script
Libertus Divergences and Pivot labels from Jaggedsoft's RSX Divergence script are hidden/off by default
Designed for darkmode by default. Minor visual changes from Jaggedsoft's and Everget's script(s) for darkmode and visual aesthetic.
Please Note:
Divergences that use fractal-based detection logic, offset, or a combination of both generally have a 1-2 bar/candle lag. This is an INHERENT limitation of divergence detection with fractals and offsets. Divergences generally will have a higher strikerate on HTF than LTF due to the 1-2 bar lag. While I'm not going to rule out a programming solution or math construct/formula that attempts to alleivates the 1-2 bar lag for divergences, this script is not it - please keep that in mind when using divergence components with a fractal base and offset.
LSMA-D is a composite of three LSMA lines, all with offset options. Different lengths and Offset values can compensate/adjust for the smoothing/latency from RSX, but only up to a certain point. For each LSMA, the least square regression line is calculated for the previous time periods, so the idea is that with finely tuned adjustments, you can get crossover/crossunder signals from the RSX with the LSMA-D line that you simply can't get with the SMA9/EMA45 due to the already smoothed RSX.
The defaults for the RSX and various components for the LSMA-D here will MOSTLY LIKELY NOT WORK OR BE APPLICABLE to every timeframe and asset that you trade - adjust, backtest, and test accordingly. The defaults are here are MEANT to be adjusted to the asset class and timeframe that you are trading.
If you're not familiar with the LSMA, tradingview author Alexgrover has a few great scripts that go into detail how the LSMA works, in addition to different interpretations and implementations of the LSMA.
References/Acknowledgements:
//@version=4
// Copyright (c) 2019-present, Alex Orekhov (everget)
// Jurik RSX script may be freely distributed under the MIT license.
//
//-------------------------------------------------------------------
// Acknowledgements:
//---- Base script:
// RSX Divergence — SharkCIA by Jaggedsoft
//
// Jurik Moving Average by Everget
//
//---- Divergences/Signals:
// Libertus RSI Divergences
//
// Price Divergence Dectector V3 by JustUncle
//
// Price Divergence Detector V2 by RicardoSantos
//
// Stochastic RSI with Divergences by Neobutane
//
// CCI Stochastic by Daveatt
//
//---- Misc. Reference:
// RSI SMA/EMA Cu by Auroagwei
//
// CBCI Cu by Auroagwei
//
// Chop and explode by fhenry0331
//
// T-Step LSMA by RafaelZioni
//
// Scripts by Jaggedsoft for structure and formatting
// Scripts by Everget for structure and formatting
//-------------------------------------------------------------------
// RSX-D v08
// Author: Auroagwei
// www.tradingview.com
//-------------------------------------------------------------------
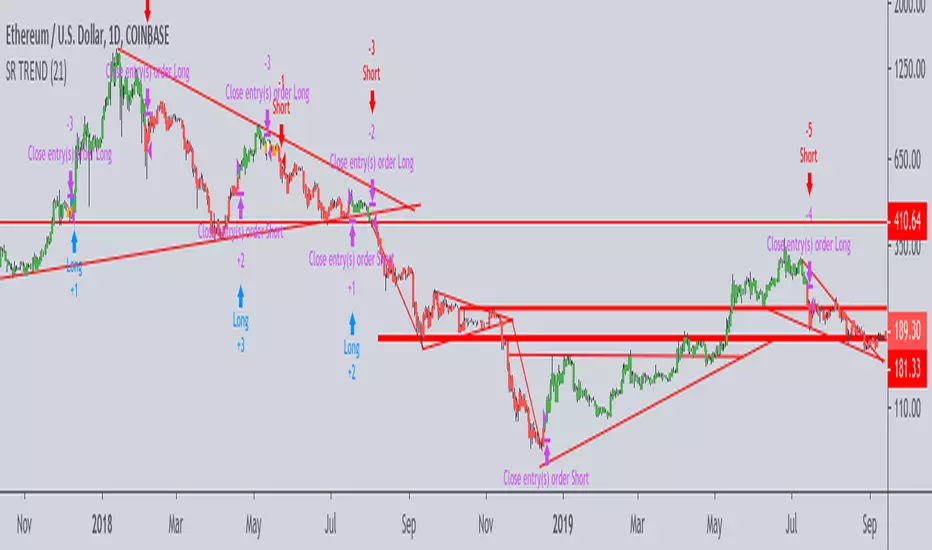
Support-Resistance breakoutStrategy based on longing resistance breakout and shorting support breakout.
It defines highs and lows using fractal with 2 bars for confirming high/lows. So it has 2 bars lag.
It calculates the difference between sma with defined length (21 by default) of highs and of lows and uses it as alt SR level. This idea I took from synapticEx's indicator Nebula-Advanced-Dynamic-Support-Resistance.
Position enter is the breakout of SR, defined by fractals.
Position exit is: bar change in opposite to position direction > difference is sma of highs and of lows.
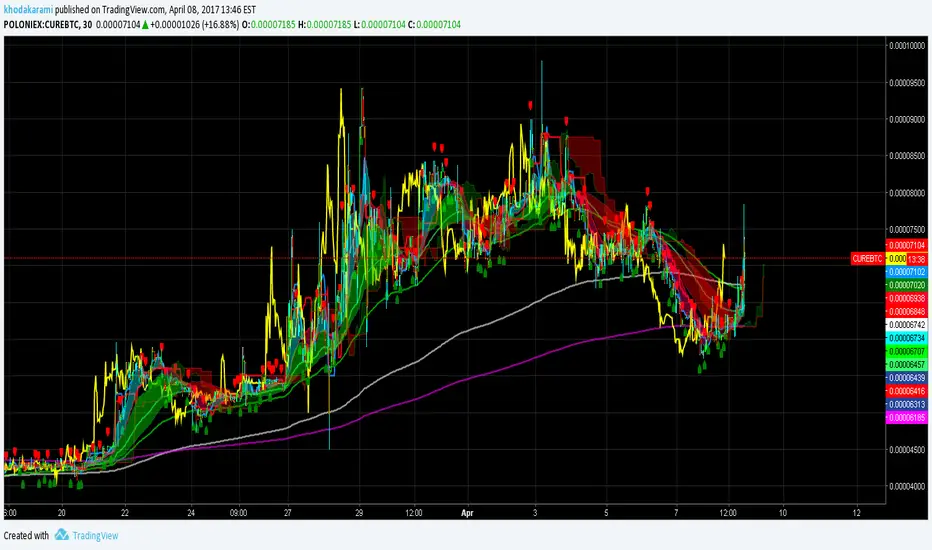
Guerrilla AdvancedThis indicator was designed with people without Pro License in mind (Including many of my close friends).
Basically, you will get a combo of few different tools in one box, with ability to turn them on and off with a single check mark, also, you have total control over the input numbers that was used in calculations if you so want to, for example, sometimes when i see a massive bullish up trend, i reduce the short rally from 12 to 8 even 6 to get faster signal for selling the trend.
So, what will you get in this pack?
1- Ichimoko. Yes, you heard it right, although we have it in the default tools but hey, it will use one indicator slot and if you don't have a pro license, you will use that slot
2- Rally. This is an old yet very powerful system for getting buy or sell signals, basically, you get two lines and for making the life easier i draw a cloud between them. when the trend passes above the cloud and it was bellow it in past, right after the very first candle that gets above the cloud you can put the buy order, and vice versa, the moment a candle body enters the cloud, if you want an aggressive signal, you can sell, if not, you may want to wait to see if the candles drop bellow the cloud or not then decide.
3- Resistance Support Cloud. Most of us always heard about resistance and support "lines" but many of us don't know that, in each trend, the trend line itself is a resistance or support line, and when you are going in a bullish or bearish tunnel, the floor and roof of tunnels are again resistance and supports, using this part of the tool, just like rally, you get a cloud that shows you the resistance / support "zone"
4- William Fractals. To be honest, I got this part of the code from another source available around. Why? looking at those fractal indicators, you can easily eyeball the trend line or existence of a tunnel.
5- Different EMA lines. If you are one of those people that use EMA lines for their trading, have fun with them, there are few different standard ones and even a custom one that you can put your desired number for it.
ka66: Swing/Pivot Point LinesThis indicator draws swing-highs and swing-lows, also called pivot highs and lows.
A swing high is a bar which has a higher-high than its surrounding bars (to the left and the right).
A swing low is a bar which has a lower-low than its surrounding bars (to the left and the right).
A common example of a pivot is Bill Williams' Fractal, which specifies that the centre bar must have a higher high than 2 bars to its left, and 2 bars to its right for a swing high, taking into account 5 bars at a time. Similarly, for a swing low, the centre bar must have a lower low than the 2 bars to its left and right.
This indicator allows configurable adjacent bars as input. Entering 2, means it essentially picks out a Williams Fractal. But you can select 1 (say for higher timeframes), using one 1 bar to the left and right of the centre bar.
The indicator will draw Swing/Pivot High/Low as circles at the same price level as the centre bar, till the next one shows up. Drawing is offset so it starts at the centre bar (the swing bar), showing exactly where the pivot bar is.
There are 2 main uses of pivot points, in various strategies:
Market Structure: to objectively define higher-highs/lows and lower-highs/lows in Trend Analysis.
More generally, to then determine if a trend might reverse, or continue as pivot levels are broken.
Messy pivot structures easily point out ranging markets.
There are a few of these, some closed source, which I don't like, since I think people should generally know what they are trading with, and I want to make sure I understand the logic exactly.
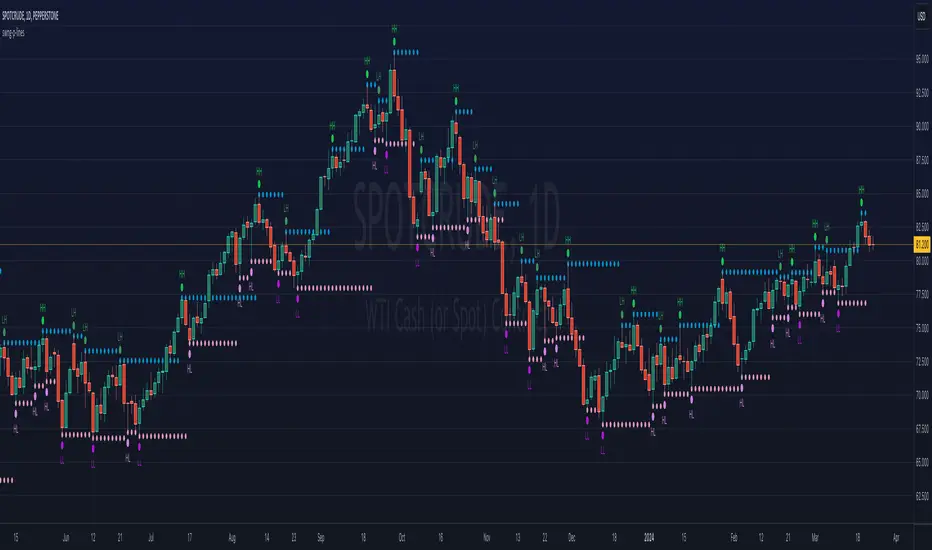
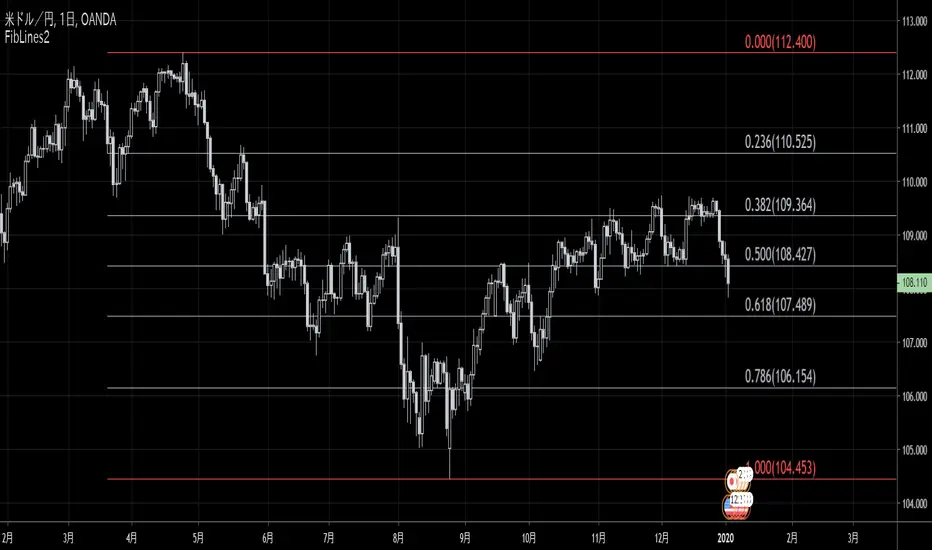
FibLines2This script is a new version of "FibLines" which automatically draws Fibonacci Lines on chart.
0% line and 100% line are determined by "Period" and "Delay" parameter.
◆Params
- Period: specifies periods to detect the highest (bearish) fractal and the lowest (bullish) fractal.
- Delay: specifies the number of new bars you ignore.
(👇 old version)
Liquidity Structure & Sweeps [Visualized]Liquidity Structure & Sweeps | 流动性结构与猎杀
1. Design Philosophy & Logic
This indicator is designed based on Smart Money Concepts (SMC) and Market Microstructure principles. Unlike traditional indicators that rely on lagging averages or repainting fractals, this script focuses on "Objective Structure" and "Liquidity Grabs".
The core design philosophy rests on three pillars:
Zero Repainting (Real-time Integrity): We utilize a strict "Left-Side Confirmation" algorithm. A structure level is only stored in memory when the candle is fully closed (barstate.isconfirmed). This ensures that the historical signals you see are exactly what happened in real-time.
Institutional Memory (Visualized): Markets "remember" key levels. This script draws dashed lines extending from valid pivot points. These lines represent "resting liquidity" (Stop Orders). They remain on the chart until the price interacts with them.
Sweep vs. Breakout: Not all breaches are equal. We specifically look for "Sweeps" (Liquidity Grabs) — where price pierces a level but closes back inside. This is a classic sign of absorption and potential reversal, distinct from a structural breakout.
2. Key Features
Visualized Order Blocks: Automatically draws potential support (Green Dotted) and resistance (Red Dotted) lines based on fractal points.
Wick Detection: Filters out strong momentum breakouts. Signals are only generated when a specific "Wick Ratio" is met, indicating a rejection.
Clean Charts: Features a "Garbage Collection" mechanism. Once a level is swept, the line is removed, and a signal dot is placed. Old, untouched levels are automatically cycled out to prevent chart clutter.
3. How to Use
The Lines (Context):
Red Dotted Line: Buy-side Liquidity (Resistance). Expect potential shorts or breakouts here.
Green Dotted Line: Sell-side Liquidity (Support). Expect potential longs or breakdowns here.
The Signals (Action):
Red Dot (Bearish Sweep): Price spiked above a Resistance Line but closed below it. This suggests long stops were hunted, and bears are stepping in.
Green Dot (Bullish Sweep): Price spiked below a Support Line but closed above it. This suggests short stops were hunted, and bulls are stepping in.
Configuration:
Structure Length: Adjusts sensitivity. Higher values (e.g., 20-50) find major swing points; lower values (e.g., 5-10) find scalping setups.
Wick Filter %: The minimum size of the wick relative to the breakout. Increase this to filter for only the most dramatic rejections.
4. Developer Notes & Considerations
Why do lines disappear? In this logic, liquidity is treated as "Fuel". Once a level is swept (the stop orders are triggered), the fuel is consumed. Keeping the line would clutter the chart with invalid data.
Why is the dot small? The indicator is designed to be part of a toolchain, not a standalone signal. The minimalist design prevents visual interference with price action or other indicators.
1. 设计思路与核心逻辑
本指标基于 聪明钱概念 (SMC) 与 市场微观结构 原理设计。不同于依赖滞后均线或存在重绘问题的传统分形指标,本脚本专注于捕捉 “客观结构” 与 “流动性猎杀 (Liquidity Grabs)”。
核心设计哲学包含三大支柱:
零重绘 (Zero Repainting): 我们采用了严格的“左侧确认”算法。所有的结构位仅在K线完全收盘 (barstate.isconfirmed) 后才会被记录。这保证了您回测看到的信号与实盘完全一致,杜绝“未来函数”陷阱。
可视化的机构记忆: 市场是有记忆的。本脚本会从有效的波段高低点引出虚线。这些虚线代表了“沉睡的流动性”(止损盘聚集区)。它们会一直延伸,直到价格触碰它们。
区分“猎杀”与“突破”: 并不是所有的破位都是一样的。我们专注于识别“扫损(Sweep)”——即价格刺破了关键位,但收盘价收回了关键位内部。这是典型的吸筹或派发信号,与趋势延续的真突破有本质区别。
2. 主要功能
结构可视化: 自动基于分形点绘制潜在的支撑线(绿色虚线)和阻力线(红色虚线)。
插针检测: 过滤掉强势的实体突破。只有当价格出现明显的“长影线”拒绝行为时,才会触发信号。
图表自清洁: 内置“垃圾回收”机制。一旦某个关键位的流动性被猎杀(触发信号),该线条会被自动删除。过旧且未被触碰的线条也会被自动替换,保持图表整洁。
3. 使用指南
线条 (市场语境):
红色虚线: 买方流动性池(阻力位)。
绿色虚线: 卖方流动性池(支撑位)。
信号点 (交易动作):
红色圆点 (看跌猎杀): 价格刺破了红色阻力线,但收盘价回落到线下方。这暗示多头止损被触发,主力可能正在建立空单。
绿色圆点 (看涨猎杀): 价格刺破了绿色支撑线,但收盘价反弹到线上方。这暗示空头止损被触发,主力可能正在建立多单。
参数设置建议:
Structure Length (结构周期): 调整灵敏度。数值越大(如 20-50)锁定大级别波段;数值越小(如 5-10)适合短线剥头皮。
Wick Filter % (影线过滤): 设置影线占价格波动的最小比例。调大该数值可以只看最剧烈的反转信号。
4. 开发者注记与潜在考量
为什么线条会消失? 在本逻辑中,流动性被视为“燃料”。一旦发生猎杀(止损单成交),该位置的燃料即被消耗。移除线条是为了防止无效数据干扰判断。
为什么圆点设计得很小? 该指标旨在成为您交易工具链的一部分,而非唯一的决策依据。极简设计是为了避免干扰裸K形态或其他指标的观察。
===============================================================
这个脚本(我们称之为 Liq Structure Script)本质上是一个基于价格行为(Price Action)的结构猎杀探测器。
以下是详细的深度对比分析:
1. 如何使用? (实战操作手册)
不要把它当作“红灯停绿灯行”的傻瓜指标。把它当作一个**“战场地图”**。
第一阶段:观察结构 (The Setup)
图表上会自动画出 红色虚线(上方压力)和 绿色虚线(下方支撑)。
解读:告诉自己,“这里埋着很多人的止损单”。不要在这里盲目追涨杀跌。
第二阶段:等待猎杀 (The Trigger)
耐心等待价格冲向这些虚线。
关键动作:价格刺破虚线,然后迅速收回。
信号确认:虚线消失,留下一个 红点(顶部猎杀)或 绿点(底部猎杀)。
第三阶段:进场逻辑 (The Execution)
做空逻辑:出现红点 + K线留长上影线 → 说明多头试图突破失败,被主力“倒了一盆冷水”。此时可尝试做空,止损设在刚刚那个最高点上方一点点。
做多逻辑:出现绿点 + K线留长下影线 → 说明空头试图砸盘失败,被主力接住了。
传统爆量是“燃料”,Liq 脚本是“引爆点”。没有引爆点的爆量可能是空转;没有爆量的引爆点可能是假摔。Liq 脚本是一个免费、轻量级、基于K线逻辑的替代品。它不需要你买昂贵的数据服务,它利用的是“图表形态学”中的流动性共识。
结论:如何定位这个工具?
这个脚本不是“预测未来的水晶球”,而是一个**“高胜率区域提示器”**。
用它来找位置(哪里有陷阱?)。
用成交量来做确认(是不是真的有主力介入?)。
用宏观逻辑来定方向(现在该做多还是做空?)。
它是你交易工具链中负责**“微观入场时机(Timing)”**的那一环。

DAMMU SWING TRADING PROScalping and swing trading tool for 15-min and 1-min charts.
Designed for trend, pullback, and reversal analysis.
Works optionally with Heikin Ashi candles.
Indicators Used
EMAs:
EMA89/EMA75 (green)
EMA200/EMA180 (blue)
EMA633/EMA540 (black)
EMA5-12 channel & EMA12-36 ribbon for short-term trends
Price Action Channel (PAC) – EMA high/low/close, length adjustable
Fractals & Pristine Fractals (BW filter)
Higher High (HH), Lower High (LH), Higher Low (HL), Lower Low (LL) detection
Pivot Points – optional, disables fractals automatically
Bar color coding based on PAC:
Blue → Close above PAC
Red → Close below PAC
Gray → Close inside PAC
Trading Signals
PAC swing alerts: arrows or shapes when price exits PAC with optional 200 EMA filter.
RSI 14 signals (if added):
≥50 → BUY
<50 → SELL
Chart Setup
Two panes: 15-min (trend anchor) + 1-min (entry)
Optional Heikin Ashi candles
Use Sweetspot Gold2 for support/resistance “00” and “0” lines
Trendlines can be drawn using HH/LL or Pivot points
Usage Notes
Trade long only if price above EMA200; short only if below EMA200
Pullback into EMA channels/ribbons signals potential continuation
Fractals or pivot points help define trend reversals
PAC + EMA36 used for strong momentum confirmation
Alerts
Up/Down PAC exit alerts configurable with big arrows or labels
RSI labels show buy/sell zones (optional)
Works on both 15-min and 1-min timeframes
If you want, I can make an even shorter “super cheat-sheet” version for 1-page quick reference for trading. It will list only inputs, signals, and colors.

MA+BB+LineThis indicator integrates three major components: the MA System, Bollinger Bands, and Chan Theory fractals & segments:
MA System – Utilizes eight moving averages to form a comprehensive MA framework, allowing full customization of both the time periods and the calculation methods.
Bollinger Bands – Provides dynamic volatility tracking and price channel visualization.
Chan Theory Fractals & Segments – Implements a strict-mode automatic segmentation system based on Chan Theory:
Green arrows indicate top fractals
Red arrows indicate bottom fractals
These fractals are used to automatically generate trend segments with precision.

Smart RSI Divergence PRO | Auto Lines + Alerts📌 Purpose
This indicator automatically detects Regular and Hidden RSI Divergences between price action and the RSI oscillator.
It plots divergence lines directly on the chart, labels signals, and includes alerts for automated monitoring.
🧠 How It Works
1. RSI Calculation
RSI is calculated using the selected Source (default: Close) and RSI Length (default: 14).
2. Divergence Detection via Fractals
Swing points on both price and RSI are detected using fractal logic (5-bar patterns).
Regular Divergence:
Bearish: Price forms a higher high, RSI forms a lower high.
Bullish: Price forms a lower low, RSI forms a higher low.
Hidden Divergence:
Bearish: Price forms a lower high, RSI forms a higher high.
Bullish: Price forms a higher low, RSI forms a lower low.
3. Auto Drawing Lines
Lines are drawn automatically between divergence points:
Red = Regular Bearish
Green = Regular Bullish
Orange = Hidden Bearish
Blue = Hidden Bullish
Line width and transparency are adjustable.
4. Labels and Alerts
Labels mark divergence points with up/down arrows.
Alerts trigger for each divergence type.
📈 How to Use
Use Regular Divergences to anticipate trend reversals.
Use Hidden Divergences to confirm trend continuation.
Combine with support/resistance, trendlines, or volume for higher probability setups.
Recommended Timeframes: Works on all timeframes; more reliable on 1h, 4h, and Daily.
Markets: Forex, Crypto, Stocks.
⚙️ Inputs
Source (Close, HL2, etc.)
RSI Length
Toggle Regular / Hidden Divergence visibility
Toggle Lines / Labels
Line Width & Line Transparency
⚠️ Disclaimer
This script is for educational purposes only. It does not constitute financial advice.
Always test thoroughly before using in live trading.

Swiss Knife [MERT]Introduction
The Swiss Knife indicator is a comprehensive trading tool designed to provide a multi-dimensional analysis of the market. By integrating a wide array of technical indicators across multiple timeframes, it offers traders a holistic view of market sentiment, momentum, and potential reversal points. This indicator is particularly useful for traders looking to combine trend analysis, momentum indicators, volume data, and price action into a single, easy-to-read format.
---
Key Features
Multi-Timeframe Analysis : Evaluates indicators on Daily , 4-Hour , 1-Hour , and 15-Minute timeframes.
Comprehensive Indicator Suite : Incorporates MACD , Awesome Oscillator (AO) , Parabolic SAR , SuperTrend , DPO , RSI , Stochastic Oscillator , Bollinger Bands , Ichimoku Cloud , Chande Momentum Oscillator (CMO) , Donchian Channels , ADX , volume-based momentum indicators, Fractals , and divergence detection.
Market Sentiment Scoring : Aggregates signals from multiple indicators to provide an overall sentiment score.
Visual Aids : Displays EMA lines, trendlines, divergence signals, and a sentiment table directly on the chart.
Super Trend Reversal Signals : Identifies potential market reversal points by assessing the momentum of automated trading bots.
---
Explanation of Each Indicator
Moving Average Convergence Divergence (MACD)
- Purpose : Measures the relationship between two moving averages of price.
- Interpretation : A positive histogram suggests bullish momentum; a negative histogram indicates bearish momentum.
Awesome Oscillator (AO)
- Purpose : Gauges market momentum by comparing recent market movements to historic ones.
- Interpretation : Above zero indicates bullish momentum; below zero indicates bearish momentum.
Parabolic SAR (SAR)
- Purpose : Identifies potential reversal points in price direction.
- Interpretation : Dots below price suggest an uptrend; dots above price suggest a downtrend.
SuperTrend
- Purpose : Determines the prevailing market trend.
- Interpretation : Provides buy or sell signals based on price movements relative to the SuperTrend line.
Detrended Price Oscillator (DPO)
- Purpose : Removes trend from price to identify cycles.
- Interpretation : Values above zero suggest price is above the moving average; values below zero indicate it is below.
Relative Strength Index (RSI)
- Purpose : Measures the speed and change of price movements.
- Interpretation : Values above 50 indicate bullish momentum; values below 50 indicate bearish momentum.
Stochastic Oscillator
- Purpose : Compares a particular closing price to a range of its prices over a certain period.
- Interpretation : Values above 50 indicate bullish conditions; values below 50 indicate bearish conditions.
Bollinger Bands (BB)
- Purpose : Measures market volatility and provides relative price levels.
- Interpretation : Price above the middle band suggests bullishness; below the middle band suggests bearishness.
Ichimoku Cloud
- Purpose : Provides support and resistance levels, trend direction, and momentum.
- Interpretation : Bullish signals when price is above the cloud; bearish signals when price is below the cloud.
Chande Momentum Oscillator (CMO)
- Purpose : Measures momentum on both up and down days.
- Interpretation : Values above 50 indicate strong upward momentum; values below -50 indicate strong downward momentum.
Donchian Channels
- Purpose : Identifies volatility and potential breakouts.
- Interpretation : Price above the upper band suggests bullish breakout; below the lower band suggests bearish breakout.
Average Directional Index (ADX)
- Purpose : Measures the strength of a trend.
- Interpretation : DI+ above DI- indicates bullish trend; DI- above DI+ indicates bearish trend.
Volume Momentum Indicators (VolMom, CumVolMom, POCMom)
- Purpose : Analyze volume to assess buying and selling pressure.
- Interpretation : Positive values suggest bullish volume momentum; negative values indicate bearish volume momentum.
Fractals
- Purpose : Identify potential reversal points in the market.
- Interpretation : Up fractals may indicate a future downtrend; down fractals may indicate a future uptrend.
Divergence Detection
- Purpose : Identifies divergences between price and various indicators (RSI, MACD, Stochastic, OBV, MFI, A/D Line).
- Interpretation : Bullish divergences suggest potential upward reversal; bearish divergences suggest potential downward reversal.
- Note : This functionality utilizes the library from Divergence Indicator .
---
Coloring Scheme
Background Color
- Purpose : Reflects the overall market sentiment by combining sentiment scores from all indicators across different timeframes.
- Interpretation :
- Green Shades : Indicate bullish market sentiment.
- Red Shades : Indicate bearish market sentiment.
- Intensity : The strength of the color corresponds to the strength of the sentiment score.
Sentiment Table
- Purpose : Displays the status of each indicator across different timeframes.
- Interpretation :
- Green Cell : The indicator suggests a bullish signal.
- Red Cell : The indicator suggests a bearish signal.
- Percentage Score : Indicates the overall bullish or bearish sentiment on that timeframe.
Exponential Moving Averages (EMAs)
- Purpose : Provide dynamic support and resistance levels.
- Colors :
- EMA 10 : Lime
- EMA 20 : Yellow
- EMA 50 : Orange
- EMA 100 : Red
- EMA 200 : Purple
Trendlines
- Purpose : Visual representation of support and resistance levels based on pivot points.
- Interpretation :
- Upward Trendlines : Colored green , indicating support levels.
- Downward Trendlines : Colored red , indicating resistance levels.
- Note : Trendlines are drawn using the library from Simple Trendlines .
---
Utility of Market Sentiment
The indicator aggregates signals from multiple technical indicators across various timeframes to compute an overall market sentiment score . This comprehensive approach helps traders understand the prevailing market conditions by:
Confirming Trends : Multiple indicators pointing in the same direction can confirm the strength of a trend.
Identifying Reversals : Divergences and fractals can signal potential turning points.
Timeframe Alignment : Aligning signals across different timeframes can enhance the probability of successful trades.
---
Divergences
Divergence occurs when the price of an asset moves in the opposite direction of a technical indicator, suggesting a potential reversal.
- Bullish Divergence : Price makes a lower low, but the indicator makes a higher low.
- Bearish Divergence : Price makes a higher high, but the indicator makes a lower high.
The indicator detects divergences for:
RSI
MACD
Stochastic Oscillator
On-Balance Volume (OBV)
Money Flow Index (MFI)
Accumulation/Distribution Line (A/D Line)
By identifying these divergences, traders can spot early signs of trend reversals and adjust their strategies accordingly.
---
Trendlines
Trendlines are essential tools for identifying support and resistance levels. The indicator automatically draws trendlines based on pivot points:
- Upward Trendlines (Support) : Connect higher lows, indicating an uptrend.
- Downward Trendlines (Resistance) : Connect lower highs, indicating a downtrend.
These trendlines help traders visualize the trend direction and potential breakout or reversal points.
---
Super Trend Reversals (ST Reversal)
The core idea behind the Super Trend Reversals indicator is to assess the momentum of automated trading bots (often referred to as 'Supertrend bots') that enter the market during critical turning points. Specifically, the indicator is tuned to identify when the market is nearing bottoms or peaks, just before it shifts direction based on the triggered Supertrend signals. This approach helps traders:
Engage Early : Enter the market as reversal momentum builds up.
Optimize Entries and Exits : Enter under favorable conditions and exit before momentum wanes.
By capturing these reversal points, traders can enhance their trading performance.
---
Conclusion
The Swiss Knife indicator serves as a versatile tool that combines multiple technical analysis methods into a single, comprehensive indicator. By assessing various aspects of the market—including trend direction, momentum, volume, and price action—it provides traders with valuable insights to make informed trading decisions.
---
Citations
- Divergence Detection Library : Divergence Indicator by DevLucem
- Trendline Drawing Library : Simple Trendlines by HoanGhetti
---
Note : This indicator is intended for informational purposes and should be used in conjunction with other analysis techniques. Always perform due diligence before making trading decisions.
---

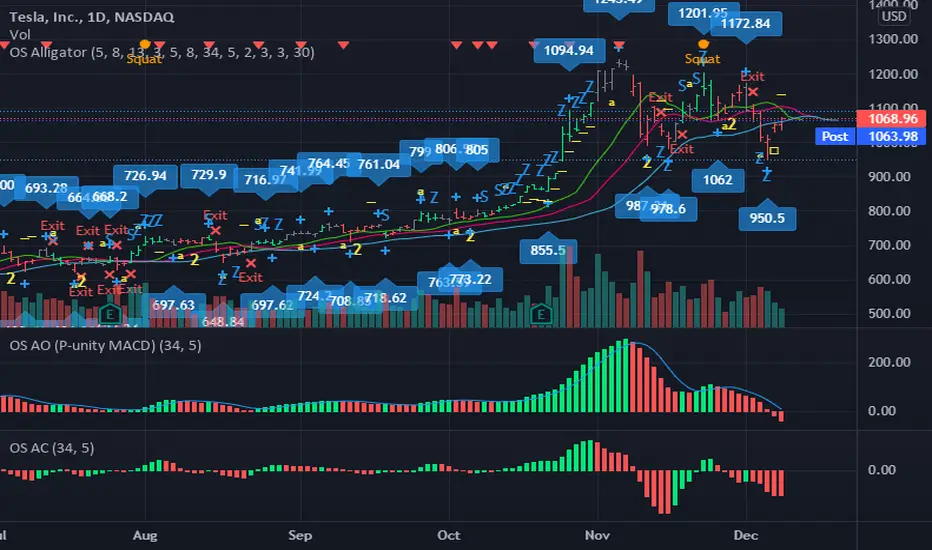
OS AlligatorOS Alligator includes Bill and Justine Williams´ indicators explained both in their "New Trading Dimensions" and "Trading Chaos: Second Edition" books. This script replicates the visual alerts shown on their graphs.
OS Alligator includes:
- Fractals (with labels for easy reading)
- Divergent Bars (signaled by top and bottom triangles)
- Zone bar colors (the bar is green when both AO and AC are green, red when both are red, and black when different)
- Zone buys and sells (subsequent AO of the same color), with letter Z
- Saucer buys and sells, with letter S
- Highest High and Lowest Low tracking (for traling stop setting)
- Balance line (Teeth) crossover alerts
and of course the Alligator's Mouth (Lips, Teeth, Jaw) with SMMA.
All these functions are customizable both in periods and in color. For example if you want to modify the Fractal or HiLo periods you can do so.
You can also add alerts based on any or all indicators.
Thank you for reading. Any comments for improvement are welcome.
-ownsov
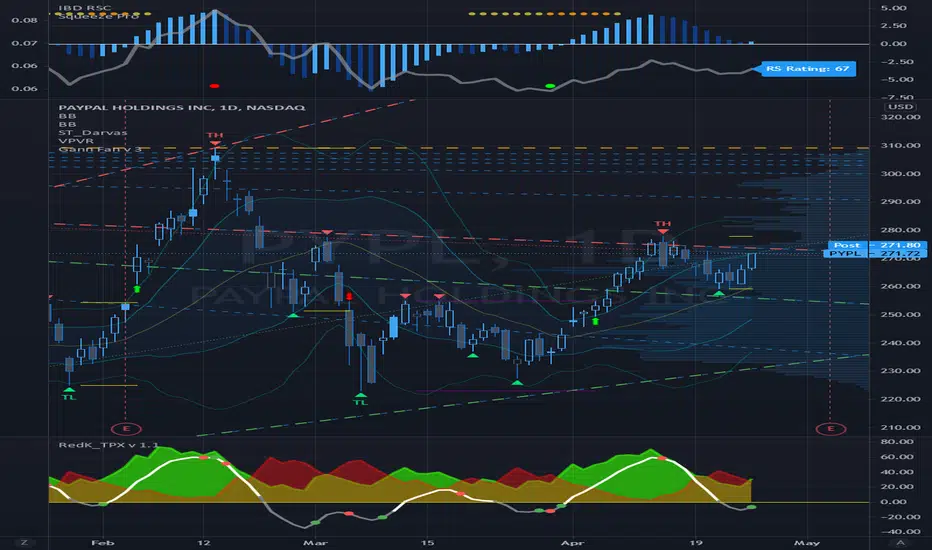
Gann Fan Analysis v 3.0The openness of this community is amazing and I have gained a lot from being a member. Hopefully you think this is useful so I can give something back.
This indicator constructs a reference framework of Support and Resistance levels based on Gann Fan ratios. Two fans are created: Support or Bullish fan, and a Resistance or Bearish fan. The origin of the analysis is the lowest pivot in the analysis window set by the length input. The upper bound of the analysis is the highest pivot in the analysis window. This is the only user input that affects the fan calculation. The remaining user input controls the visualization of the fans. The fan calculations are updated as the high and low within the analysis window change. The resistance fan range is based on an assumed 70% retracement.
Indicator also highlights the active Support and Resistance lines of each fan. An alert is also included, based on the price crossing one of these active levels.
Currently I can't figure out how to get the analysis to extend beyond 278 or so bars (not sure what the limitation is) so it isn't really useful for intraday timeframes, but it is reliable on daily and above. I use it on a Weekly view with the analysis length set to 52, and on a daily timeframe with the length set to 260.
I included fractal visualization using Ricardo Santos' Fractals v9 script as a means of confirming the Gann Fan pivots. The two methods seems to correlate well, in my opinion.
The coding is terrible, I'm sure, so please overlook that as this my first complex effort. I'm a total amateur!
Phantom Trend IndicatorOverview
The Phantom Trend Indicator (PTI) is a streamlined tool for identifying trend direction and strength. It blends zigzag-based trend detection with a volume profile to display a histogram showing price distance from the Point of Control (POC). Six distinct colors highlight trend states, with background highlights for extreme price zones. Ideal for stocks, forex, crypto, and futures across any timeframe.
Features:
Trend Detection: Uses zigzag fractals to identify uptrends and downtrends.
Histogram Colors: Six colors for trend strength (low, high, extreme for up/down trends) or neutral (gray).
Dynamic Levels: Plots POC, Value Area Low (VAL), and High (VAH) via volume profile.
Background Colors: Highlights overbought (above VAH) or oversold (below VAL) zones.
Alerts: Signals new trends.
How It Works:
Trends: Zigzag fractals define trend ranges, with price position setting histogram colors (low, high, or extreme).
Histogram: Shows price deviation from POC.
Background: Colors extreme zones outside VAL/VAH.
This indicator builds on traditional trend detectors and volume profiles by integrating them into a single, cohesive tool. Unlike standard momentum indicators that rely on moving averages, PTI uses zigzag fractals for more responsive trend identification, reducing lag in volatile markets. Compared to basic volume profile scripts, it adds trend-based color coding and background alerts for extremes, providing clearer visual cues for overbought/oversold conditions. The six distinct colors indicate trend strength, and customizable thresholds allow fine-tuning for different assets and timeframes, enhancing adaptability. Traders benefit from combined momentum and liquidity insights, helping spot reversals or continuations more reliably—making PTI a valuable, standalone addition for both novice and experienced users.
Settings
Trend Detector: Toggle alerts, adjust zigzag sensitivity, and set thresholds for low-to-high and extreme color transitions.
Dynamic Levels: Configure volume profile period, multiplier, accuracy, value area percent, and ATR-based channel width.
Visuals: Customize POC, VAL, VAH, and area fill colors.
Read Histogram: Uptrend colors show early, strong, or overextended moves; downtrend colors indicate early, weakening, or oversold conditions; gray for consolidation.
Background: Monitor for overbought/oversold color-coded signals.
Tune: Adjust zigzag or period settings for your timeframe/asset.
Tips
Shorten period for intraday, extend for swing trading.
Pair with other indicators for confirmation.
Notes:
Requires sufficient chart data for volume profile.
Test settings for low-volatility assets.
For informational use only, not financial advice. Test thoroughly, and happy trading!

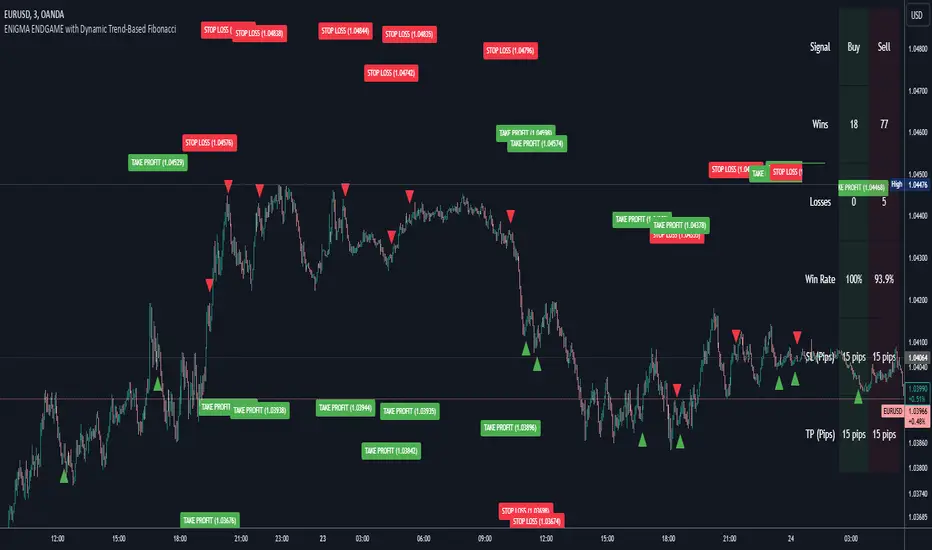
Enigma Endgame with Dynamic Trend-Based FibonacciThe Enigma Endgame script combines dynamic trend-based Fibonacci levels with the core principles of the ENIGMA strategy. It provides traders with actionable signals by identifying key levels of fractal support and resistance and highlighting opportunities to trade with market momentum. This tool is designed for multi-timeframe analysis and is especially effective during high-volatility sessions like London and New York.
Purpose and Usefulness
This script was developed to simplify complex market dynamics by integrating Fibonacci principles with ENIGMA's logic of fractal support and resistance. Traders can use it to:
- Identify key breakout and retracement levels dynamically.
- Understand the shift between support and resistance as price action evolves.
- Gain confidence in their entries with real-time signals derived from logical fractal behavior.
By merging Fibonacci levels with fractal-based trading insights, this script offers a unique and comprehensive approach to analyzing market structure.
How It Works
The script uses a dual approach to provide insights:
1. Dynamic Fibonacci Levels:
- Automatically plots Fibonacci retracement and extension levels based on recent high and low swings, adjusting dynamically to current market trends.
- Allows traders to visualize key levels where price might reverse or extend.
2. Fractal Support and Resistance Logic:
- The script identifies fractal support and resistance by analyzing candle formations.
- When a candle body closes below the low of a previous candle, the previous low, which was fractal support, now becomes fractal resistance. The script generates a bearish signal, encouraging traders to look for sell opportunities at or above the previous low.
- Conversely, when a candle body closes above the high of a previous candle, the previous high, which was fractal resistance, becomes fractal support. The script generates a bullish signal, encouraging traders to look for buy opportunities at or below the previous high.
Real-Time Signals
The script marks these transitions with arrows on the chart:
- Bearish arrows indicate broken fractal support turning into resistance.
- Bullish arrows** indicate broken fractal resistance turning into support.
These signals help traders stay aligned with the trend and trade with market momentum.
Key Features
1. Session-Based Analysis: Focuses on high-probability setups by allowing traders to customize session times, such as London or US sessions.
2. Multi-Timeframe Support: Works seamlessly across multiple timeframes for both scalpers and swing traders.
3. Real-Time Alerts: Sends customizable alerts when price interacts with critical Fibonacci levels or fractal support/resistance shifts.
How to Use the Script
1. Apply the script to a clean chart for clear visualization. Avoid combining it with other scripts unless necessary.
2. Use the arrows to identify shifts in fractal support and resistance and validate opportunities for buy/sell trades.
3. Monitor the dynamic Fibonacci levels to find confluence with key price areas.
4. Customize session times to focus on high-probability trading hours.
Key Notes for Traders
- This script provides insights based on logical market structure but should be used alongside proper risk management and trading plans.
- The fractal-based approach works well in conjunction with dynamic Fibonacci levels, helping traders build confidence in their strategy.
- Adapt the script settings to match your unique trading style and timeframe preferences.
By offering a seamless integration of fractal logic and Fibonacci principles, Enigma Endgame empowers traders with actionable insights to navigate markets effectively.
Scalping PullBack Tool R1 by JustUncleLDescription
This study project is a Scalping Pullback trading Tool that incorporates the majority of the indicators needed to analyse and scalp Trends for Pull Backs and reversals on 1min, 5min or 15min charts. The set up utilies Heikin Ashi candle charts. Incorporated within this tool are the following indicators:
1. Major industry (Banks) recognised important EMAs in an EMA Ribbon:
Green = EMA89
Blue = EMA200
Black = EMA633
2. The 36EMA (default) High/Low+Close Price Action Channel (PAC).
3. Fractals
4. HH, LH, LL, HL finder to help with drawing Trend lines and mini Trend Lines.
5. Coloured coded Bar high lighting based on the PAC:
blue = bar closed above PAC
red = bar closed below PAC
gray = bar closed inside PAC
red line = EMA36 of bar close
Setup and hints:
Set the chart to Heikin Ashi Candles.
Add "Sweetspot Gold10" indicator to the chart as well to help with support and resistance finding and shows where the important "00" and "0" lines are.
When price is above the PAC(blue bars) we are only looking to buy as price comes back to the PAC
When price is below the PAC(red bars), we are only looking to sell when price comes back to the PAC
What we’re looking for when price comes back into the PAC we draw mini Trendlines utilising the Fractals and HH/LL points to guide your TL drawing.
Now look for the trend to pull back and break the drawn TL. That's is when we place the scalp trade.
So we are looking for continuation signals in terms of a strong, momentum driven pullbacks (normally short term 10-20 pips) of the EMA36.
The other EMAs are there to check for other Pullbacks when EMA36 is broken.
Other than the SweetSpot Gold10 indicator, you should not need any other indicator to scalp the pullbacks.
References:
Fractals V8 by RicardoSantos
Price Action Trading System v0.3 by JustUncleL
SweetSpot Gold10 R1 by JustUncleL
www.swing-trade-stocks.com
www.forexstrategiesresources.com

Мой скриптinputs:
window(1),
type(0), // 0: close, 1: high low, 2: fractals up down, 3: new fractals
persistent(False),
exittype(1),
nbars(160),
adxthres(40),
nstop(3000);
vars:
currentSwingLow(0),
currentSwingHigh(0),
trailStructureValid(false),
downFractal(0),
upFractal(0),
breakStructureHigh(0),
breakStructureLow(0),
BoS_H(0),
BoS_L(0),
Regime(0),
Last_BoS_L(0),
Last_BoS_H(0),
PeakfilterX(false);
BoS(window,persistent,type,Bos_H,BoS_L,upFractal,downFractal,breakStructureHigh,breakStructureLow);
//BOS Regime
If BoS_H <> 0 then begin
Regime = 1; // Bullish
Last_BoS_H = BoS_H ;
end;
If BoS_L <> 0 Then begin
Regime = -1; // Bearish
Last_BoS_L = BoS_L ;
end;
//Entry Logic: if we are in BoS regime then wait for break swing to entry
if ADX(5) of data2 < adxthres then begin
if time>900 and Regime = 1 and EntriesToday(date)= 0 and Last_BoS_H upFractal then buy next bar at market;
end;
if time>900 and EntriesToday(date)= 0 and Regime = -1 and Last_BoS_L>downFractal then
begin
if close < downFractal then sellshort next bar at market;
end;
end;
// Exits: nbars or stoploss or at the end of the day
if marketposition <> 0 and barssinceentry >nbars then begin
sell next bar at market;
buytocover next bar at market;
end;
setstoploss(nstop);
setexitonclose;

Holographic Market Microstructure | AlphaNattHolographic Market Microstructure | AlphaNatt
A multidimensional, holographically-rendered framework designed to expose the invisible forces shaping every candle — liquidity voids, smart money footprints, order flow imbalances, and structural evolution — in real time.
---
📘 Overview
The Holographic Market Microstructure (HMS) is not a traditional indicator. It’s a visual architecture built to interpret the true anatomy of the market — a living data structure that fuses price, volume, and liquidity into one coherent holographic layer.
Instead of reacting to candles, HMS visualizes the market’s underlying micro-dynamics : where liquidity hides, where volume flows, and how structure morphs as smart money accumulates or distributes.
Designed for system-based traders, volume analysts, and liquidity theorists who demand to see the unseen — the invisible grid driving every price movement.
---
🔬 Core Analytical Modules
Microstructure Analysis
Deconstructs each bar’s internal composition to identify imbalance between aggressive buying and selling. Using a configurable Imbalance Ratio and Liquidity Threshold , the algorithm marks low-liquidity zones and price inefficiencies as “liquidity voids.”
• Detects hidden supply/demand gaps.
• Quantifies micro-level absorption and exhaustion.
• Reveals flow compression and expansion phases.
Smart Money Tracking
Applies advanced volume-rate-of-change and price momentum relationships to map institutional activity.
• Accumulation Zones – Where price rises on expanding volume.
• Distribution Zones – Where price declines on rising volume.
• Automatically visualized as glowing boxes, layered through time to simulate footprint persistence.
Fractal Structure Mapping
Reveals the recursive nature of price formation. HMS detects fractal highs/lows, then connects them into an evolving structure.
• Defines nested market structure across multiple scales.
• Maps trend progression and transition points.
• Renders with adaptive glow lines to reflect depth and strength.
Volume Heat Map
Transforms historical volume data into a 3D holographic heat projection.
• Each band represents a volume-weighted price level.
• Gradient brightness = relative participation intensity.
• Helps identify volume nodes, voids, and liquidity corridors.
HUD Display System
Real-time analytical dashboard summarizing the system’s internal metrics directly on the chart.
• Flow, Structure, Smart$, Liquidity, and Divergence — all live.
• Designed for both scalpers and swing traders to assess micro-context instantly.
---
🧠 Smart Money Intelligence Layer
The Smart Money Index dynamically evaluates the harmony (or conflict) between price momentum and volume acceleration. When institutions accumulate or distribute discreetly, volume surges ahead of price. HMS detects this divergence and overlays it as glowing smart money zones.
◈ ACCUM → Institutional absorption, early uptrend formation.
◈ DISTRIB → Distribution and top-heavy conditions.
○ IDLE → Neutral flow equilibrium.
Divergences between price and volume are signaled using holographic alerts ( ⚠ ALERT ) to highlight exhaustion or trap conditions — often precursors to structural reversals.
---
🌀 Fractal Market Structure Engine
The fractal subsystem recursively identifies local pivot symmetry, connecting micro-structural highs and lows into a holographic skeleton.
• Bullish Structure — Higher highs & higher lows align (▲ BULLISH).
• Bearish Structure — Lower highs & lower lows dominate (▼ BEARISH).
• Ranging — Fractal symmetry balance (◆ RANGING).
Each transition is visually represented through adaptive glow intensity, producing a living contour of market evolution .
---
🔥 Volume Heat Map Projection
The heatmap acts as a volumetric X-ray of the recent 100–300 bars. Each horizontal segment reflects liquidity density, rendered with gradient opacity from cold (inactive) to hot (highly active).
• Detects hidden accumulation shelves and distribution ridges.
• Identifies imbalanced liquidity corridors (voids).
• Reveals the invisible scaffolding of the order book.
When combined with smart money zones and structure lines, it creates a multi-layered holographic perspective — allowing traders to see liquidity clusters and their interaction with evolving structure in real time.
---
💎 Holographic Visual Engine
Every element of HMS is dynamically color-mapped to its visual theme . Each theme carries a distinct personality:
Aeon — Neon blue plasma aesthetic; futuristic and fluid.
Cyber — High-contrast digital energy; circuit-like clarity.
Quantum — Deep space gradients; reflective of non-linear flow.
Neural — Organic transitions; biological intelligence simulation.
Plasma — Vapor-bright gradients; high-energy reactive feedback.
Crystal — Minimalist, transparent geometry; pristine data visibility.
Optional Glow Effects and Pulse Animations create a living hologram that responds to real-time market conditions.
---
🧭 HUD Analytics Table
A live data matrix placed anywhere on-screen (top, middle, or side). It summarizes five critical systems:
Flow: Order flow bias — ▲ BUYING / ▼ SELLING / ◆ NEUTRAL.
Struct: Microstructure direction — ▲ BULLISH / ▼ BEARISH / ◆ RANGING.
Smart$: Institutional behavior — ◈ ACCUM / ◈ DISTRIB / ○ IDLE.
Liquid: Market efficiency — ⚡ VOID / ● NORMAL.
Diverg: Price/Volume correlation — ⚠ ALERT / ✓ CLEAR.
Each metric’s color dynamically adjusts according to live readings, effectively serving as a neural HUD layer for rapid interpretation.
---
🚨 Alert Conditions
Stay informed in real time with built-in alerts that trigger under specific structural or liquidity conditions.
Liquidity Void Detected — Market inefficiency or thin volume region identified.
Strong Order Flow Detected — Aggressive buying or selling momentum shift.
Smart Money Activity — Institutional accumulation or distribution underway.
Price/Volume Divergence — Volume fails to confirm price trend.
Market Structure Shift — Fractal structure flips directional bias.
---
⚙️ Customization Parameters
Adjustable Microstructure Depth (20–200 bars).
Configurable Imbalance Ratio and Liquidity Threshold .
Adaptive Smart Money Sensitivity via Accumulation Threshold (%).
Multiple Fractal Depth Layers for precise structural analysis.
Scalable Heatmap Resolution (5–20 levels) and opacity control.
Selectable HUD Position to suit personal layout preferences.
Each parameter adjusts the balance between visual clarity and data density , ensuring optimal performance across intraday and macro timeframes alike.
---
🧩 Trading Application
Identify early signs of institutional activity before breakouts.
Track structure transitions with fractal precision.
Locate hidden liquidity voids and high-value areas.
Confirm strength of trends using order-flow bias.
Detect volume-based divergences that often precede reversals.
HMS is designed not just for observation — but for contextual understanding . Its purpose is to help traders anchor strategies in liquidity and flow dynamics rather than surface-level price action.
---
🪞 Philosophy
Markets are holographic. Each candle contains a reflection of every other candle — a fractal within a fractal, a structure within a structure. The HMS is built to reveal that reflection, allowing traders to see through the market’s multidimensional fabric.
---
Developed by: AlphaNatt
Version: v6
Category: Market Microstructure | Volume Intelligence
Framework: PineScript v6 | Holographic Visualization System
Not financial advice

Uptrick: FRAMA Matrix RSIUptrick: FRAMA Matrix RSI
Introduction
The Uptrick: FRAMA Matrix RSI is a momentum-based indicator that integrates the Relative Strength Index (RSI) with the Fractal Adaptive Moving Average (FRAMA). By applying FRAMA's adaptive smoothing to RSI—and further refining it with a Zero-Lag Moving Average (ZLMA)—this script creates a refined and reliable momentum oscillator. The indicator now includes enhanced divergence detection, potential reversal signals, customizable buy/sell signal options, an internal stats table, and a fully customizable bar coloring system for an enhanced visual trading experience.
Why Combine RSI with FRAMA
Traditional RSI is a well-known momentum indicator but has several limitations. It is highly sensitive to price fluctuations, often generating false signals in choppy or volatile markets. FRAMA, in contrast, adapts dynamically to price changes by adjusting its smoothing factor based on market conditions.
By integrating FRAMA into RSI calculations, this indicator reduces noise while preserving RSI's ability to track momentum, adapts to volatility by reducing lag in trending markets and smoothing out choppiness in ranging conditions, enhances trend-following capability for more reliable momentum shifts, and refines overbought and oversold signals by adjusting to the current market structure.
With the new enhancements, such as a manual alpha input, noise filtering, divergence detection, and multiple buy/sell signal options, the indicator offers even greater flexibility and precision for traders. This combination improves the standard RSI by making it more adaptive and responsive to market changes.
Originality
This indicator is unique because it applies FRAMA's adaptive smoothing technique to RSI, creating a dynamic momentum oscillator that adjusts to different market conditions. Many traditional RSI-based indicators either use fixed smoothing methods like exponential moving averages or employ basic RSI calculations without adjusting for volatility.
This script stands out by integrating several elements, including the fractal dimension-based smoothing of FRAMA to reduce noise while retaining responsiveness, the use of Zero-Lag Moving Average smoothing to enhance trend sensitivity and reduce lag, divergence detection to highlight mismatches between price action and RSI momentum, a noise filter and manual alpha option to prevent minor fluctuations from generating false signals, customizable buy/sell signal options that let traders choose between ZLMA-based or FRAMA RSI-based signals, an internal stats table displaying real-time FRAMA calculations such as fractal dimension and the adaptive alpha factor, and a fully customizable bar coloring system to visually distinguish bullish, bearish, and neutral conditions.
Features
Adaptive FRAMA RSI
The indicator applies FRAMA to RSI values, making the momentum oscillator adaptive to volatility while filtering out noise. Unlike a traditional RSI that reacts equally to all price movements, FRAMA RSI adjusts its smoothing factor based on market structure, making it more effective for identifying true momentum shifts.
Zero-Lag Moving Average (ZLMA)
A smoothing technique that minimizes lag while preserving the responsiveness of price movements. It is applied to the FRAMA RSI to further refine signals and ensure smoother trend detection.
Bullish and Bearish Threshold Crossovers
This system compares FRAMA RSI to a user-defined threshold (default is 50). When FRAMA RSI moves above the threshold, it indicates bullish momentum, while movement below signals bearish conditions. The enhanced noise filter ensures that only significant moves trigger signals.
Noise Filter and Manual Alpha
A new noise filter input prevents tiny fluctuations from triggering false signals. In addition, a manual alpha option allows traders to override the automatically computed smoothing factor with a custom value, providing extra control over the indicator’s sensitivity.
Divergence Detection
The indicator identifies divergence patterns by comparing FRAMA RSI pivots to price action. Bullish divergence occurs when price makes a lower low while FRAMA RSI makes a higher low, and bearish divergence occurs when price makes a higher high while FRAMA RSI makes a lower high. These signals can help traders anticipate potential reversals.
Reversal Signals
Labels appear on the chart when FRAMA RSI confirms classic RSI overbought (70) or oversold (30) conditions, providing visual cues for potential trend reversals.
Buy and Sell Signal Options
Traders can now choose between two signal-generation methods. ZLMA-based signals trigger when the ZLMA of FRAMA RSI crosses key overbought (70) or oversold (30) levels, while FRAMA RSI-based signals trigger when FRAMA RSI itself crosses these levels. This added flexibility allows users to tailor the indicator to their preferred trading style.
ZLMA:
FRAMA:
Customizable Alerts
Alerts notify traders when FRAMA RSI crosses key levels, divergence signals occur, reversal conditions are met, or buy/sell signals trigger. This ensures that important trading events are not missed.
Fully Customizable Bar Coloring System
Users can color bars based on different conditions, enhancing visual clarity. Bar coloring modes include: FRAMA RSI threshold (bars change color based on whether FRAMA RSI is above or below the threshold), ZLMA crossover (bars change when ZLMA crosses overbought or oversold levels), buy/sell signals (bars change when official signals trigger), divergence (bars highlight when bullish or bearish divergence is detected), and reversals (bars indicate when RSI reaches overbought or oversold conditions confirmed by FRAMA RSI). The system also remembers the last applied bar color, ensuring a smooth visual transition.
Input Parameters and Features
Core Inputs
RSI Length (default: 14) defines the period for RSI calculations.
FRAMA Lookback (default: 16) determines the length for the FRAMA smoothing function.
RSI Bull Threshold (default: 50) sets the level above which the market is considered bullish and below which it is bearish.
Noise Filter (default: 1.0) ensures that small fluctuations do not trigger false bullish or bearish signals.
Additional Features
Show Bull and Bear Alerts (default: true) enables notifications when FRAMA RSI crosses the threshold.
Enable Divergence Detection (default: false) highlights bullish and bearish divergences based on price and FRAMA RSI pivots.
Show Potential Reversal Signals (default: false) identifies overbought (70) and oversold (30) levels as possible trend reversal points.
Buy and Sell Signal Option (default: ZLMA) allows traders to choose between ZLMA-based signals or FRAMA RSI-based signals for trade entry.
ZLMA Enhancements
ZLMA Length (default: 14) determines the period for the Zero-Lag Moving Average applied to FRAMA RSI.
Visualization Options
Show Internal Stats Table (default: false) displays real-time FRAMA calculations, including fractal dimension and the adaptive alpha smoothing factor.
Show Threshold FRAMA Signals (default: false) plots buy and sell labels when FRAMA RSI crosses the threshold level.
How It Works
FRAMA Calculation
FRAMA dynamically adjusts smoothing based on the price fractal dimension. The alpha smoothing factor is derived from the fractal dimension or can be set manually to maintain responsiveness.
RSI with FRAMA Smoothing
RSI is calculated using the user-defined lookback period. FRAMA is then applied to the RSI to make it more adaptive to volatility. Optionally, ZLMA is applied to further refine the signals and reduce lag.
Bullish and Bearish Threshold Crosses
A bullish condition occurs when FRAMA RSI crosses above the threshold, while a bearish condition occurs when it falls below. The noise filter ensures that only significant trend shifts generate signals.
Buy and Sell Signal Options
Traders can choose between ZLMA crossovers or FRAMA RSI crossovers as the basis for buy and sell signals, offering flexibility in trade entry timing.
Divergence Detection
The indicator identifies divergences where price action and FRAMA RSI momentum do not align, potentially signaling upcoming reversals.
Reversal Signal Labels
When classic RSI overbought or oversold levels are confirmed by FRAMA RSI conditions, reversal labels are added on the chart to highlight potential exhaustion points.
Bar Coloring System
Bars are dynamically colored based on various conditions such as RSI thresholds, ZLMA crossovers, buy/sell signals, divergence, and reversals, allowing traders to quickly interpret market sentiment.
Alerts and Internal Stats
Customizable alerts notify traders of key events, and an optional internal stats table displays real-time calculations (fractal dimension, alpha value, and RSI values) to help users understand the underlying dynamics of the indicator.
Summary
The Uptrick: FRAMA Matrix RSI offers an enhanced approach to momentum analysis by combining RSI with adaptive FRAMA smoothing and additional layers of signal refinement. The indicator now includes adaptive RSI smoothing to reduce noise and improve responsiveness, Zero-Lag Moving Average filtering to minimize lag, divergence and reversal detection to identify potential turning points, customizable buy/sell signal options that let traders choose between different signal methodologies, a fully customizable bar coloring system to visually distinguish market conditions, and an internal stats table for real-time insight into FRAMA calculation parameters.
Whether used for trend confirmation, divergence detection, or momentum-based strategies, this indicator provides a powerful and adaptive approach to trading.
Disclaimer
This script is for informational and educational purposes only. Trading involves risk, and past performance does not guarantee future results. Always conduct proper research and consult with a financial advisor before making trading decisions.

Pivot Points LIVE [CHE]Title:
Pivot Points LIVE Indicator
Subtitle:
Advanced Pivot Point Analysis for Real-Time Trading
Presented by:
Chervolino
Date:
September 24, 2024
Introduction
What are Pivot Points?
Definition:
Pivot Points are technical analysis indicators used to determine potential support and resistance levels in financial markets.
Purpose:
They help traders identify possible price reversal points and make informed trading decisions.
Overview of Pivot Points LIVE :
A comprehensive indicator designed for real-time pivot point analysis.
Offers advanced features for enhanced trading strategies.
Key Features
Pivot Points LIVE Includes:
Dynamic Pivot Highs and Lows:
Automatically detects and plots pivot high (HH, LH) and pivot low (HL, LL) points.
Customizable Visualization:
Multiple options to display markers, price labels, and support/resistance levels.
Fractal Breakouts:
Identifies and marks breakout and breakdown events with symbols.
Line Connection Modes:
Choose between "All Separate" or "Sequential" modes for connecting pivot points.
Pivot Extension Lines:
Extends lines from the latest pivot point to the current bar for trend analysis.
Alerts:
Configurable alerts for breakout and breakdown events.
Inputs and Configuration
Grouping Inputs for Easy Customization:
Source / Length Left / Length Right:
Pivot High Source: High price by default.
Pivot Low Source: Low price by default.
Left and Right Lengths: Define the number of bars to the left and right for pivot detection.
Colors: Customizable colors for pivot high and low markers.
Options:
Display Settings:
Show HH, LL, LH, HL markers and price labels.
Display support/resistance level extensions.
Option to show levels as a fractal chaos channel.
Enable fractal breakout/down symbols.
Line Connection Mode:
Choose between "All Separate" or "Sequential" for connecting lines.
Line Management:
Set maximum number of lines to display.
Customize line colors, widths, and styles.
Pivot Extension Line:
Visibility: Toggle the display of the last pivot extension line.
Customization: Colors, styles, and width for extension lines.
How It Works - Calculating Pivot Points
Pivot High and Pivot Low Detection:
Pivot High (PH):
Identified when a high price is higher than a specified number of bars to its left and right.
Pivot Low (PL):
Identified when a low price is lower than a specified number of bars to its left and right.
Higher Highs, Lower Highs, Higher Lows, Lower Lows:
Higher High (HH): Current PH is higher than the previous PH.
Lower High (LH): Current PH is lower than the previous PH.
Higher Low (HL): Current PL is higher than the previous PL.
Lower Low (LL): Current PL is lower than the previous PL.
Visual Elements
Markers and Labels:
Shapes:
HH and LH: Downward triangles above the bar.
HL and LL: Upward triangles below the bar.
Labels:
Optionally display the price levels of HH, LH, HL, and LL on the chart.
Support and Resistance Levels:
Extensions:
Lines extending from pivot points to indicate potential support and resistance zones.
Chaos Channels:
Display levels as a fractal chaos channel for enhanced trend analysis.
Fractal Breakout Symbols:
Buy Signals: Upward triangles below the bar.
Sell Signals: Downward triangles above the bar.
Slide 7: Line Connection Modes
All Separate Mode:
Description:
Connects pivot highs with pivot highs and pivot lows with pivot lows separately.
Use Case:
Ideal for traders who want to analyze highs and lows independently.
Sequential Mode:
Description:
Connects all pivot points in the order they occur, regardless of being high or low.
Use Case:
Suitable for identifying overall trend direction and momentum.
Pivot Extension Lines
Purpose:
Trend Continuation:
Visualize the continuation of the latest pivot point's price level.
Customization:
Colors:
Differentiate between bullish and bearish extensions.
Styles:
Solid, dashed, or dotted lines based on user preference.
Width:
Adjustable line thickness for better visibility.
Dynamic Updates:
The extension line updates in real-time as new bars form, providing ongoing trend insights.
Alerts and Notifications
Configurable Alerts:
Fractal Break Arrow:
Triggered when a breakout or breakdown occurs.
Long and Short Signals:
Specific alerts for bullish breakouts (Long) and bearish breakdowns (Short).
Benefits:
Timely Notifications:
Stay informed of critical market movements without constant monitoring.
Automated Trading Strategies:
Integrate with trading bots or automated systems for executing trades based on alerts.
Customization and Optimization
User-Friendly Inputs:
Adjustable Parameters:
Tailor pivot detection sensitivity with left and right lengths.
Color and Style Settings:
Match the indicator aesthetics to personal or platform preferences.
Line Management:
Maximum Lines Displayed:
Prevent chart clutter by limiting the number of lines.
Dynamic Line Handling:
Automatically manage and delete old lines to maintain chart clarity.
Flexibility:
Adapt to Different Markets:
Suitable for various financial instruments including stocks, forex, and cryptocurrencies.
Scalability:
Efficiently handles up to 500 labels and 100 lines for comprehensive analysis.
Practical Use Cases
Identifying Key Support and Resistance:
Entry and Exit Points:
Use pivot levels to determine optimal trade entry and exit points.
Trend Confirmation:
Validate market trends through the connection of pivot points.
Breakout and Breakdown Strategies:
Trading Breakouts:
Enter long positions when price breaks above pivot highs.
Trading Breakdowns:
Enter short positions when price breaks below pivot lows.
Risk Management:
Setting Stop-Loss and Take-Profit Levels:
Utilize pivot levels to place strategic stop-loss and take-profit orders.
Slide 12: Benefits for Traders
Real-Time Analysis:
Provides up-to-date pivot points for timely decision-making.
Enhanced Visualization:
Clear markers and lines improve chart readability and analysis efficiency.
Customizable and Flexible:
Adapt the indicator to fit various trading styles and strategies.
Automated Alerts:
Stay ahead with instant notifications on key market events.
Comprehensive Toolset:
Combines pivot points with fractal analysis for deeper market insights.
Conclusion
Pivot Points LIVE is a robust and versatile indicator designed to enhance your trading strategy through real-time pivot point analysis. With its advanced features, customizable settings, and automated alerts, it equips traders with the tools needed to identify key market levels, execute timely trades, and manage risks effectively.
Ready to Elevate Your Trading?
Explore Pivot Points LIVE and integrate it into your trading toolkit today!
Q&A
Questions?
Feel free to ask any questions or request further demonstrations of the Pivot Points LIVE indicator.

Harish Algo 2The script "Harish Algo 2" is a Pine Script-based TradingView indicator that automatically identifies significant trendlines based on fractal points and tracks price interactions with those trendlines. Key features include:
Fractal Detection: The script identifies fractal highs and lows, using a configurable fractal period, to serve as pivot points for generating trendlines. Fractal highs are marked in blue, and fractal lows are marked in red.
Dynamic Trendlines: It draws trendlines between consecutive fractal points, with a limit on the maximum number of active trendlines. The trendlines can be extended either in both directions or to the right, as per user input. The line width can also be customized.
Support/Resistance Counting: Each trendline tracks how many times the price interacts with it. If the price approaches the line from above and touches or stays near it, the line is considered a support. If the price approaches from below, it is considered a resistance. These counts are used to modify the trendline's color and appearance.
Trendlines with 2 support interactions turn green.
Trendlines with 2 resistance interactions turn red.
Trendlines with 3 or more interactions turn black.
Trendline Styling: Trendlines that extend over a long period (more than 100 bars) change to a dotted style to highlight their persistence.
Break Detection: The script monitors if the price crosses a trendline, signaling a potential breakout or breakdown. Once a trendline is broken, it stops extending further.
Trendline Removal: The script ensures that only a limited number of trendlines are active at a time. If the maximum number of trendlines is reached, the oldest trendline is removed to make space for new ones.
This indicator is designed to help traders visualize important trendlines, spot potential support and resistance levels, and detect breakouts or breakdowns based on price movement.
