ES1! vs ZB1! Exponentially Weighted CorrelationES1! vs ZB1! Exponentially Weighted Correlation
This indicator calculates and visualizes the exponentially weighted correlation between the S&P 500 E-mini futures (ES1!) and the 30-Year U.S. Treasury Bond futures (ZB1!) over a user-defined lookback period. By using an exponential moving average (EMA) approach, it emphasizes recent price movements, providing a dynamic view of the relationship between these two key financial instruments.
Features:
- Customizable Inputs: Adjust the lookback length (default: 60) and alpha (default: 0.1) to fine-tune the sensitivity of the correlation calculation.
- Exponentially Weighted Correlation: Measures the strength and direction of the relationship between ES1! and ZB1! prices, with more weight given to recent data.
- Visual Clarity: Displays correlation as colored bars (green for positive, red for negative) for quick interpretation, with reference lines at 0, +1, and -1 for context.
- Non-Overlay Design: Plotted in a separate panel below the chart to avoid cluttering price data.
How It Works:
The indicator fetches closing prices for ES1! and ZB1!, applies an EMA to smooth the data, and computes the exponentially weighted covariance and variances. The correlation is then derived and plotted as a histogram, helping traders identify whether the two markets are moving together (positive correlation), in opposite directions (negative correlation), or independently.
Use Cases:
- Market Analysis: Gauge the relationship between equity and bond markets to inform trading strategies.
- Risk Management: Monitor correlation shifts to adjust portfolio exposure.
- Intermarket Insights: Identify trends or divergences in the stock-bond dynamic for macroeconomic analysis.
Ideal for traders and analysts tracking intermarket relationships, this indicator offers a clear, responsive tool for understanding ES1! and ZB1! correlation in real-time.
Search in scripts for "Futures"

Failed Breakout DetectionThis indicator is a reverse-engineered copy of the FBD Detection indicator published by xfuturesgod. The original indicator aimed at detecting "Failed Breakdowns". This version tracks the opposite signals, "Failed Breakouts". It was coded with the ES Futures 15 minute chart in mind but may be useful on other instruments and time frames.
The original description, with terminology reversed to explain this version:
'Failed Breakouts' are a popular set up for short entries.
In short, the set up requires:
1) A significant high is made ('initial high')
2) Initial high is undercut with a new high
3) Price action then 'reclaims' the initial high by moving +8-10 points from the initial high
This script aims at detecting such set ups. It was coded with the ES Futures 15 minute chart in mind but may be useful on other instruments and time frames.
Business Logic:
1) Uses pivot highs to detect 'significant' initial highs
2) Uses amplitude threshold to detect a new high above the initial high; used /u/ben_zen script for this
3) Looks for a valid reclaim - a red candle that occurs within 10 bars of the new high
4) Price must reclaim at least 8 points for the set up to be valid
5) If a signal is detected, the initial high value (pivot high) is stored in array that prevents duplicate signals from being generated.
6) FBO Signal is plotted on the chart with "X"
7) Pivot high detection is plotted on the chart with "P" and a label
8) New highs are plotted on the chart with a red triangle
Notes:
User input
- My preference is to use the defaults as is, but as always feel free to experiment
- Can modify pivot length but in my experience 10/10 work best for pivot highs
- New high detection - 55 bars and 0.05 amplitude work well based on visual checks of signals
- Can modify the number of points needed to reclaim a high, and the # of bars limit over which this must occur.
Alerts:
- Alerts are available for detection of new highs and detection of failed breakouts
- Alerts are also available for these signals but only during 7:30PM-4PM EST - 'prime time' US trading hours
Limitations:
- Current version of the script only compares new highs to the most recent pivot high, does not look at anything prior to that
- Best used as a discretionary signal
Rolling ATR Momentum
Rolling ATR Momentum Indicator – User Manual
---
🔍 Overview
The Rolling ATR Momentum Indicator is a simple yet powerful tool designed to detect shifts in market volatility. It compares the current Average True Range (ATR) with the ATR from a previous point in time to measure how market volatility is changing.
This indicator is especially useful for:
- Spotting the beginning or fading of a momentum phase
- Filtering out low-volatility market conditions
- Enhancing timing for entries and exits in trending or breakout trades
---
📊 Key Components
✅ ATR Delta (Rolling)
- Definition: `ATR Delta = Current ATR - Past ATR`
- Inputs:
- ATR Period (default: 14): The base ATR calculation window
- Lookback Period (default: 5): How many bars ago to compare ATR
- Interpretation:
- Positive ATR Delta (Green Line): Market volatility is increasing
- Negative ATR Delta (Red Line): Market volatility is decreasing
📈 Zero Line
- A horizontal baseline at zero helps you easily see when ATR momentum shifts from negative to positive (or vice versa).
🟩/🟥 Background Color
- Green Background: ATR Delta is positive (rising volatility)
- Red Background: ATR Delta is negative (falling volatility)
🔵 Optional: ATR Reference Lines
- You can optionally display raw Current ATR and Past ATR by changing their visibility settings.
---
✅ How to Use It
Entry Timing (Futures/Options)
- Use ATR Delta as a filter:
- Only take trades when ATR Delta is positive → confirms momentum is building
- Avoid trades when ATR Delta is negative → market might be slow, sideways, or losing steam
Breakout Anticipation
- A rising ATR Delta after a tight range or consolidation can suggest that a breakout is underway
Stop-loss Strategy
- Use high ATR periods for wider stops (to avoid noise)
- Use low ATR periods for tighter stops or skip trading
---
🧠 Pro Tips
- This indicator doesn’t predict direction—combine with trend or price structure tools (like EMA, PPMA, candlesticks)
- Works best in trending or breakout environments
- Add it to multi-timeframe layouts to see volatility buildup on higher timeframes
---
⚙️ Settings
| Parameter | Description |
|----------|-------------|
| ATR Period | Length of the ATR calculation (default 14) |
| Lookback Period | How many bars back to compare ATR values |
---
🧭 Best For:
- Index futures (Nifty, BankNifty)
- Option buyers needing volatility confirmation
- Intraday & swing traders looking to trade momentum setups
---
Use the Rolling ATR Momentum indicator as your volatility radar—simple, clean, and highly effective for staying on the right side of market energy.
End of Manual

Nasdaq Risk Calculator - DTFXNasdaq Risk Calculator
This Pine Script (v5) indicator provides a dashboard-style tool for calculating trading risk based on manually input tick measurements for Nasdaq futures contracts (NQ and MNQ). Designed as an overlay on the main chart, it displays key risk metrics in a fixed-position table, allowing traders to assess contract type, lot size, risk ticks, and actual risk in dollars relative to a user-defined risk amount.
Features:
Manual Tick Input: Enter the number of ticks (e.g., from a ruler measurement) to define the price range for risk calculation.
Risk Calculation: Computes the optimal contract (NQ or MNQ), number of lots, risk ticks (half the input range), and actual risk in dollars, targeting the specified risk amount (default: $100).
Customizable Dashboard: Displays results in a single-cell table with a semi-transparent white background and gray border, positioned in one of four chart corners (Top Left, Top Right, Bottom Left, Bottom Right) via user selection.
Reset Option: Includes a toggle to clear the dashboard and start anew.
How to Use:
Add the indicator to your chart (best suited for NQ or MNQ futures).
In the settings, input your "Risk Amount ($)" and "Ticks" (e.g., 400 for a 100-point range on NQ).
Select the "Dashboard Corner" to position the table.
View the calculated risk details in the chosen corner.
Adjust inputs or reset as needed.
Notes:
NQ tick value is $5.00 (NQ_MULTIPLIER = 5.0), and MNQ tick value is $0.50 (MNQ_MULTIPLIER = 0.5).
Ideal for traders planning risk based on measured price ranges, such as support/resistance zones.

ES vs Bond ROCThis Pine Script plots the Relative Rate of Change (ROC) between the S&P 500 E-mini Futures (ES) and 30-Year Treasury Bond Futures (ZB) over a specified period. It helps identify when equities are overperforming or underperforming relative to long-term bonds—an insight often used to detect risk-on/risk-off sentiment shifts in the market.

Volume Weighted RSI (VW RSI)The Volume Weighted RSI (VW RSI) is a momentum oscillator designed for TradingView, implemented in Pine Script v6, that enhances the traditional Relative Strength Index (RSI) by incorporating trading volume into its calculation. Unlike the standard RSI, which measures the speed and change of price movements based solely on price data, the VW RSI weights its analysis by volume, emphasizing price movements backed by significant trading activity. This makes the VW RSI particularly effective for identifying bullish or bearish momentum, overbought/oversold conditions, and potential trend reversals in markets where volume plays a critical role, such as stocks, forex, and cryptocurrencies.
Key Features
Volume-Weighted Momentum Calculation:
The VW RSI calculates momentum by comparing the volume associated with upward price movements (up-volume) to the volume associated with downward price movements (down-volume).
Up-volume is the volume on bars where the closing price is higher than the previous close, while down-volume is the volume on bars where the closing price is lower than the previous close.
These volumes are smoothed over a user-defined period (default: 14 bars) using a Running Moving Average (RMA), and the VW RSI is computed using the formula:
\text{VW RSI} = 100 - \frac{100}{1 + \text{VoRS}}
where
\text{VoRS} = \frac{\text{Average Up-Volume}}{\text{Average Down-Volume}}
.
Oscillator Range and Interpretation:
The VW RSI oscillates between 0 and 100, with a centerline at 50.
Above 50: Indicates bullish volume momentum, suggesting that volume on up bars dominates, which may signal buying pressure and a potential uptrend.
Below 50: Indicates bearish volume momentum, suggesting that volume on down bars dominates, which may signal selling pressure and a potential downtrend.
Overbought/Oversold Levels: User-defined thresholds (default: 70 for overbought, 30 for oversold) help identify potential reversal points:
VW RSI > 70: Overbought, indicating a possible pullback or reversal.
VW RSI < 30: Oversold, indicating a possible bounce or reversal.
Visual Elements:
VW RSI Line: Plotted in a separate pane below the price chart, colored dynamically based on its value:
Green when above 50 (bullish momentum).
Red when below 50 (bearish momentum).
Gray when at 50 (neutral).
Centerline: A dashed line at 50, optionally displayed, serving as the neutral threshold between bullish and bearish momentum.
Overbought/Oversold Lines: Dashed lines at the user-defined overbought (default: 70) and oversold (default: 30) levels, optionally displayed, to highlight extreme conditions.
Background Coloring: The background of the VW RSI pane is shaded red when the indicator is in overbought territory and green when in oversold territory, providing a quick visual cue of potential reversal zones.
Alerts:
Built-in alerts for key events:
Bullish Momentum: Triggered when the VW RSI crosses above 50, indicating a shift to bullish volume momentum.
Bearish Momentum: Triggered when the VW RSI crosses below 50, indicating a shift to bearish volume momentum.
Overbought Condition: Triggered when the VW RSI crosses above the overbought threshold (default: 70), signaling a potential pullback.
Oversold Condition: Triggered when the VW RSI crosses below the oversold threshold (default: 30), signaling a potential bounce.
Input Parameters
VW RSI Length (default: 14): The period over which the up-volume and down-volume are smoothed to calculate the VW RSI. A longer period results in smoother signals, while a shorter period increases sensitivity.
Overbought Level (default: 70): The threshold above which the VW RSI is considered overbought, indicating a potential reversal or pullback.
Oversold Level (default: 30): The threshold below which the VW RSI is considered oversold, indicating a potential reversal or bounce.
Show Centerline (default: true): Toggles the display of the 50 centerline, which separates bullish and bearish momentum zones.
Show Overbought/Oversold Lines (default: true): Toggles the display of the overbought and oversold threshold lines.
How It Works
Volume Classification:
For each bar, the indicator determines whether the price movement is upward or downward:
If the current close is higher than the previous close, the bar’s volume is classified as up-volume.
If the current close is lower than the previous close, the bar’s volume is classified as down-volume.
If the close is unchanged, both up-volume and down-volume are set to 0 for that bar.
Smoothing:
The up-volume and down-volume are smoothed using a Running Moving Average (RMA) over the specified period (default: 14 bars) to reduce noise and provide a more stable measure of volume momentum.
VW RSI Calculation:
The Volume Relative Strength (VoRS) is calculated as the ratio of smoothed up-volume to smoothed down-volume.
The VW RSI is then computed using the standard RSI formula, but with volume data instead of price changes, resulting in a value between 0 and 100.
Visualization and Alerts:
The VW RSI is plotted with dynamic coloring to reflect its momentum direction, and optional lines are drawn for the centerline and overbought/oversold levels.
Background coloring highlights overbought and oversold conditions, and alerts notify the trader of significant crossings.
Usage
Timeframe: The VW RSI can be used on any timeframe, but it is particularly effective on intraday charts (e.g., 1-hour, 4-hour) or daily charts where volume data is reliable. Shorter timeframes may require a shorter length for increased sensitivity, while longer timeframes may benefit from a longer length for smoother signals.
Markets: Best suited for markets with significant and reliable volume data, such as stocks, forex, and cryptocurrencies. It may be less effective in markets with low or inconsistent volume, such as certain futures contracts.
Trading Strategies:
Trend Confirmation:
Use the VW RSI to confirm the direction of a trend. For example, in an uptrend, look for the VW RSI to remain above 50, indicating sustained bullish volume momentum, and consider buying on pullbacks when the VW RSI dips but stays above 50.
In a downtrend, look for the VW RSI to remain below 50, indicating sustained bearish volume momentum, and consider selling on rallies when the VW RSI rises but stays below 50.
Overbought/Oversold Conditions:
When the VW RSI crosses above 70, the market may be overbought, suggesting a potential pullback or reversal. Consider taking profits on long positions or preparing for a short entry, but confirm with price action or other indicators.
When the VW RSI crosses below 30, the market may be oversold, suggesting a potential bounce or reversal. Consider entering long positions or covering shorts, but confirm with additional signals.
Divergences:
Look for divergences between the VW RSI and price to spot potential reversals. For example, if the price makes a higher high but the VW RSI makes a lower high, this bearish divergence may signal an impending downtrend.
Conversely, if the price makes a lower low but the VW RSI makes a higher low, this bullish divergence may signal an impending uptrend.
Momentum Shifts:
A crossover above 50 can signal the start of bullish momentum, making it a potential entry point for long trades.
A crossunder below 50 can signal the start of bearish momentum, making it a potential entry point for short trades or an exit for long positions.
Example
On a 4-hour SOLUSDT chart:
During an uptrend, the VW RSI might rise above 50 and stay there, confirming bullish volume momentum. If it approaches 70, it may indicate overbought conditions, as seen near a price peak of 145.08, suggesting a potential pullback.
During a downtrend, the VW RSI might fall below 50, confirming bearish volume momentum. If it drops below 30 near a price low of 141.82, it may indicate oversold conditions, suggesting a potential bounce, as seen in a slight recovery afterward.
A bullish divergence might occur if the price makes a lower low during the downtrend, but the VW RSI makes a higher low, signaling a potential reversal.
Limitations
Lagging Nature: Like the traditional RSI, the VW RSI is a lagging indicator because it relies on smoothed data (RMA). It may not react quickly to sudden price reversals, potentially missing the start of new trends.
False Signals in Ranging Markets: In choppy or ranging markets, the VW RSI may oscillate around 50, generating frequent crossovers that lead to false signals. Combining it with a trend filter (e.g., ADX) can help mitigate this.
Volume Data Dependency: The VW RSI relies on accurate volume data, which may be inconsistent or unavailable in some markets (e.g., certain forex pairs or futures contracts). In such cases, the indicator’s effectiveness may be reduced.
Overbought/Oversold in Strong Trends: During strong trends, the VW RSI can remain in overbought or oversold territory for extended periods, leading to premature exit signals. Use additional confirmation to avoid exiting too early.
Potential Improvements
Smoothing Options: Add options to use different smoothing methods (e.g., EMA, SMA) instead of RMA for the up/down volume calculations, allowing users to adjust the indicator’s responsiveness.
Divergence Detection: Include logic to detect and plot bullish/bearish divergences between the VW RSI and price, providing visual cues for potential reversals.
Customizable Colors: Allow users to customize the colors of the VW RSI line, centerline, overbought/oversold lines, and background shading.
Trend Filter: Integrate a trend strength filter (e.g., ADX > 25) to ensure signals are generated only during strong trends, reducing false signals in ranging markets.
The Volume Weighted RSI (VW RSI) is a powerful tool for traders seeking to incorporate volume into their momentum analysis, offering a unique perspective on market dynamics by emphasizing price movements backed by significant trading activity. It is best used in conjunction with other indicators and price action analysis to confirm signals and improve trading decisions.

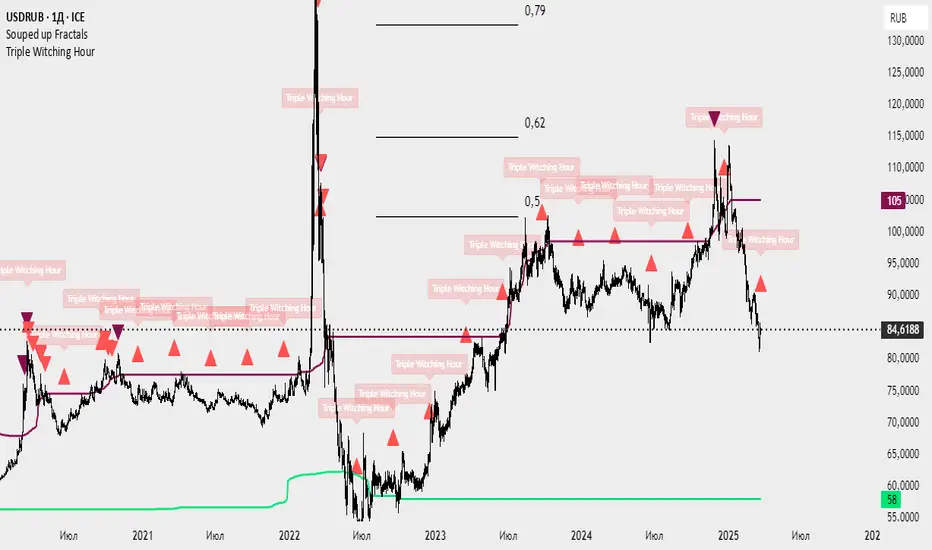
Triple Witching HourThe "Triple Witching Hour" indicator highlights the days when the quarterly expiration of stock index futures, options on futures, and options on stocks occurs simultaneously. These events, known as "Triple Witching Days," typically happen on the third Friday of March, June, September, and December. The indicator marks these days on the chart with a red triangle below the price bars and displays a label with the text "Triple Witching Hour." Traders can use this tool to identify periods of potential market volatility and adjust their strategies accordingly.
BTC: Open InterestThis indicator tracks the 7-day (default) percentage change in open interest (OI), providing insights into market participation trends. It includes customizable periods and colors, allowing traders to adjust settings for better visualization.
Open interest (OI) is the total number of active contracts (futures or options) that haven’t been closed or settled. It represents the total open positions in the market.
Thus when OI increases, more traders are entering new positions, signaling growing market interest. Conversely, when OI decreases, positions are being closed, suggesting lower trader participation or liquidation.
Attributes & Features:
Open Interest Percentage Change – Measures the 7-day % change in open interest to track market participation.
Customizable Calculation Period – Users can adjust the period (default: 7 days) for more flexible analysis.
Adjustable Colors – Allows modification of colors for better visualization.
Trend Identification – Highlights rising vs. falling open interest trends.
Works Across Assets – Can be used for cryptos, stocks, and futures with open interest data.
Overlay or Separate Panel – Can be plotted on price chart or as a separate indicator.
How It Works:
Fetches Open Interest Data – Retrieves open interest values for each day for USD, USDT, and USDC Bitcoin Perpetual Derivitives.
Calculates Percentage Change – Compares current open interest to its value X days ago (Default = 7 days).
Standard Deviation – Applies standard deviation ranging from -2 to +2 deviations to identify large shifts in OI.
Visual Alerts – Can highlight extreme increases or decreases signaling potential market shifts.
NOTE: THE INDICATOR DATA ONLY GOES BACK TO START OF 2022
TJR SEEK AND DESTROYTJR SEEK AND DESTROY – Intraday ICT Trading Tool
Built for day traders, TJR SEEK AND DESTROY combines Smart Money concepts like order blocks, fair value gaps, and liquidity sweeps with structure breaks and daily bias to pinpoint high-probability trades during US market hours (9:30–16:00). Ideal for scalping or intraday strategies on stocks, futures, or forex.
What Makes It Unique?
Unlike standalone ICT indicators, this script integrates:
Order Blocks with volume and range filters for precise support/resistance zones.
Fair Value Gaps (FVG) to spot pre-market price imbalances.
Break of Structure (BOS) and Liquidity Sweeps for trend and reversal signals.
A 1H MA-based Bias to align trades with the day’s direction.
BUY/SELL Labels triggered only when bias, BOS, and sweeps align, reducing noise.
How Does It Work?
Order Blocks: Marks zones with high volume (>1.5x 20-period SMA) and low range (<0.5x ATR20) as teal boxes—potential reversal points.
Fair Value Gap: Compares the prior day’s close to the current open (pre- or post-9:30), shown as a purple line and label (e.g., "FVG: 0.005").
Pivot Point: Calculates (prevHigh + prevLow + prevClose) / 3 from the prior day, plotted as an orange line for equilibrium.
Break of Structure: Detects crossovers of 5-bar highs/lows (gray lines), marked with red triangles.
Liquidity Sweeps: Tracks breaches of the prior day’s high/low (yellow lines), marked with yellow triangles.
Daily Bias: Uses 1H close vs. 20-period MA (blue line) for bullish (green background), bearish (red), or neutral (gray) context.
Signals: BUY (green label) when bias is bullish, price breaks up, and sweeps the prior high; SELL (red label) when bias is bearish, price breaks down, and sweeps the prior low.
How to Use It
Setup: Apply to 1M–15M charts for US session trading (9:30–16:00 EST).
Trading:
Wait for a BUY label after a yellow sweep triangle above the prior day’s high in a green (bullish) background.
Wait for a SELL label after a yellow sweep triangle below the prior day’s low in a red (bearish) background.
Use order blocks (teal boxes) as support/resistance for stop-loss or take-profit.
Markets: Best for SPY, ES futures, or forex pairs with US session volatility.
Underlying Concepts
Order Blocks: High-volume, low-range bars suggest institutional activity.
FVG: Gaps between close and open indicate imbalance to be filled.
BOS & Sweeps: Price breaking key levels signals momentum or stop-hunting.
Bias: 1H MA filters trades by broader trend.
Chart Setup
Displays order blocks (teal boxes), pivot (orange), open (purple), bias (colored background), BOS/sweeps (triangles), and signals (labels). Keep other indicators off for clarity.

Casa_VolumeProfileSessionLibrary "Casa_VolumeProfileSession"
Analyzes price and volume during regular trading hours to provide a session volume profile,
including Point of Control (POC), Value Area High (VAH), and Value Area Low (VAL).
Calculates and displays these levels historically and for the developing session.
Offers customizable visualization options for the Value Area, POC, histogram, and labels.
Uses lower timeframe data for increased accuracy and supports futures sessions.
The number of rows used for the volume profile can be fixed or dynamically calculated based on the session's price range and the instrument's minimum tick increment, providing optimal resolution.
calculateEffectiveRows(configuredRows, dayHigh, dayLow)
Determines the optimal number of rows for the volume profile, either using the configured value or calculating dynamically based on price range and tick size
Parameters:
configuredRows (int) : User-specified number of rows (0 means auto-calculate)
dayHigh (float) : Highest price of the session
dayLow (float) : Lowest price of the session
Returns: The number of rows to use for the volume profile
debug(vp, position)
Helper function to write some information about the supplied SVP object to the screen in a table.
Parameters:
vp (Object) : The SVP object to debug
position (string) : The position.* to place the table. Defaults to position.bottom_center
getLowerTimeframe()
Depending on the timeframe of the chart, determines a lower timeframe to grab volume data from for the analysis
Returns: The timeframe string to fetch volume for
get(volumeProfile, lowerTimeframeHigh, lowerTimeframeLow, lowerTimeframeVolume, lowerTimeframeTime, lowerTimeframeSessionIsMarket)
Populated the provided SessionVolumeProfile object with vp data on the session.
Parameters:
volumeProfile (Object) : The SessionVolumeProfile object to populate
lowerTimeframeHigh (array) : The lower timeframe high values
lowerTimeframeLow (array) : The lower timeframe low values
lowerTimeframeVolume (array) : The lower timeframe volume values
lowerTimeframeTime (array) : The lower timeframe time values
lowerTimeframeSessionIsMarket (array) : The lower timeframe session.ismarket values (that are futures-friendly)
drawPriorValueAreas(todaySessionVolumeProfile, extendYesterdayOverToday, showLabels, labelSize, pocColor, pocStyle, pocWidth, vahlColor, vahlStyle, vahlWidth, vaColor)
Given a SessionVolumeProfile Object, will render the historical value areas for that object.
Parameters:
todaySessionVolumeProfile (Object) : The SessionVolumeProfile Object to draw
extendYesterdayOverToday (bool) : Defaults to true
showLabels (bool) : Defaults to true
labelSize (string) : Defaults to size.small
pocColor (color) : Defaults to #e500a4
pocStyle (string) : Defaults to line.style_solid
pocWidth (int) : Defaults to 1
vahlColor (color) : The color of the value area high/low lines. Defaults to #1592e6
vahlStyle (string) : The style of the value area high/low lines. Defaults to line.style_solid
vahlWidth (int) : The width of the value area high/low lines. Defaults to 1
vaColor (color) : The color of the value area background. Defaults to #00bbf911)
drawHistogram(volumeProfile, bgColor, showVolumeOnHistogram)
Given a SessionVolumeProfile object, will render the histogram for that object.
Parameters:
volumeProfile (Object) : The SessionVolumeProfile object to draw
bgColor (color) : The baseline color to use for the histogram. Defaults to #00bbf9
showVolumeOnHistogram (bool) : Show the volume amount on the histogram bars. Defaults to false.
Object
Object Contains all settings and calculated values for a Volume Profile Session analysis
Fields:
numberOfRows (series int) : Number of price levels to divide the range into. If set to 0, auto-calculates based on price range and tick size
valueAreaCoverage (series int) : Percentage of total volume to include in the Value Area (default 70%)
trackDevelopingVa (series bool) : Whether to calculate and display the Value Area as it develops during the session
valueAreaHigh (series float) : Upper boundary of the Value Area - price level containing specified % of volume
pointOfControl (series float) : Price level with the highest volume concentration
valueAreaLow (series float) : Lower boundary of the Value Area
startTime (series int) : Session start time in Unix timestamp format
endTime (series int) : Session end time in Unix timestamp format
dayHigh (series float) : Highest price of the session
dayLow (series float) : Lowest price of the session
step (series float) : Size of each price row (calculated as price range divided by number of rows)
pointOfControlLevel (series int) : Index of the row containing the Point of Control
valueAreaHighLevel (series int) : Index of the row containing the Value Area High
valueAreaLowLevel (series int) : Index of the row containing the Value Area Low
lastTime (series int) : Tracks the most recent timestamp processed
volumeRows (map) : Stores volume data for each price level row (key=row number, value=volume)
ltfSessionHighs (array) : Stores high prices from lower timeframe data
ltfSessionLows (array) : Stores low prices from lower timeframe data
ltfSessionVols (array) : Stores volume data from lower timeframe data

Delta VolDelta Volume BTC - Multi Pair
Description The Delta Volume BTC - Multi Pair indicator visualizes the balance between buying and selling volume across multiple Bitcoin exchanges. By analyzing price action within each bar, it provides insight into underlying market pressure that traditional volume indicators miss. This indicator allows traders to:
Compare volume flow across Coinbase, Binance, and Binance Perpetual markets
Identify divergences between exchanges that may signal market shifts
Detect accumulation or distribution patterns through volume imbalances
View exchanges individually or in aggregate for comprehensive analysis
Calculation Methods The indicator offers three volume delta calculation methods:
VWAP Based (default):
price_range = high - low
buy_percent = (close - low) / price_range
sell_percent = (high - close) / price_range
delta = volume * (buy_percent - sell_percent)
This method distributes volume based on where price closed within the bar's range, providing a nuanced view of buying/selling pressure.
Tick Based :
delta = volume * sign(hlc3 - previous_hlc3)
This approach assigns volume based on the direction of typical price movement between bars, capturing momentum between periods.
Simple :
delta = close > open ? volume : close < open ? -volume : 0
A straightforward method that assigns positive volume to up bars and negative volume to down bars.
When Aggregate Mode is enabled, the indicator sums the volume deltas from all selected exchanges:
aggregate_delta = coinbase_delta + binance_delta + binance_perp_delta
Features
Multi-Exchange Support : Track volume delta across Coinbase, Binance, and Binance Perpetual futures
Advanced Calculation Methods : Choose between VWAP-based, tick-based, or simple volume delta algorithms
Flexible Display Options : Visualize as histogram, columns, area, or line charts
Customizable Colors : Distinct color schemes for each exchange and direction
Smoothing Options : Apply EMA, SMA, or WMA to reduce noise
Aggregate Mode : Combine all exchanges to see total market flow
How to Use
Individual Exchange Analysis : Uncheck "Aggregate Mode" to see each exchange separately, revealing where smart money may be positioning
Divergence Detection : Watch for one exchange showing buying while others show selling
Volume Trend Confirmation : Strong price moves should be accompanied by strong delta in the same direction
Liquidity Analysis : Compare spot vs futures volume delta to identify market sentiment shifts
The Delta Volume BTC - Multi Pair indicator helps identify the "hidden" buying and selling pressure that may not be apparent from price action alone, giving you an edge in understanding market dynamics across the Bitcoin ecosystem.

Trending Market Toolkit [LuxAlgo]The Trending Market Toolkit focuses exclusively on trending market structures and high-confluence, high-risk-to-reward entry models. It is designed to complement discretionary trading by offering different entry strategies based on market structure.
🔶 USAGE
In the chart above we can see how the tool detects several reversals, draws the broken trendlines, the reversal areas from which the tool starts looking for a trigger, and when it finally happens, a potential trade with risk and reward areas and the risk/reward ratio.
🔹 Detection Mode
Traders can choose between three different modes: trend only, reversal only, or both.
If both are active, reversals have priority over trends, so the tool will not detect a trend if a reversal is active.
In the chart above we can see all three modes.
🔹 Detection on Higher Timeframes
Traders can choose to identify structures on the chart timeframe or on a higher timeframe.
In the chart above, we have the SP500 futures on the 5m timeframe with different settings: chart timeframe, 30m, and 1H.
🔹 Risk And Targets
Depending on whether the high-risk/reward parameter is enabled, traders can choose between three different targets and two different stops.
The chart above shows how different choices affect the risk/reward ratio for the same potential trade on the Gold Futures 2m chart.
🔶 SETTINGS
Show: Traders can choose between Trends, Reversals or Both.
🔹 Structures
Swing Length: Number of candles to confirm a swing high or swing low. A higher number detects larger swings.
Custom Timeframe: Traders can make use of the current chart timeframe, or choose a custom timeframe.
Reversal Area Threshold: A higher number increases the reversal area.
🔹 Trades
Trade Trigger Length: Number of candles to confirm an internal high or internal low. A lower number detects smaller swings. It must be the same size or smaller than the swing length.
Target: Traders can choose between the default target (0) or two extended targets (0.27 or 0.618).
Risk to Reward Threshold: Set the minimum risk-to-reward ratio to detect trades. Use the 0 value to detect all trades.
High Risk to Reward: Enable/Disable the high risk to reward mode.

True Liquidity BlocksSo basically I've been deep diving into liquidity trading concepts similar to ICT (Inner Circle Trader) and developed an indicator that breaks down market movement through a volume-centric lens.
Key Concept:
Markets move not just by price, but by resolving trapped positions
Volume segments, not time intervals, show true market dynamics
VWAP (Volume Weighted Average Price) becomes a key structural reference
What Makes This Different:
Tracks volume segments instead of fixed time frames
Identifies "trapped" trader positions
Measures liquidity level efficiency
Color-codes bars based on nearest liquidity zone
Indicator Features:
Cyan/Red liquidity levels showing buy/sell pressure
Efficiency tracking for each level
Dynamic volume-based segmentation
Bar coloring to show nearest liquidity zone
Theoretical Inspiration: Viewed markets as energy systems where:
Positions create potential energy
Price movement resolves this energy
Trends form through systematic position liquidation
VWAP Recalculation in Each Segment:
Segment Start:
VWAP resets when volume threshold User Inputtable (600,000) is reached
Uses the last 4 price values (High, Low, Close, Close) for calculation
Weighted by volume traded during that segment
Calculation Method:
pineCopy = ta.vwap(hlcc4, na(segment_start) ? true : na, 1)
hlcc4: Combines high, low, close prices
na(segment_start): Ensures reset at new segment
Weighted by volume, not equal time intervals
Key Points:
Dynamic recalculation each segment
Reflects most recent trading activity
Provides real-time fair price reference
Tracks positioning
Essentially, VWAP resets and recalculates with each new volume segment, creating a rolling, volume-weighted average price that maps trader positioning.
BSL (Buy Side Liquidity) and SSL (Sell Side Liquidity) Explained:
When a volume segment closes relative to VWAP, it creates natural positioning traps:
BSL (Cyan) - Created when price closes BELOW THAT SEGMENT'S VWAP:
Bulls are positioned BELOW VWAP (trapped)
Shorts are positioned ABOVE VWAP (In Profit)
SSL (Red) - Created when price closes ABOVE THAT SEGMENT"S VWAP:
Bulls are positioned ABOVE VWAP (trapped)
Shorts are positioned BELOW VWAP (trapped)
Core Mechanism:
VWAP acts as a reference point for trader positioning
Trapped positions create inherent market tension
Levels expand to show accumulating pressure
Color-coded for quick identification of potential move direction
The goal: Visualize where traders are likely "stuck" and must eventually resolve their positions or liquidate other's, driving market movement.
It was just a fun experiment but If ya'll have any thoughts on it or what I could do to improve it, I would appreciate it.
Just a little note, It's optimized for futures, but if u uncheck the "Rest at Futures Open ?" setting, it allow full reign of any asset with volume data.

Binance Pseudo Funding FeeThe indicator calculates the Funding Fee for Binance based on the Premium Index provided by TradingView. The calculation formula can be found here: Binance Funding Rate Introduction . This is NOT the official rate visible on binance.com and used for settlements, but rather an estimated rate, which is inherently INACCURATE . The accuracy of the calculation heavily depends on the timeframe, with almost perfect results on minute-based timeframes.
For the most accurate calculations, you need to visit Binance Funding History and fill in the corresponding Interval , Interest Rate , and Funding Cap/Floor settings for the specific symbol in the indicator's settings. I understand this is not convenient, but for now, this is how it works.
The blue bars indicate the settlement time. Funding can be smoothed using moving averages. Both the funding rate and the moving averages are displayed using plot and are labeled, so you can set alerts on them.

Dynamic Volatility Differential Model (DVDM)The Dynamic Volatility Differential Model (DVDM) is a quantitative trading strategy designed to exploit the spread between implied volatility (IV) and historical (realized) volatility (HV). This strategy identifies trading opportunities by dynamically adjusting thresholds based on the standard deviation of the volatility spread. The DVDM is versatile and applicable across various markets, including equity indices, commodities, and derivatives such as the FDAX (DAX Futures).
Key Components of the DVDM:
1. Implied Volatility (IV):
The IV is derived from options markets and reflects the market’s expectation of future price volatility. For instance, the strategy uses volatility indices such as the VIX (S&P 500), VXN (Nasdaq 100), or RVX (Russell 2000), depending on the target market. These indices serve as proxies for market sentiment and risk perception (Whaley, 2000).
2. Historical Volatility (HV):
The HV is computed from the log returns of the underlying asset’s price. It represents the actual volatility observed in the market over a defined lookback period, adjusted to annualized levels using a multiplier of \sqrt{252} for daily data (Hull, 2012).
3. Volatility Spread:
The difference between IV and HV forms the volatility spread, which is a measure of divergence between market expectations and actual market behavior.
4. Dynamic Thresholds:
Unlike static thresholds, the DVDM employs dynamic thresholds derived from the standard deviation of the volatility spread. The thresholds are scaled by a user-defined multiplier, ensuring adaptability to market conditions and volatility regimes (Christoffersen & Jacobs, 2004).
Trading Logic:
1. Long Entry:
A long position is initiated when the volatility spread exceeds the upper dynamic threshold, signaling that implied volatility is significantly higher than realized volatility. This condition suggests potential mean reversion, as markets may correct inflated risk premiums.
2. Short Entry:
A short position is initiated when the volatility spread falls below the lower dynamic threshold, indicating that implied volatility is significantly undervalued relative to realized volatility. This signals the possibility of increased market uncertainty.
3. Exit Conditions:
Positions are closed when the volatility spread crosses the zero line, signifying a normalization of the divergence.
Advantages of the DVDM:
1. Adaptability:
Dynamic thresholds allow the strategy to adjust to changing market conditions, making it suitable for both low-volatility and high-volatility environments.
2. Quantitative Precision:
The use of standard deviation-based thresholds enhances statistical reliability and reduces subjectivity in decision-making.
3. Market Versatility:
The strategy’s reliance on volatility metrics makes it universally applicable across asset classes and markets, ensuring robust performance.
Scientific Relevance:
The strategy builds on empirical research into the predictive power of implied volatility over realized volatility (Poon & Granger, 2003). By leveraging the divergence between these measures, the DVDM aligns with findings that IV often overestimates future volatility, creating opportunities for mean-reversion trades. Furthermore, the inclusion of dynamic thresholds aligns with risk management best practices by adapting to volatility clustering, a well-documented phenomenon in financial markets (Engle, 1982).
References:
1. Christoffersen, P., & Jacobs, K. (2004). The importance of the volatility risk premium for volatility forecasting. Journal of Financial and Quantitative Analysis, 39(2), 375-397.
2. Engle, R. F. (1982). Autoregressive conditional heteroskedasticity with estimates of the variance of United Kingdom inflation. Econometrica, 50(4), 987-1007.
3. Hull, J. C. (2012). Options, Futures, and Other Derivatives. Pearson Education.
4. Poon, S. H., & Granger, C. W. J. (2003). Forecasting volatility in financial markets: A review. Journal of Economic Literature, 41(2), 478-539.
5. Whaley, R. E. (2000). The investor fear gauge. Journal of Portfolio Management, 26(3), 12-17.
This strategy leverages quantitative techniques and statistical rigor to provide a systematic approach to volatility trading, making it a valuable tool for professional traders and quantitative analysts.

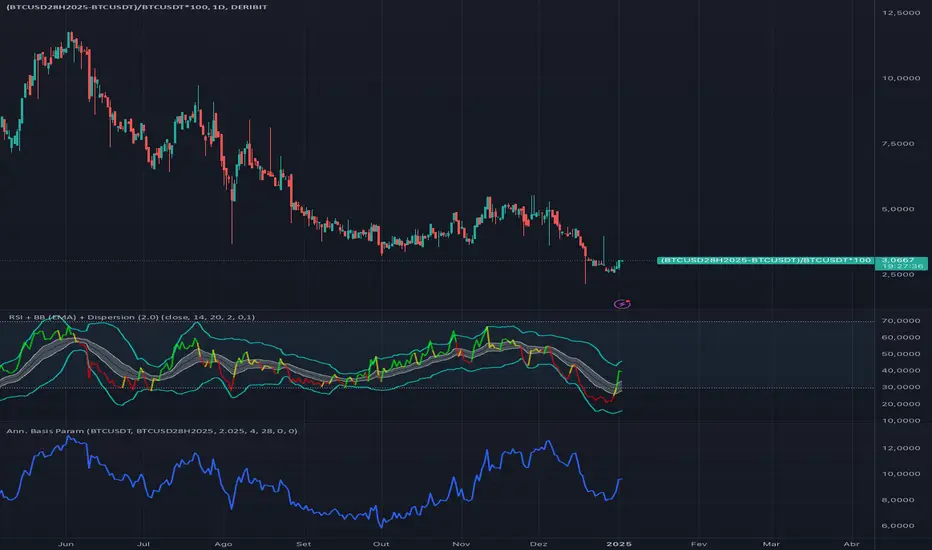
Cash and Carry: Annualized BTC Basis (Parametric)This indicator calculates the annualized BTC basis (premium or discount) between a specified futures contract and a given spot symbol. You can customize the spot ticker, the futures ticker, and the exact expiration date/time. As time moves toward expiration, the annualized yield (basis) will adjust accordingly. Ideal for monitoring potential arbitrage or cash-and-carry opportunities!
Correlated Imbalance Detector# Correlated Imbalance Detector
This indicator helps traders identify strong market movements while avoiding fakeouts by detecting correlated imbalances across two trading instruments. By requiring confirmation from correlated markets like major indices (ES, NQ) or related forex pairs, it filters out potential false signals.
## What it Does
The indicator analyzes price action patterns known as 'imbalances' on two correlated instruments simultaneously. An imbalance occurs when there's a significant gap between price levels that hasn't been filled, indicating strong buying or selling pressure. By requiring both instruments to show the same pattern, it helps eliminate false breakouts and fakeouts.
### Key Features:
- Detects bullish and bearish imbalances across two correlated instruments
- Filters out fakeouts through correlation confirmation
- Uses candlestick direction for additional validation
- Simple visual signals with customizable colors
### Signals:
- Green square: Bullish imbalance detected on both instruments
- Red square: Bearish imbalance detected on both instruments
## Avoiding Fakeouts
The indicator's core strength lies in its correlation requirement:
- A signal only appears when both instruments show the same pattern
- Reduces false signals that might appear on a single instrument
- Helps validate genuine market moves through correlation
- Particularly effective in filtering out noise in choppy markets
## Index Correlation and Bias
Major indices often show strong correlation in their movements:
- ES (S&P 500 futures) and NQ (Nasdaq futures) typically move together
- When both show the same imbalance pattern, it significantly reduces the chance of a fakeout
- Use this correlation to confirm your market bias and strengthen your trading decisions
## Settings
- Correlated Symbol: Enter the symbol you want to correlate with
- Bearish Color: Customize the color for bearish signals
- Bullish Color: Customize the color for bullish signals
## Usage Tips
1. Particularly effective with correlated indices (ES/NQ)
2. Use to confirm your existing market bias
3. Best used on higher timeframes (H1 and above)
4. Wait for confirmation from both instruments to avoid fakeouts
5. Consider overall market context when interpreting signals
6. Use the absence of correlation as a warning sign for potential fakeouts
Note: This indicator is designed to help filter out false signals through correlation. It works best as part of your broader market analysis and should align with your trading bias and strategy.

COT Report Indicator with Selectable Data TypeOverview
The COT Report Indicator with Selectable Data Types is a powerful tool for traders who want to gain deeper insights into market sentiment using the Commitment of Traders (COT) data. This indicator allows you to visualize the net positions of different participant categories—Commercial, Noncommercial, and Nonreportable—directly on your chart.
The indicator is fully customizable, allowing you to select the type of data to display, sync with your chart's timeframe, or choose a custom timeframe. Whether you're analyzing gold, crude oil, indices, or forex pairs, this indicator adapts seamlessly to your trading needs.
Features
Dynamic Data Selection:
Choose between Commercial, Noncommercial, or Nonreportable data types.
Analyze the net positions of market participants for more informed decision-making.
Flexible Timeframes:
Sync with the chart's timeframe for quick analysis.
Select a custom timeframe to view COT data at your preferred granularity.
Wide Asset Coverage:
Supports various assets, including gold, silver, crude oil, indices, and forex pairs.
Automatically adjusts to the ticker you're analyzing.
Clear Visual Representation:
Displays Net Long, Net Short, and Net Difference (Long - Short) positions with distinct colors for easy interpretation.
Error Handling:
Alerts you if the symbol is unsupported, ensuring you know when COT data isn't available for a specific asset.
How to Use
Add the Indicator:
Click "Indicators" in TradingView and search for "COT Report Indicator with Selectable Data Types."
Add it to your chart.
Customize the Settings:
Data Type: Choose between Commercial, Noncommercial, or Nonreportable positions.
Data Source: Select "Futures Only" or "Futures and Options."
Timeframe: Sync with the chart's timeframe or specify a custom one (e.g., weekly, monthly).
Interpret the Data:
Green Line: Net Long Positions.
Red Line: Net Short Positions.
Black Line: Net Difference (Long - Short).
Supported Symbols:
Gold, Silver, Crude Oil, Natural Gas, Forex Pairs, S&P 500, US30, NAS100, and more.
Who Can Benefit
Trend Followers: Identify the buying/selling trends of Commercial and Noncommercial participants.
Sentiment Analysts: Understand shifts in sentiment among major market players.
Long-Term Traders: Use COT data to confirm or contradict your fundamental analysis.
Example Use Case
For example, if you're trading gold (XAUUSD) and select Noncommercial Positions, you’ll see the long and short positions of speculators. An increase in net long positions may signal bullish sentiment, while an increase in net short positions may indicate bearish sentiment.
If you switch to Commercial Positions, you'll get insights into how hedgers and institutions are positioning themselves, helping you confirm or counterbalance your current trading strategy.
Limitations
The indicator only works with supported symbols (COT data availability is limited to specific assets).
The COT data is updated weekly, so it is not suitable for short-term intraday trading.

Low Price VolatilityI highlighted periods of low price volatility in the Nikkei 225 futures trading.
It is Japan Standard Time (JST)
This script is designed to color-code periods in the Nikkei 225 futures market according to times when prices tend to be more volatile and times when they are less volatile. The testing period is from March 11, 2024, to November 1, 2024. It identifies periods and counts where price movement exceeded half of the ATR, and colors are applied based on this data. There are no calculations involved; it simply uses the results of the analysis to apply color.

Japan Stock Market Indices Performance TableYou can display the performance of the Nikkei 225 Futures and major indices of the Japanese stock market for the day in a table format on your chart.
The 5-Minute Change Rate shows the change from the opening price of the most recent 5-minute candlestick.
The Daily Change Rate displays the change from the opening price at 09:00 GMT+9 on the current trading day.
Since the Japanese stock market opens at 09:00 GMT+9 , the values for Nikkei 225 Futures, USD/JPY, and EUR/JPY are also calculated based on their opening prices at that time. This script was created because, while brokerage apps allow you to see the comparison to the previous day's close for each index, they do not display the rate of change from the current day's opening price.
Notes:
All values are reset each trading day at 09:00 GMT+9.
If you have not purchased real-time market data from the Tokyo Stock Exchange and Osaka Exchange, data may be delayed by 20 minutes and may not display correctly.
The Tokyo Stock Exchange sector indices are distributed in real-time at 15-second intervals from the TSE, so this script aligns with that timing.
当日の日経225先物と日本株式市場の主要指数のパフォーマンスを表形式でチャート上に表示することができます。
5分変化率は直近の5分足の始値からの変化率、当日変化率は当日09:00の始値からの変化率を表示しています。
日本株式市場が開くのが GMT+9 09:00 のため、それに合わせて日経225先物、ドル円、ユーロ円も GMT+9 09:00 時点の始値を元に各値を算出しています。
各指数の前日比は証券会社のアプリで見れるものの、当日始値からの変化率が見れないため作成しました。
補足
各営業日の朝(GMT+9 09:00)に各値はリセットされます。
Tokyo Stock ExchangeとOsaka Exchangeのreal-time market dataを購入していない場合、データが20分遅れになるため正常に表示されない可能性があります。
東証業種別株価指数は東証から配信されるのが15秒間隔でのリアルタイムになるため、このスクリプトもそれに準ずる形となっています。

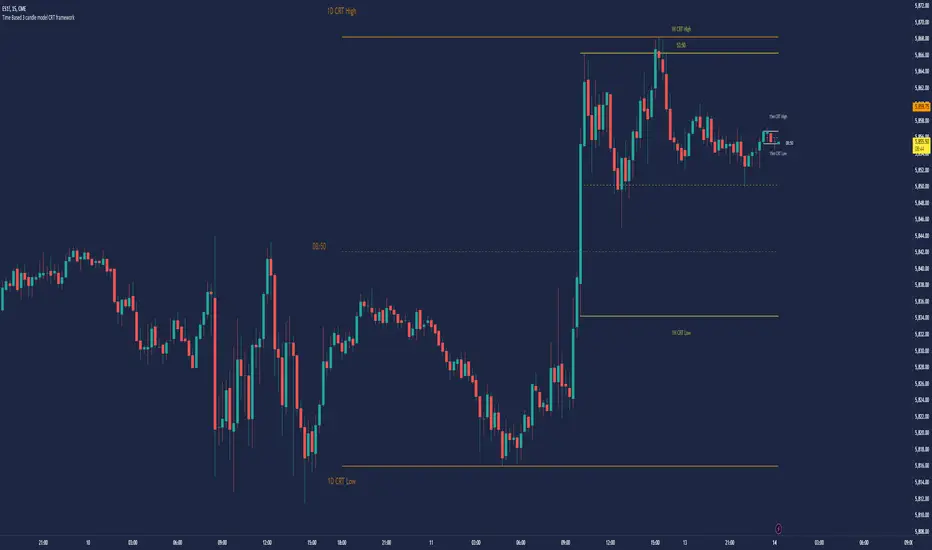
Time Based 3 Candle Model CRT FrameworkThe 3 Candle Model Overview:
The 3 Candle Model serves as a sophisticated framework for traders to navigate the complexities of financial markets, particularly within futures and forex trading. This guide not only elaborates on the model's key features but also emphasizes its originality and practical usefulness in the TradingView community. The core principle of the 3 Candle Model revolves around understanding how candle patterns can represent significant price ranges, offering valuable insights into potential market movements. By integrating the model with other critical trading concepts such as the Power of Three (PO3), Open-High-Low-Close (OHLC), and Turtle Soup setups, traders can enhance their ability to identify high-probability trades and achieve better trading outcomes.
Indicator includes:
3 Customizable Timeframe choices to fractally frame 3 candle models for precision
Live Timers for each timeframe to always be aware of the models timing
Parent Candle tracking on every preffered timeframe until new models parent candle is printed
Key Features of the 3 Candle Model
The 3 Candle Model primarily utilizes a three-candle structure, where the first candle establishes a price range, the second candle may act as a confirmation (often termed a "turtle soup"), and the third candle provides the breakout or continuation. This structure is pivotal in determining entry and exit points for trades, ensuring that each trading decision is backed by solid price action analysis.
OHLC Principle:
The Open-High-Low-Close (OHLC) concept is integral to the 3 Candle Model, allowing traders to analyze price action more effectively. Understanding the relationship between these four price points helps traders gauge market sentiment and potential reversals. By incorporating OHLC into the model, traders can develop a deeper understanding of market structure and its implications for future price movements.
Delivery States:
The 3 Candle Model emphasizes the importance of delivery states, which refer to the market's phase during specific time frames. Recognizing these states aids traders in determining the appropriate conditions for entering trades, particularly when combined with the power of three and candle range patterns. This understanding is crucial for positioning trades in alignment with market momentum.
High Probability Setups:
By aligning the 3 Candle Model with inside bar setups, traders can optimize their strategies for high-probability outcomes. This approach capitalizes on the inherent fractal nature of price movements, where previous patterns repeat at different scales. The combination of the model and inside bar setups enhances the trader's toolkit, allowing for more strategic trade placements.
Turtle Soup Formation:
The 3 Candle Model intricately connects with the Turtle Soup concept, which focuses on false breakouts. Identifying these formations at critical levels enhances the trader's ability to anticipate reversals or continuation patterns. The timing of these setups, particularly during specified times like 3:00 AM, 6:00 AM, 9:00 AM, and 1:00 PM, is crucial for maximizing trade success.
Using the 3 Candle Model in Trading
Integration with PO3:
The Power of Three (PO3) is a fundamental aspect of the 3 Candle Model that emphasizes the significance of three distinct stages of price delivery. Traders can leverage this principle by observing the initial range, confirming patterns, and executing trades during the third phase, leading to higher risk-to-reward ratios. This three-stage approach enhances a trader's ability to make informed decisions based on market behavior.
Targeting Midpoints:
Successful application of the 3 Candle Model involves targeting the midpoints of identified ranges. This practice not only provides strategic entry points but also enhances the probability of reaching desired profit levels. By targeting these midpoints, traders can refine their exit strategies and manage risk more effectively.
Aligning with Market Timing:
Timing is everything in trading. By synchronizing the 3 Candle Model setups with the aforementioned key timeframes, traders can better position themselves to exploit market dynamics. This alignment also facilitates the identification of high-quality trades that exhibit strong potential for profitability.
Prioritizing A+ Setups:
By focusing on the 3 Candle Model and its associated concepts, traders can prioritize A+ setups that exhibit a strong alignment of factors. This methodical approach enhances the quality of trades taken, leading to improved overall performance. By cultivating a strategy centered on high-probability setups, traders can maximize their return on investment.
Ensuring Originality and Usefulness
To meet the TradingView community guidelines, it is essential that this script is both original and useful. The 3 Candle Model, in its essence, is designed to provide traders with a unique perspective on market movements, free from generic or rehashed strategies. This tool integrates unique interpretations of the three-candle model and the associated strategies that are distinctly articulated and innovative.
Practical Applications: there are many practical applications of the 3 Candle Model in various trading contexts. This model in conjunction with other strategies to cultivate high-probability trade setups that can enhance performance across diverse market conditions.
Educational Value: This script is crafted with educational value in mind, providing insights that extend beyond mere trading signals. It encourages users to develop a deeper understanding of market mechanics and the interplay between price action, time, and trader psychology.
Conclusion
The 3 Candle Model provides a comprehensive framework for traders to enhance their trading strategies in the futures and forex markets. By understanding and applying the principles of this model alongside the Power of Three, OHLC concepts, and Turtle Soup formations, traders can significantly improve their ability to identify high-probability trades. The emphasis on timing, delivery states, and alignment of ranges ensures that traders are well-equipped to navigate the complexities of market movements, ultimately leading to more consistent and rewarding trading outcomes.
As trading involves risk, it is essential for traders to utilize these principles judiciously and maintain a disciplined approach to their trading strategies. By adhering to the TradingView community guidelines and emphasizing originality, usefulness, and detailed descriptions, this 3 Candle Model script stands as a valuable resource for traders seeking to refine their skills and achieve greater success in the financial markets.
Through this detailed exploration of the 3 Candle Model, traders will not only learn to recognize and exploit key patterns in price action but also appreciate the interconnectedness of various trading strategies that can significantly enhance their performance and profitability.
COT INDEX v2The **Commitment of Traders (COT)** report is a valuable tool for analyzing market sentiment, providing insight into the positions of futures traders at the close of the Tuesday trading session. Prepared by the Commodity Futures Trading Commission (CFTC), the report is published every Friday at 3:30 p.m. Eastern Time, and the data is freely available on the CFTC website.
Traders are categorized into three groups: **Commercial Traders**, **Non-Commercial Traders** (large speculators), and **Nonreportable** (small speculators). This information can be applied to charts to visualize the direction of the positions held by major market participants and to receive key COT signals.
The **COT index** ranges from 0% to 100%, reflecting market sentiment over the past 26 weeks. Extreme values, below 25% or above 75%, represent bearish or bullish sentiment, respectively. However, it is important to note that the COT index is not a timing tool but rather an indicator of the overall sentiment of major market players.
For a more tailored analysis, you can adjust the period for index calculation, customize chart styles, and highlight extreme areas.

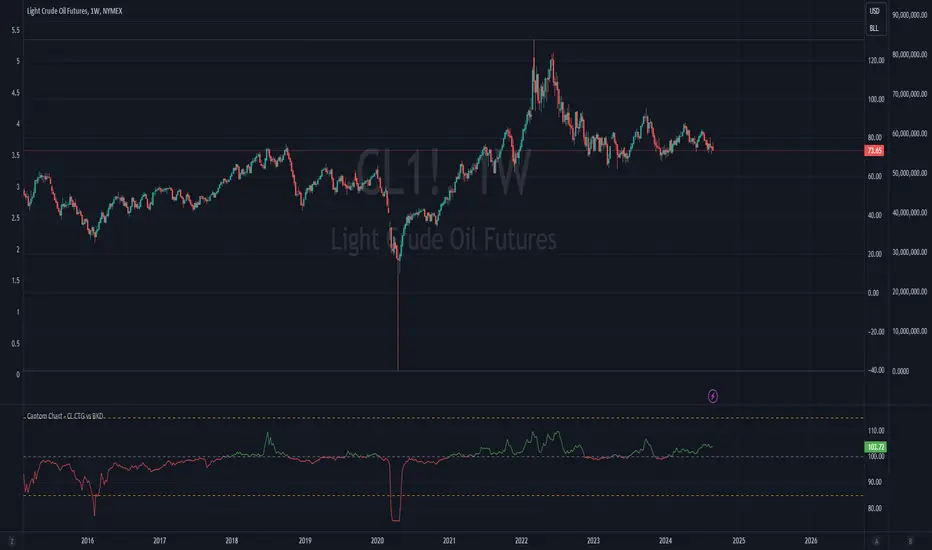
Cantom Chart - CL CTG vs BKDEnglish : This Pine Script indicator, named "Cantom Chart - CL CTG vs BKD," uniquely analyzes the immediate state of oil futures contracts to determine if they are in contango or backwardation. The script uses the price ratio between the nearest (CL1) and the next nearest (CL2) NYMEX crude oil futures contracts. It multiplies this ratio by 100 for clarity and scales fluctuations for enhanced visibility.
Key Features:
Dynamic Ratio Calculation: Computes the ratio (CL1/CL2 * 100) to determine the immediate market state.
Market State Interpretation: A ratio above 100 indicates backwardation, suggesting higher demand than supply, while a ratio below 100 indicates contango, suggesting higher supply than demand.
Volatility Adjustment: Amplifies market state changes by tripling the deviation from the baseline of 100, making it easier to observe subtle shifts.
Anomaly Detection: Caps the adjusted ratio at 125 for highs and 75 for lows, maintaining these limits until the ratio returns to normal levels.
Usage: This indicator is especially useful for traders analyzing supply-demand dynamics and inflationary pressures in the oil market. To apply it, simply add the script to your TradingView chart and adjust the 'Lower Threshold' and 'Upper Threshold' lines as needed based on your trading strategy.
-----
日本語 : この「Cantom Chart - CL CTG vs BKD」Pine Scriptインジケーターは、直近の原油先物契約がコンタンゴまたはバックワーデーションにあるかを特定するための独自の分析を提供します。最近の(CL1)と次の(CL2)NYMEX原油先物契約間の価格比を使用し、この比率に100を掛けて明確性を高め、変動の視認性を向上させます。
主要機能:
動的比率計算: 市場の即時状態を判断するために比率(CL1/CL2 * 100)を計算します。
市場状態の解釈: 比率が100を超える場合はバックワーデーション(需要が供給を上回る)、100未満の場合はコンタンゴ(供給が需要を上回る)を示します。
変動調整: 基準値100からの偏差を3倍にして、微妙な変化を容易に観察できるようにします。
異常値検出: 調整された比率を高値で125、低値で75に制限し、通常のレベルに戻るまでこれらの限界を維持します。
使用方法: このインジケーターは、原油市場における需給ダイナミクスとインフレ圧力を分析するトレーダーにとって特に有用です。使用するには、このスクリプトをTradingViewチャートに追加し、トレーディング戦略に基づいて「Lower Threshold」と「Upper Threshold」のラインを必要に応じて調整します。