Mean Reversion Trading V1Overview
This is a simple mean reversion strategy that combines RSI, Keltner Channels, and MACD Histograms to predict reversals. Current parameters were optimized for NASDAQ 15M and performance varies depending on asset. The strategy can be optimized for specific asset and timeframe.
How it works
Long Entry (All must be true):
1. RSI < Lower Threshold
2. Close < Lower KC Band
3. MACD Histogram > 0 and rising
4. No open trades
Short Entry (All must be true):
1. RSI > Upper Threshold
2. Close > Upper KC Band
3. MACD Histogram < 0 and falling
4. No open trades
Long Exit:
1. Stop Loss: Average position size x ( 1 - SL percent)
2. Take Profit: Average position size x ( 1 + TP percent)
3. MACD Histogram crosses below zero
Short Exit:
1. Stop Loss: Average position size x ( 1 + SL percent)
2. Take Profit: Average position size x ( 1 - TP percent)
3. MACD Histogram crosses above zero
Settings and parameters are explained in the tooltips.
Important
Initial capital is set as 100,000 by default and 100 percent equity is used for trades
Search in scripts for "MACD"

Divergence & Volume ThrustThis document provides both user and technical information for the "Divergence & Volume Thrust" (DVT) Pine Script indicator.
Part 1: User Guide
1.1 Introduction
The DVT indicator is an advanced tool designed to automatically identify high-probability trading setups. It works by detecting divergences between price and key momentum oscillators (RSI and MACD).
A divergence is a powerful signal that a trend might be losing strength and a reversal is possible. To filter out weak signals, the DVT indicator includes a Volume Thrust component, which ensures that a divergence is backed by significant market interest before it alerts you.
🐂 Bullish Divergence: Price makes a new low, but the indicator makes a higher low. This suggests selling pressure is weakening.
🐻 Bearish Divergence: Price makes a new high, but the indicator makes a lower high. This suggests buying pressure is weakening.
1.2 Key Features on Your Chart
When you add the indicator to your chart, here's what you will see:
Divergence Lines:
Bullish Lines (Teal): A line will be drawn on your chart connecting two price lows that form a bullish divergence.
Bearish Lines (Red): A line will be drawn connecting two price highs that form a bearish divergence.
Solid lines represent RSI divergences, while dashed lines represent MACD divergences.
Confirmation Labels:
"Bull Div ▲" (Teal Label): This label appears below the candle when a bullish divergence is detected and confirmed by a recent volume spike. This is a high-probability buy signal.
"Bear Div ▼" (Red Label): This label appears above the candle when a bearish divergence is detected and confirmed by a recent volume spike. This is a high-probability sell signal.
Volume Spike Bars (Orange Background):
Any price candle with a faint orange background indicates that the volume during that period was unusually high (exceeding the average volume by a multiplier you can set).
1.3 Settings and Configuration
You can customize the indicator to fit your trading style. Here's what each setting does:
Divergence Pivot Lookback (Left/Right): Controls the sensitivity of swing point detection. Lower numbers find smaller, more frequent divergences. Higher numbers find larger, more significant ones. 5 is a good starting point.
Max Lookback Range for Divergence: How many bars back the script will look for the first part of a divergence pattern. Default is 60.
Indicator Settings (RSI & MACD):
You can toggle RSI and MACD divergences on or off.
Standard length settings for each indicator (e.g., RSI Length 14, MACD 12, 26, 9).
Volume Settings:
Use Volume Confirmation: The most important filter. When checked, labels will only appear if a volume spike occurs near the divergence.
Volume MA Length: The lookback period for calculating average volume.
Volume Spike Multiplier: The core of the "Thrust" filter. A value of 2.0 means volume must be 200% (or 2x) the average to be considered a spike.
Visuals: Customize colors and toggle the confirmation labels on or off.
1.4 Strategy & Best Practices
Confluence is Key: The DVT indicator is powerful, but it should not be used in isolation. Look for its signals at key support and resistance levels, trendlines, or major moving averages for the highest probability setups.
Wait for Confirmation: A confirmed signal (with a label) is much more reliable than an unconfirmed divergence line.
Context Matters: A bullish divergence in a strong downtrend might only lead to a small bounce, not a full reversal. Use the signals in the context of the overall market structure.
Set Alerts: Use the TradingView alert system with this script. Create alerts for "Confirmed Bullish Divergence" and "Confirmed Bearish Divergence" to be notified of setups automatically.

T-Virus Sentiment [hapharmonic]🧬 T-Virus Sentiment: Visualize the Market's DNA
Remember the iconic T-Virus vial from the first Resident Evil? That powerful, swirling helix of potential has always fascinated me. It sparked an idea: what if we could visualize the market's underlying health in a similar way? What if we could capture the "genetic code" of market sentiment and contain it within a dynamic, 3D indicator? This project is the result of that idea, brought to life with Pine Script.
The indicator's main goal is to measure the strength and direction of market sentiment by analyzing the "genetic code" of price action through a variety of trusted indicators. The result is displayed as a liquid level within a DNA helix, a bubble density representing buying pressure, and a T-Virus mascot that reflects the overall mood.
🧐 Core Concept: How It Works
The primary output of the indicator is the "Active %" gauge you see on the right side of the vial. This percentage represents the overall sentiment score, calculated as an average from 7 different technical analysis tools. Each tool is analyzed on every bar and assigned a score from 1 (strong bearish pressure) to 5 (strong bullish potential).
In this indicator, we re-imagine market dynamics through the lens of a viral outbreak. A strong bear market is like a virus taking hold, pulling all technical signals down into a state of weakness. Conversely, a powerful bull market is like an antiviral serum ; positive signals rise and spread toward the top of the vial, indicating that the system is being injected with strength.
This is not just another line on a chart. It's a comprehensive sentiment dashboard designed to give an immediate, at-a-glance understanding of the confluence between 7 classic technical indicators. The incredible 3D model of the vial itself was inspired by a design concept found here .
⚛️ The 4 Core Elements of T-Virus Sentiment
These four elements work in harmony to give a complete, multi-faceted picture of market sentiment. Each component tells a different part of the story.
The Virus Mascot: An instant emotional cue. This character provides the quickest possible read on the overall market mood, combining sentiment with volume pressure.
The Antiviral Serum Level: The main quantitative output. This is the liquid level in the DNA helix and the percentage gauge on the right, representing the average sentiment score from all 7 indicators.
Buy Pressure & Bubble Density: This visualizes volume flow. The density of bubbles represents the intensity of accumulation (buying) versus distribution (selling). It's the "power" behind the move.
The Signal Distribution: This shows the confluence (or dispersion) of sentiment. Are all signals bullish and clustered at the top, or are they scattered, indicating a conflicted market? The position of the indicator labels is crucial, as each is assigned to one of five distinct zones:
Base Bottom: The market is at its weakest. Signals here suggest strong bearish control and distribution.
Lower Zone: The market is still bearish, but signals may be showing early signs of accumulation or bottoming.
Neutral Core (Center): A state of balance or sideways consolidation. The market is waiting for a new direction.
Upper Zone: Bullish momentum is becoming clear. Signals are strengthening and showing bullish control.
Top Cap: The market is "heating up" with strong bullish sentiment, potentially nearing overbought conditions.
🐂🐻 The Virus Mascot: The At-a-Glance Indicator
This character acts as a shortcut to confirm market health. It combines the sentiment score with volume, preventing false confidence in a low-volume rally.
Its state is determined by a dual-check: the overall "Antiviral Serum Level" and the "Buy Pressure" must both be above 50%.
Green & Smiling: The 'all clear' signal. This means that not only is the overall technical sentiment bullish, but it's also being supported by real buying pressure. This is a sign of a healthy bull market.
Red & Angry: A warning sign. This appears if either the sentiment is weak, or a bullish sentiment is not being confirmed by buying volume. The latter could indicate a potential "bull trap" or an exhaustive move.
This mascot can be disabled from the settings page under "Virus Mascot Styling" if a cleaner look is preferred.
🫧 Bubble Density: Gauging Buy vs. Sell Pressure
The bubbles visualize the battle between buyers and sellers. There are two modes to control how this is calculated:
Mode 1: Visible Range (The 'Big Picture' View)
This default mode is best for getting a broad, contextual understanding of the current session. It dynamically analyzes the volume of every single candlestick currently visible on the screen to calculate the buy/sell pressure ratio. It answers the question: "Over the entire period I'm looking at, who is in control?" As you zoom in or out, the calculation adapts.
Mode 2: Custom Lookback (The 'Precision' View)
This mode is for traders who need to analyze short-term pressure. You can define a fixed number of recent bars to analyze, which is perfect for scalping or understanding the volume dynamics leading into a key level. It answers the question: "What is happening right now ?" In the example above, a lookback of 2 focuses only on the most recent action, clearly showing intense, immediate selling pressure (few bubbles) and a corresponding drop in the sentiment score to 29%.
ℹ️ Interactive Tooltips: Dive Deeper
We believe in transparency, not 'black box' indicators. This feature transforms the indicator from a visual aid into an active learning tool.
Simply hover the mouse over any indicator label (like EMA, OBV, etc.) to get a detailed tooltip. It will explain the specific data points and thresholds that signal met to be placed in its current zone. This helps build trust in the signals and allows users to fine-tune the indicator settings to better match their own trading style.
🎯 The Scoring Logic Breakdown
The "Antiviral Serum Level" gauge is the average score from 7 technical analysis tools. Each is graded on a 5-point scale (1=Strong Bearish to 5=Strong Bullish). Here’s a detailed, transparent look at how each "gene" is evaluated:
Relative Strength Index (RSI)
Measures momentum and overbought/oversold conditions.
Group 1 (Strong Bearish): RSI > 80 (Extreme Overbought)
Group 2 (Bearish): 70 < RSI ≤ 80 (Overbought)
Group 3 (Neutral): 30 ≤ RSI ≤ 70
Group 4 (Bullish): 20 ≤ RSI < 30 (Oversold)
Group 5 (Strong Bullish): RSI < 20 (Extreme Oversold)
Exponential Moving Averages (EMA)
Evaluates the trend's strength and structure based on the alignment of multiple EMAs (9, 21, 50, 100, 200, 250).
Group 1 (Strong Bearish): A perfect bearish sequence (9 < 21 < 50 < ...)
Group 2 (Bearish Transition): Early signs of a potential reversal (e.g., 9 > 21 but still below 50)
Group 3 (Neutral / Mixed): MAs are intertwined or showing a partial bullish sequence.
Group 4 (Bullish): A strong bullish sequence is forming (e.g., 9 > 21 > 50 > 100)
Group 5 (Strong Bullish): A perfect bullish sequence (9 > 21 > 50 > 100 > 200 > 250)
Moving Average Convergence Divergence (MACD)
Analyzes the relationship between two moving averages to gauge momentum.
Group 1 (Strong Bearish): MACD & Histogram are negative and momentum is falling.
Group 2 (Weakening Bearish): MACD is negative but the histogram is rising or positive.
Group 3 (Neutral / Crossover): A crossover event is occurring near the zero line.
Group 4 (Bullish): MACD & Histogram are positive.
Group 5 (Strong Bullish): MACD & Histogram are positive, rising strongly, and accelerating.
Average Directional Index (ADX)
Measures trend strength, not direction. The score is based on both ADX value and the dominance of DI+ vs DI-.
Group 1 (Bearish / No Trend): ADX < 20 and DI- is dominant.
Group 2 (Developing Bearish Trend): 20 ≤ ADX < 25 and DI- is dominant.
Group 3 (Neutral / Indecision): Trend is weak or DI+ and DI- are nearly equal.
Group 4 (Developing Bullish Trend): 25 ≤ ADX ≤ 40 and DI+ is dominant.
Group 5 (Strong Bullish Trend): ADX > 40 and DI+ is dominant.
Ichimoku Cloud (IKH)
A comprehensive indicator that defines support/resistance, momentum, and trend direction.
Group 1 (Strong Bearish): Price is below the Kumo, Tenkan < Kijun, and Chikou is below price.
Group 2 (Bearish): Price is inside or below the Kumo, with mixed secondary signals.
Group 3 (Neutral / Ranging): Price is inside the Kumo, often with a Tenkan/Kijun cross.
Group 4 (Bullish): Price is above the Kumo with strong primary signals.
Group 5 (Strong Bullish): All signals are aligned bullishly: price above Kumo, bullish Tenkan/Kijun cross, bullish future Kumo, and Chikou above price.
Bollinger Bands (BB)
Measures volatility and relative price levels.
Group 1 (Strong Bearish): Price is below the lower band.
Group 2 (Bearish Territory): Price is between the lower band and the basis line.
Group 3 (Neutral): Price is hovering around the basis line.
Group 4 (Bullish Territory): Price is between the basis line and the upper band.
Group 5 (Strong Bullish): Price is above the upper band.
On-Balance Volume (OBV)
Uses volume flow to predict price changes. The score is based on OBV's trend and its position relative to its moving average.
Group 1 (Strong Bearish): OBV is below its MA and falling.
Group 2 (Weakening Bearish): OBV is below its MA but showing signs of rising.
Group 3 (Neutral): OBV is very close to its MA.
Group 4 (Bullish): OBV is above its MA and rising.
Group 5 (Strong Bullish): OBV is above its MA, rising strongly, and showing signs of a volume spike.
🧭 How to Use the T-Virus Sentiment Indicator
IMPORTANT: This indicator is a sentiment dashboard , not a direct buy/sell signal generator. Its strength lies in showing confluence and providing a quick, holistic view of the market's technical health.
Confirmation Tool: Use the "Active %" gauge to confirm a trade setup from your primary strategy. For example, if you see a bullish chart pattern, a high and rising sentiment score can add confidence to your trade.
Momentum & Trend Gauge: A consistently high score (e.g., > 75%) suggests strong, established bullish momentum. A consistently low score (< 25%) suggests strong bearish control. A score hovering around 50% often indicates a ranging or indecisive market.
Divergence & Warning System: Pay attention to divergences. If the price is making new highs but the sentiment score is failing to follow or is actively decreasing, it could be an early warning sign that the underlying momentum is weakening.
⚙️ Settings & Customization
The indicator is highly customizable to fit any trading style.
Position & Anchor: Control where the vial appears on the chart.
Styling (Vial, Helix, etc.): Nearly every visual element can be color-customized.
Signals: This is where the real power is. All underlying indicator parameters (RSI length, MACD settings, etc.) can be fine-tuned to match a personal strategy. The text labels can also be disabled if the chart feels cluttered.
Enjoy visualizing the market's DNA with the T-Virus Sentiment indicator

Supertrend + MACD Trend Change with AlertsDetailed Guide
1. Indicator Overview
Purpose:
This script combines the Supertrend and MACD indicators to help you detect potential trend changes. It plots a Supertrend line (green for bullish, red for bearish) and marks the chart with shapes when a trend reversal is signaled by both indicators. In addition, it includes alert conditions so that you can be notified when a potential trend change occurs.
How It Works:
Supertrend: Uses the Average True Range (ATR) to determine dynamic support and resistance levels. When the price crosses these levels, it signals a possible change in trend.
MACD: Focuses on the crossover between the MACD line and the signal line. A bullish crossover (MACD line crossing above the signal line) suggests upward momentum, while a bearish crossover (MACD line crossing below the signal line) suggests downward momentum.
2. Supertrend Component
Key Parameters:
Factor:
Function: Multiplies the ATR to create an offset from the mid-price (hl2).
Adjustment Impact: Lower values make the indicator more sensitive (producing more frequent signals), while higher values result in fewer, more confirmed signals.
ATR Period:
Function: Sets the number of bars over which the ATR is calculated.
Adjustment Impact: A shorter period makes the ATR react more quickly to recent price changes (but can be noisy), whereas a longer period provides a smoother volatility measurement.
Trend Calculation:
The script compares the previous close with the dynamically calculated upper and lower bands. If the previous close is above the upper band, the trend is set to bullish (1); if it’s below the lower band, the trend is bearish (-1). The Supertrend line is then plotted in green for bullish trends and red for bearish trends.
3. MACD Component
Key Parameters:
Fast MA (Fast Moving Average):
Function: Represents a shorter-term average, making the MACD line more sensitive to recent price movements.
Slow MA (Slow Moving Average):
Function: Represents a longer-term average to smooth out the MACD line.
Signal Smoothing:
Function: Defines the period for the signal line, which is a smoothed version of the MACD line.
Crossover Logic:
The script uses the crossover() function to detect when the MACD line crosses above the signal line (bullish crossover) and crossunder() to detect when it crosses below (bearish crossover).
4. Combined Signal Logic
How Signals Are Combined:
Bullish Scenario:
When the MACD shows a bullish crossover (MACD line crosses above the signal line) and the Supertrend indicates a bullish trend (green line), a green upward triangle is plotted below the bar.
Bearish Scenario:
When the MACD shows a bearish crossover (MACD line crosses below the signal line) and the Supertrend indicates a bearish trend (red line), a red downward triangle is plotted above the bar.
Rationale:
By combining the signals from both indicators, you increase the likelihood that the detected trend change is reliable, filtering out some false signals.
5. Alert Functionality
Alert Setup in the Code:
The alertcondition() function is used to define conditions under which TradingView can trigger alerts.
There are two alert conditions:
Bullish Alert: Activated when there is a bullish MACD crossover and the Supertrend confirms an uptrend.
Bearish Alert: Activated when there is a bearish MACD crossover and the Supertrend confirms a downtrend.
What Happens When an Alert Triggers:
When one of these conditions is met, TradingView registers the alert condition. You can then create an alert in TradingView (using the alert dialog) and choose one of these alert conditions. Once set up, you’ll receive notifications (via pop-ups, email, or SMS, depending on your settings) whenever a trend change is signaled.
6. User Adjustments and Their Effects
Factor (Supertrend):
Adjustment: Lowering the factor increases sensitivity, resulting in more frequent signals; raising it will filter out some signals, making them potentially more reliable.
ATR Period (Supertrend):
Adjustment: A shorter ATR period makes the indicator more responsive to recent price movements (but can introduce noise), while a longer period smooths out the response.
MACD Parameters (Fast MA, Slow MA, and Signal Smoothing):
Adjustment:
Shortening the Fast MA increases sensitivity, generating earlier signals that might be less reliable.
Lengthening the Slow MA produces a smoother MACD line, reducing noise.
Adjusting the Signal Smoothing changes how quickly the signal line responds to changes in the MACD line.
7. Best Practices and Considerations
Multiple Confirmation:
Even if both indicators signal a trend change, consider confirming with additional analysis such as volume, price action, or other indicators.
Market Conditions:
These indicators tend to perform best in trending markets. In sideways or choppy conditions, you may experience more false alerts.
Backtesting:
Before applying the indicator in live trading, backtest your settings to ensure they suit your trading style and the market conditions.
Risk Management:
Always use proper risk management, including stop-loss orders and appropriate position sizing, as alerts may occasionally produce late or false signals.
Happy trading!

mr.crypto731Description:
📊 Enhanced MACD with Strong Buy/Sell Signals 🚀
This script is designed to enhance the standard MACD indicator by adding clear, strong buy and sell signals. It includes:
MACD Line: A fast-moving average that reacts quickly to price changes.
Signal Line: A slower-moving average that smooths out price fluctuations.
MACD Histogram: The difference between the MACD Line and Signal Line, helping to identify trend strength and direction.
Key Features:
Strong Buy/Sell Signals: Uses crossovers of the MACD Line and Signal Line to generate strong buy/sell signals.
Color-Coded Background: Provides visual cues with background colors to highlight strong signals.
User-Friendly Interface: Customizable settings for MACD Fast Length, Slow Length, and Signal Smoothing.

Ultimate Machine Learning MACD (Deep Learning Edition)This script is a "Deep Learning MACD" indicator that combines traditional MACD calculations with advanced machine learning techniques, including recursive feedback, adaptive learning rates, Monte Carlo simulations, and volatility-based adjustments. Here’s a breakdown of its key components:
Inputs
Lookback: The length of historical data (1000 by default) used for learning and volatility measurement.
Momentum and Volatility Weighting: Adjusts how much momentum and volatility contribute to the learning process (momentum weight: 1.2, volatility weight: 1.5).
MACD Lengths: Defines the range for MACD fast and slow lengths, starting at minimum of 1 and max of 1000.
Learning Rate: Defines how much the model learns from its predictions (very small learning rate by default).
Adaptive Learning: Enables dynamic learning rates based on market volatility.
Memory Factor: A feedback factor that determines how much weight past performance has in the current model.
Simulations: The number of Monte Carlo simulations used for probabilistic modeling.
Price Change: Calculated as the difference between the current and previous close.
Momentum: Measured using a lookback period (1000 bars by default).
Volatility: Standard deviation of closing prices.
ATR: Average true range over 14 periods for measuring market volatility.
Custom EMA Calculation
Implements an exponential moving average (EMA) formula from scratch using a recursive calculation with a smoothing factor.
Dynamic Learning Rate
Adjusts the learning rate based on market volatility. When volatility is high, the learning rate increases, and when volatility is low, it decreases. This makes the model more responsive during volatile markets and more stable during calm periods.
Error Calculation and Adjustment
Error Calculation: Measures the difference between the predicted value (via Monte Carlo simulations) and the true MACD value.
Adjust MACD Length: Uses the error to adjust the fast and slow MACD lengths dynamically, so the system can learn from market conditions.
Probabilistic Monte Carlo Simulation
Runs multiple simulations (200 by default) to generate probabilistic predictions. It uses random values weighted by momentum and volatility to simulate various market scenarios, enhancing
prediction accuracy.
MACD Calculation (Learning-Enhanced)
A custom MACD function that calculates:
Fast EMA and Slow EMA for MACD line.
Signal Line: An EMA of the MACD line.
Histogram: The difference between the MACD and signal lines.
Adaptive MACD Calculation
Adjusts the fast and slow MACD lengths based on the error from the Monte Carlo prediction.
Calculates the adaptive MACD, signal, and histogram using dynamically adjusted lengths.
Recursive Memory Feedback
Stores previous MACD values in an array (macdMemory) and averages them to create a feedback loop. This adds a "memory" to the system, allowing it to learn from past behaviors and refine future predictions.
Volatility-Based Reinforcement
Introduces a volatility reinforcement factor that influences the signal based on market conditions. It adds volatility awareness to the feedback system, making the system more reactive during high volatility periods.
Smoothed MACD
After all the adjustments, the MACD line is further smoothed based on the current market volatility, resulting in a final smoothed MACD.
Key Features
Monte Carlo Simulation: Runs multiple simulations to enhance predictions based on randomness and market behavior.
Adaptive Learning: Dynamic adjustments of learning rates and MACD lengths based on market conditions.
Recursive Feedback: Uses past data as feedback to refine the system’s predictions over time.
Volatility Awareness: Integrates market volatility into the system, making the MACD more responsive to market fluctuations.
This combination of traditional MACD with machine learning creates an adaptive indicator capable of learning from past behaviors and adjusting its sensitivity based on changing market conditions.

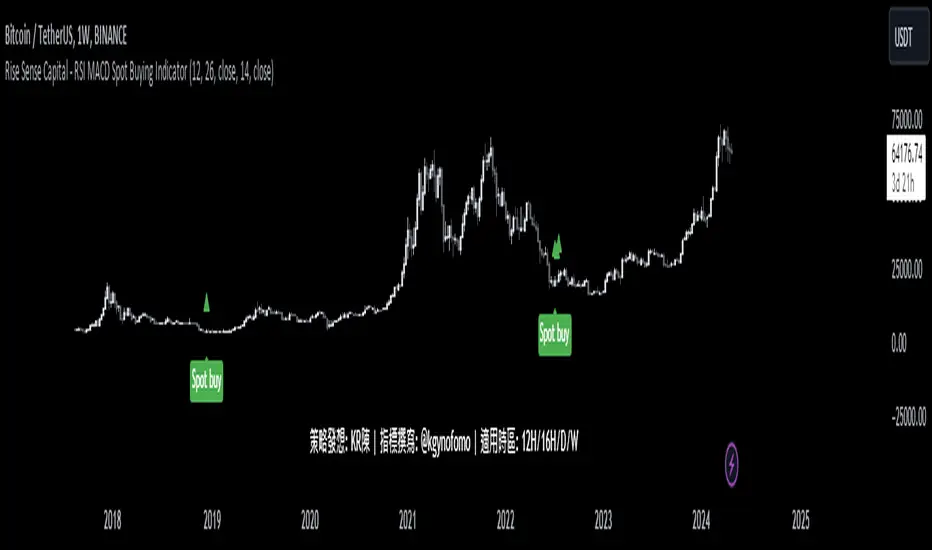
Rise Sense Capital - RSI MACD Spot Buying IndicatorToday, I'll share a spot buying strategy shared by a member @KR陳 within the DATA Trader Alliance Alpha group. First, you need to prepare two indicators:
今天分享一個DATA交易者聯盟Alpha群組裏面的群友@KR陳分享的現貨買入策略。
首先需要準備兩個指標
RSI Indicator (Relative Strength Index) - RSI is a technical analysis tool based on price movements over a period of time to evaluate the speed and magnitude of price changes. RSI calculates the changes in price over a period to determine whether the recent trend is relatively strong (bullish) or weak (bearish).
RSI指標,(英文全名:Relative Strength Index),中文稱為「相對強弱指標」,是一種以股價漲跌為基礎,在一段時間內的收盤價,用於評估價格變動的速度 (快慢) 與變化 (幅度) 的技術分析工具,RSI藉由計算一段期間內股價的漲跌變化,判斷最近的趨勢屬於偏強 (偏多) 還是偏弱 (偏空)。
MACD Indicator (Moving Average Convergence & Divergence) - MACD is a technical analysis tool proposed by Gerald Appel in the 1970s. It is commonly used in trading to determine trend reversals by analyzing the convergence and divergence of fast and slow lines.
MACD 指標 (Moving Average Convergence & Divergence) 中文名為平滑異同移動平均線指標,MACD 是在 1970 年代由美國人 Gerald Appel 所提出,是一項歷史悠久且經常在交易中被使用的技術分析工具,原理是利用快慢線的交錯,藉以判斷股價走勢的轉折。
In MACD analysis, the most commonly used values are 12, 26, and 9, known as MACD (12,26,9). The market often uses the MACD indicator to determine the future direction of assets and to identify entry and exit points.
在 MACD 的技術分析中,最常用的值為 12 天、26 天、9 天,也稱為 MACD (12,26,9),市場常用 MACD 指標來判斷操作標的的後市走向,確定波段漲幅並找到進、出場點。
Strategy analysis by member KR陳:
策略解析 by群友 KR陳 :
Condition 1: RSI value in the previous candle is below oversold zone(30).
條件1:RSI 在前一根的數值低於超賣區(30)
buycondition1 = RSI <30
Condition 2: MACD histogram changes from decreasing to increasing.
條件2:MACD柱由遞減轉遞增
buycondition2 = hist >hist and hist
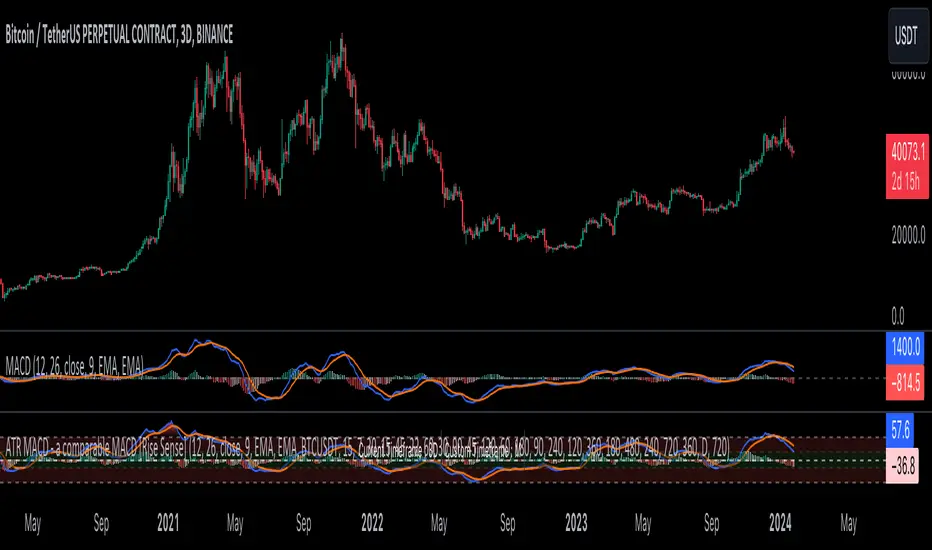
ATR MACD - a comparable MACD [Rise Sense]ATR MACD - a comparable MACD 是一位名为tonyblackwhite在知乎上发表的关于MACD的文章启发下制作的指标。这个指标克服了MACD在多个方面的痛点,例如时间变化、跨市场对比和MACD动量生命周期等问题。通过在基础上引入新功能,该指标不仅解决了这些问题,还使用户能够更轻松地比较不同时间级别和商品。
这一创新不仅提高了MACD的使用体验,而且为用户提供更便捷的获取所需信息的途径。通过解决原有MACD存在的限制,ATR MACD - a comparable MACD 为使用者提供了更为全面和灵活的分析工具,有望在MACD的应用中发挥更大的作用。
ATR MACD - a comparable MACD is an indicator created after reading an article on MACD by the author tonyblackwhite on Zhihu. This indicator overcomes various pain points of MACD, such as the MACD time change issue, cross-market MACD issue, MACD momentum lifecycle issue, and more. Building upon this foundation, it directly incorporates features that allow for comparing different timeframes and commodities, aiming to enhance users' experience in utilizing MACD and helping them effortlessly obtain desired information.
This innovation not only improves the user experience with MACD but also provides a more user-friendly way for users to compare different timeframes and commodities. By addressing the limitations of the original MACD, ATR MACD - a comparable MACD offers users a more comprehensive and flexible analytical tool, potentially playing a greater role in the application of MACD.
[PUZ] MACD MTB System MTFMACD Moving Average convergence/divergence
Here are a little articel how the MACD is calculated an how you can use it.
en.wikipedia.org
This Indicator have many differet spezifications than a normal MACD.
You can use different timeframes.
The histogramm workes a litle bit smother
The signalline have two different colors:
He is blue when the macd line is greater than the signalline and the signalline is red when the macd line is smaller than the signalline.
The macd line habe three different colores:
Color green when the macd line is greater than the macd line one period back and the macd line is under the signal line.
Color yellow when the macd line is smaller than the macd line one period back and the macd line is greater than the signalline.
Color gray when the conditions fot color yellow an green are not true
Three different types for Signals
The L1 signal show you a triange when the macd ist crossover or crossunder the signal line, you can use the L1 Threshold to filter the signals.
For example the L1 long threshold is equal to 0 than the Indicator show you only L1 long singnals when the crossover from the macd line to the signal line is smaller than 0.
This works like the same for all Signals (L2 signals / L3 signals)
The L2 signals show you a bigger triangle when the color from the macd line is eqal to yellow or green, you can use the L2 Threshold to filter the signals.
The L3 signals show you a green or red diamond when the histogramm is rising or falling, you can use the L3 Threshold to filter the signals.
Multibit Signal Compatible Indicator with DJMAD Multibit System
This Pine Script indicator is designed to function as part of the Multibit Signal System developed by DJMAD. It encompasses a comprehensive implementation of a MACD-based trading strategy with multiple threshold levels, color-coded signals, alert functionalities, and seamless compatibility with the Multibit Signal System for more sophisticated signal analysis and trading strategies.
Signal Daisychain:
Provides a configurable interface (Signal_Channel_Line1 to Signal_Channel_Line6) that allows users to select channel lines for Long and Short conditions, specifically designed for compatibility with the Multibit Signal System.
Multibit Signal Integration:
Utilizes functions from DJMAD's Signal_transcoder_library to encode and decode signals, ensuring compatibility with the Multibit Signal System for advanced signal processing and strategy development.
For more Informations about the Multibit System please look at djmad Tradingview Profile.

Price Exhaustion IndicatorThe Price Exhaustion Indicator (PE) is a powerful tool designed to identify trends weakening and strengthening in the financial markets. It combines the concepts of Average True Range (ATR), Moving Average Convergence Divergence (MACD), and Stochastic Oscillator to provide a comprehensive assessment of trend exhaustion levels. By analyzing these multiple indicators together, traders and investors can gain valuable insights into potential price reversals and long-term market highs and lows.
The aim of combining the ATR, MACD, and Stochastic Oscillator, is to provide a comprehensive analysis of trend exhaustion. The ATR component helps assess the volatility and range of price movements, while the MACD offers insights into the convergence and divergence of moving averages. The Stochastic Oscillator measures the current price in relation to its range, providing further confirmation of trend exhaustion. The exhaustion value is derived by combining the MACD, ATR, and Stochastic Oscillator. The MACD value is divided by the ATR value, and then multiplied by the Stochastic Oscillator value. This calculation results in a single exhaustion value that reflects the combined influence of these three indicators.
Application
The Price Exhaustion Indicator utilizes a unique visual representation by incorporating a gradient color scheme. The exhaustion line dynamically changes color, ranging from white when close to the midline (40) to shades of purple as it approaches points of exhaustion (overbought at 100 and oversold at -20). As the exhaustion line approaches the color purple, this represents extreme market conditions and zones of weakened trends where reversals may occur. This color gradient serves as a visual cue, allowing users to quickly gauge the strength or weakness of the prevailing trend.
To further enhance its usability, the Price Exhaustion Indicator also includes circle plots that signify potential points of trend reversion. These plots appear when the exhaustion lines cross or enter the overbought and oversold zones. Red circle plots indicate potential short entry points, suggesting a weakening trend and the possibility of a downward price reversal. Conversely, green circle plots represent potential long entry points, indicating a strengthening trend and the potential for an upward price reversal.
Traders and investors can leverage the Price Exhaustion Indicator in various ways. It can be utilized as a trend-following tool, or a mean reversion tool. When the exhaustion line approaches the overbought or oversold zones, it suggests a weakening trend and the possibility of a price reversal, helping identify potential market tops and bottoms. This can guide traders in timing their entries or exits in anticipation of a trend shift.
Utility
The Price Exhaustion Indicator is particularly useful for long-term market analysis, as it focuses on identifying long-term market highs and lows. By capturing the gradual weakening or strengthening of a trend, it assists investors in making informed decisions about portfolio allocation, trend continuation, or potential reversals.
In summary, the Price Exhaustion Indicator is a comprehensive and visually intuitive tool that combines ATR, MACD, and Stochastic Oscillator to identify trend exhaustion levels. By utilizing a gradient color scheme and circle plots, it offers traders and investors valuable insights into potential trend reversals and long-term market highs and lows. Its unique features make it a valuable addition to any trader's toolkit, providing a deeper understanding of market dynamics and assisting in decision-making processes. Please note that future performance of any trading strategy is fundamentally unknowable, and past results do not guarantee future performance.

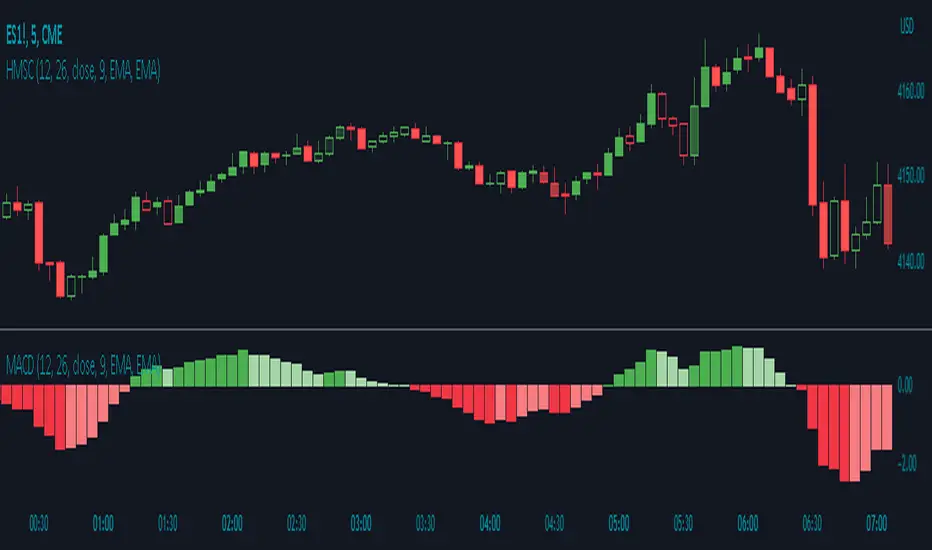
Histogram Momentum Shaded CandlesDescription:
The Histogram Momentum Shaded Candles indicator (HMSC) is a powerful technical analysis tool that combines the concepts of the MACD (Moving Average Convergence Divergence) indicator and shaded candlestick visualization. It provides insights into momentum and trend strength by representing the MACD histogram as shaded candles on the chart.
How it Works:
The HMSC indicator calculates the MACD (Moving Average Convergence Divergence) using user-defined parameters such as the fast length, slow length, source, signal smoothing, and moving average types. It then calculates the MACD histogram by subtracting the signal line from the MACD line. The indicator transforms the histogram values into transparency levels for the shaded candles, representing bullish and bearish momentum.
Usage:
To effectively utilize the Histogram Momentum Shaded Candles indicator, follow these steps:
1. Apply the HMSC indicator to your chart by adding it from the available indicators.
2. Customize the MACD settings such as the fast length, slow length, source, signal smoothing, and moving average types according to your trading preferences.
3. Observe the shaded candles plotted on the chart:
- Bullish shaded candles (green by default) indicate positive momentum and potential buying pressure.
- Bearish shaded candles (red by default) indicate negative momentum and potential selling pressure.
4. Assess the intensity of the shaded candles:
5. Shading intensity is determined by the magnitude of the MACD histogram, with higher values resulting in more opaque candles.
6. The shading intensity reflects the strength of momentum and can help identify significant shifts in price action.
7. Combine the analysis of shaded candles with traditional candlestick patterns, trend lines, support and resistance levels, and other technical indicators to validate potential trade setups.
8. Implement appropriate risk management strategies, including setting stop-loss orders and position sizing, to manage your trades effectively and protect your capital.
SynthSAR ConfirmationThis indicator represents confirmation of a trend based on the PSAR indicator and includes signals from the MACD, stochastic oscillator, and awesome oscillator. It displays the points of the parabolic SAR on the chart, which help determine the direction of the trend. Additionally, the indicator allows for tracking signals based on the combined analysis of three other technical indicators: MACD, stochastic oscillator, and awesome oscillator. Furthermore, the indicator includes the ability to display buy/sell labels and signals for changing the trend direction. This is not an investment recommendation.Very effective in higher timeframes.If the MACD "macd line" crosses the "signal line" from above and the Stochastic %K line crosses the %D line from above, and the last column in the Avesome Oscillator is red, then the indicator gives a signal to sell. If the MACD "macd line" crosses the "signal line" from below and the Stochastic %K line crosses the %D line from below, and the last column in the Avesome Oscillator is green, then the indicator gives a signal to buy.

SSL HYBRID AdvancedSSL HYBRID Advanced
SSL Hybrid is an Advanced version of the default SSL Hybrid by Mihkel00.
Multiple Indicators
MACD Crossover Signals
EMA 200
Bollinger Band
Bollinger Band Squeeze
ADX Crossover and ADX level
CCI Over Brought /Sold
Stochastic Over Brought /Sold
RSI Over Brought /Sold
CREDITS
QQE MOD byMihkel00
SSL Hybrid by Mihkel00
Waddah Attar Explosion by shayankm
Support Resistance LonesomeTheBlue
Indicators On Chart
QQE MOD is plotted as Dot below and above the candle and also as Background
QQE line is plotted and can be used as crossover to find trend. Flat movement of QQE is Sideways
Weak ADX is plotted as a Background color. Same can be verified using Bollinger band Squeeze.
EMA crossover can be plotted by selecting MTF MA(multi time frame moving average indicator) Area plot is provided.
CCI , Stochastic, RSI signals provided in the table option
WAE (volume indicator ) is shown in Table
EMA 200 is plotted and color Represents ADX level and direction. Plots on EMA 200 are ADX crossovers
MACD crossovers are represented by Triangles above and below Candles
Support Resistance levels are plotted (change settings)
Pivot Points are plotted (change settings)
Bollinger Bands Plotted
EMA 20 and EMA 50 plotted with AREA for additional confirmation
Buy: When the table option shows completely Blue signals in all indicators
Sell: When the table option shows completely Pink signals in all indicators
WARNING not recommended for lower time frames. Use at your own Risk.
Updates will be released shortly if any. please provide your suggestions to make it more functional indicator.

Awesome Oscillator PlusThe Awesome Oscillator is an indicator used to measure market momentum. AO calculates the difference of a 34 Period and 5 Period Simple Moving Averages. The Simple Moving Averages that are used are not calculated using closing price but rather each bar's midpoints. AO is generally used to affirm trends or to anticipate possible reversals.
The Awesome Oscillator's saucer is a trading signal that many analysts use to identify potential rapid changes in momentum. The saucer strategy involves looking for changes in three consecutive bars that are on the same side of the zero line.
AO's saucers can be either bullish or bearish. A bullish saucer can be identified when the awesome oscillator is above the zero line and there are two consecutive red bars – with the second bar being lower than the first – which are followed by a green bar.
On the other hand, a bearish saucer can be identified by two consecutive green bars below the zero line – with the second bar being lower than the first – which are immediately followed by a red bar.
Bullish saucer = Background and green arrow
Bearish saucer = Background and red arrow
Alerts can be triggered when a bullish or bearish saucer occurs.
Blue dots mean that the maximum or minimum of 150 periods has been exceeded (you can change the number of periods). Also added a signal line which can be exchanged for different moving averages.
The MACD line and histogram have a setting of Fast MA = 13, Slow MA = 21 and Signal = 8.
Added light blue dots as bullish signals (MACD line below zero and line crossing) and pink dots as bearish signals (MACD line above zero and line crossing). Alerts can be activated to notify such signals.

Midas Mk. II - Ultimate Crypto Swing>> This scrip is only meant to be used in 4hour crypto chart <<
How It Works - To swing trade in a 4 hr candles, which has a much larger range than shorter timeframe candles, the script utilizes a longer timeframe ema, sma and MACDs to account for such. When the ema and sma crosses and the rate of change of the MACD histogram is in favor of the direction, then the system provides a long/short signal.
How To Use - The script works the best when the signal is in par with other analyses (trend, harmonic patterns, etc.) This script does not provide any exit signals , so I recommend exiting when the candle breaks out of the structure, or other strategies.
Updates or revisions will be recorded in the comments. Good luck with this script!

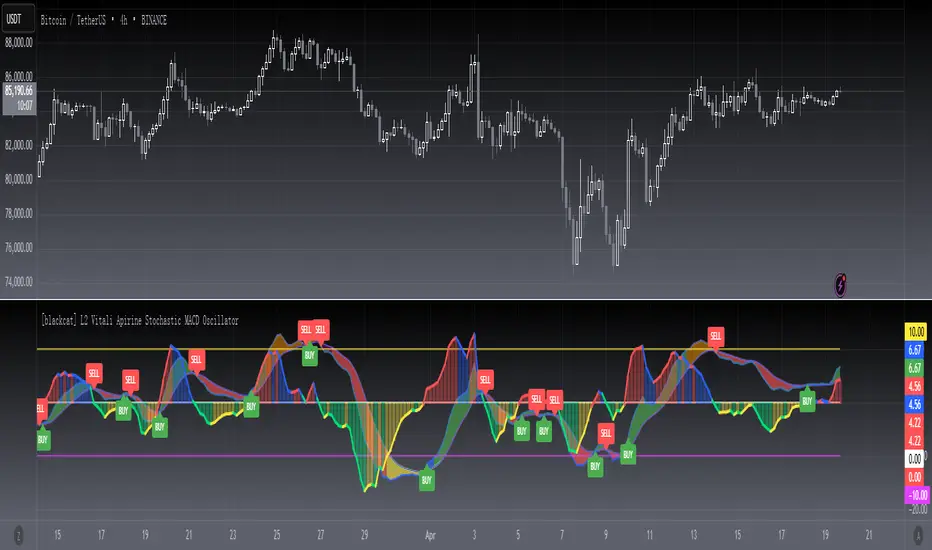
[blackcat] L2 Vitali Apirine Stochastic MACD OscillatorLevel 2
Background
Traders’ Tips of November 2019, the focus is Vitali Apirine’s article in the November issue, “The Stochastic MACD Oscillator”.
Function
In “The Stochastic MACD Oscillator” in this issue, author Vitali Apirine introduces a new indicator created by combining the stochastic oscillator and the MACD. He describes the new indicator as a momentum oscillator and explains that it allows the trader to define overbought and oversold levels similar to the classic stochastic but based on the MACD. The STMACD reflects the convergence and divergence of two moving averages relative to the high–low range over a set number of periods.
Remarks
This is a Level 2 free and open source indicator.
Feedbacks are appreciated.