Varanormal Mac N Cheez Strategy v1Mac N Cheez Strategy (Set a $200 Take profit Manually)
It's super cheesy. Strategy does the following:
Here's a detailed explanation of what the entire script does, including its key components, functionality, and purpose.
1. Strategy Setup and Input Parameters:
Strategy Name: The script is named "NQ Futures $200/day Strategy" and is set as an overlay, meaning all elements (like moving averages and signals) are plotted on the price chart.
Input Parameters:
fastLength: This sets the length of the fast moving average. The user can adjust this value, and it defaults to 9.
slowLength: This sets the length of the slow moving average. The user can adjust this value, and it defaults to 21.
dailyTarget: The daily profit target, which defaults to $200. If set to 0, this disables the daily profit target.
stopLossAmount: The fixed stop-loss amount per trade, defaulting to $100. This value is used to calculate how much you're willing to lose on a single trade.
trailOffset: This value sets the distance for a trailing stop. It helps protect profits by automatically adjusting the stop-loss as the price moves in your favor.
2. Calculating the Moving Averages:
fastMA: The fast moving average is calculated using the ta.sma() function on the close price with a period length of fastLength. The ta.sma() function calculates the simple moving average.
slowMA: The slow moving average is also calculated using ta.sma() but with the slowLength period.
These moving averages are used to determine trend direction and identify entry points.
3. Buy and Sell Signal Conditions:
longCondition: This is the buy condition. It occurs when the fast moving average crosses above the slow moving average. The script uses ta.crossover() to detect this crossover event.
shortCondition: This is the sell condition. It occurs when the fast moving average crosses below the slow moving average. The script uses ta.crossunder() to detect this crossunder event.
4. Executing Buy and Sell Orders:
Buy Orders: When the longCondition is true (i.e., fast MA crosses above slow MA), the script enters a long position using strategy.entry("Buy", strategy.long).
Sell Orders: When the shortCondition is true (i.e., fast MA crosses below slow MA), the script enters a short position using strategy.entry("Sell", strategy.short).
5. Setting Stop Loss and Trailing Stop:
Stop-Loss for Long Positions: The stop-loss is calculated as the entry price minus the stopLossAmount. If the price falls below this level, the trade is exited automatically.
Stop-Loss for Short Positions: The stop-loss is calculated as the entry price plus the stopLossAmount. If the price rises above this level, the short trade is exited.
Trailing Stop: The trail_offset dynamically adjusts the stop-loss as the price moves in favor of the trade, locking in profits while still allowing room for market fluctuations.
6. Conditional Daily Profit Target:
The script includes a daily profit target that automatically closes all trades once the total profit for the day reaches or exceeds the dailyTarget.
Conditional Logic:
If the dailyTarget is greater than 0, the strategy checks whether the strategy.netprofit (total profit for the day) has reached or exceeded the target.
If the strategy.netprofit >= dailyTarget, the script calls strategy.close_all(), closing all open trades for the day and stopping further trading.
If dailyTarget is set to 0, this logic is skipped, and the script continues trading without a daily profit target.
7. Plotting Moving Averages:
plot(fastMA): This plots the fast moving average as a blue line on the price chart.
plot(slowMA): This plots the slow moving average as a red line on the price chart. These help visualize the crossover points and the trend direction on the chart.
8. Plotting Buy and Sell Signals:
plotshape(): The script uses plotshape() to add visual markers when buy or sell conditions are met:
"Long Signal": When a buy condition (longCondition) is met, a green marker is plotted below the price bar with the label "Long".
"Short Signal": When a sell condition (shortCondition) is met, a red marker is plotted above the price bar with the label "Short".
These markers help traders quickly see when buy or sell signals occurred on the chart.
In addition, triangle markers are plotted:
Green Triangle: Indicates where a buy entry occurred.
Red Triangle: Indicates where a sell entry occurred.
Summary of What the Script Does:
Inputs: The script allows the user to adjust moving average lengths, daily profit targets, stop-loss amounts, and trailing stop offsets.
Signals: It generates buy and sell signals based on the crossovers of the fast and slow moving averages.
Order Execution: It executes long positions on buy signals and short positions on sell signals.
Stop-Loss and Trailing Stop: It sets dynamic stop-losses and uses a trailing stop to protect profits.
Daily Profit Target: The strategy stops trading for the day once the net profit reaches the daily target (unless the target is disabled by setting it to 0).
Visual Markers: It plots moving averages and buy/sell signals directly on the main price chart to aid in visual analysis.
This script is designed to trade based on moving average crossovers, with robust risk management features like stop-loss and trailing stops, along with an optional daily profit target to limit daily trading activity. Let me know if you need further clarification or want to adjust any specific part of the script!
Search in scripts for "NQ"

Futures Risk CalculatorFutures Risk Calculator Script - Description
The Futures Risk Calculator (FRC) is a comprehensive tool designed to help traders effectively manage risk when trading futures contracts. This script allows users to calculate risk/reward ratios directly on the chart by specifying their entry price and stop loss. It's an ideal tool for futures traders who want to quantify their potential losses and gains with precision, based on their trading account size and the number of contracts they trade.
What the Script Does:
1. Risk and Reward Calculation:
The script calculates your total risk in dollars and as a percentage of your account size based on the entry and stop-loss prices you input.
It also calculates two key levels where potential reward (Take Profit 1 and Take Profit 2) can be expected, helping you assess the reward-to-risk ratio for any trade.
2. Customizable Settings:
You can specify the size of your trading account (available $ for Futures trading) and the number of futures contracts you're trading. This allows for tailored risk management that reflects your exact trading conditions.
3. Live Chart Integration:
You add the script to your chart after opening a futures chart in TradingView. Simply click on the chart to set your Entry Price and Stop Loss. The script will instantly calculate and display the risk and reward levels based on the points you set.
Adjusting the entry and stop-loss points later is just as easy: drag and drop the levels directly on the chart, and the risk and reward calculations update automatically.
4. Futures Contract Support:
The script is pre-configured with a list of popular futures symbols (like ES, NQ, CL, GC, and more). If your preferred futures contract isn’t in the list, you can easily add it by modifying the script.
The script uses each symbol’s point value to ensure precise risk calculations, providing you with an accurate dollar risk and potential reward based on the specific contract you're trading.
How to Use the Script:
1. Apply the Script to a Futures Chart:
Open a futures contract chart in TradingView.
Add the Futures Risk Calculator (FRC) script as an indicator.
2. Set Entry and Stop Loss:
Upon applying the script, it will prompt you to select your entry price by clicking the chart where you plan to enter the market.
Next, click on the chart to set your stop-loss level.
The script will then calculate your total risk in dollars and as a percentage of your account size.
3. View Risk, Reward, and (Take Profit):
You can immediately see visual lines representing your entry, stop loss, and the calculated reward-to-risk ratio levels (Take Profit 1 and Take Profit 2).
If you want to adjust the entry or stop loss after plotting them, simply move the points on
the chart, and the script will recalculate everything for you.
4. Configure Account and Contracts:
In the script settings, you can enter your account size and adjust the number of contracts you are trading. These inputs allow the script to calculate risk in monetary terms and as a percentage, making it easier to manage your risk effectively.
5. Understand the Information in the Table:
Once you apply the script, a table will appear in the top-right corner of your chart, providing you with key information about your futures contract and the trade setup. Here's what each field represents:
Account Size: Displays your total account value, which you can set in the script's settings.
Future: Shows the selected futures symbol, along with key details such as its tick size and point value. This gives you a clear understanding of how much one point or tick is worth in dollar terms.
Entry Price: The exact price at which you plan to enter the trade, displayed in green.
Stop Loss Price: The price level where you plan to exit the trade if the market moves against you, shown in red.
Contracts: The number of futures contracts you are trading, which you can adjust in the settings.
Risk: Highlighted in orange, this field shows your total risk in dollars, as well as the percentage risk based on your account size. This is a crucial value to help you stay within your risk tolerance and manage your trades effectively.

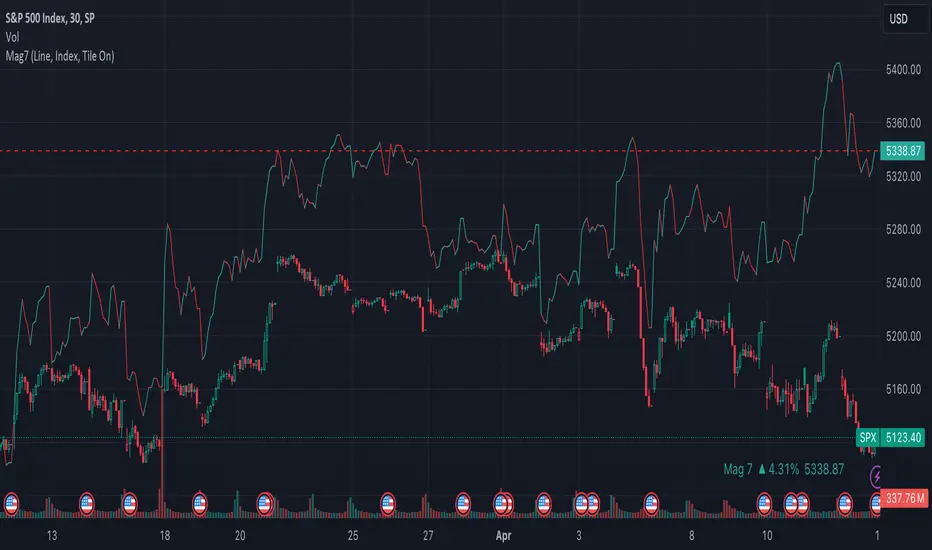
Mag7 IndexThis is an indicator index based on cumulative market value of the Magnificent 7 (AAPL, MSFT, NVDA, TSLA, META, AMZN, GOOG). Such an indicator for the famous Mag 7, against which your main security can be benchmarked, was missing from the TradingView user library.
The index bar values are calculated by taking the weighted average of the 7 stocks, relative to their market cap. Explicitly, we are multiplying each bar period's total outstanding stock amount by the OHLC of that period for each stock and dividing that value by the combined sum of outstanding stock for the 7 corporations. OHLC is taken for the extended trading session.
The index dynamically adjusts with respect to the chosen main security and the bars/line visible in the chart window; that is, the first close value is normalized to the main security's first close value. It provides recalculation of the performance in that chart window as you scroll (this isn't apparent in the demo chart above this description).
It can be useful for checking market breadth, or benchmarking price performance of the individual stock components that comprise the Magnificent 7. I prefer comparing the indicator to the Nasdaq Composite Index (IXIC) or S&P500 (SPX), but of course you can make comparisons to any security or commodity.
Settings Input Options:
1) Bar vs. Line - view as OHLC colored bars or line chart. Line chart color based on close above or below the previous period close as green or red line respectively.
2) % vs Regular - the final value for the window period as % return for that window or index value
3) Turn on/off - bottom right tile displaying window-period performance
Inspired by the simpler NQ 7 Index script by @RaenonX but with normalization to main security at start of window and additional settings input options.
Please provide feedback for additional features, e.g., if a regular/extended session option is useful.
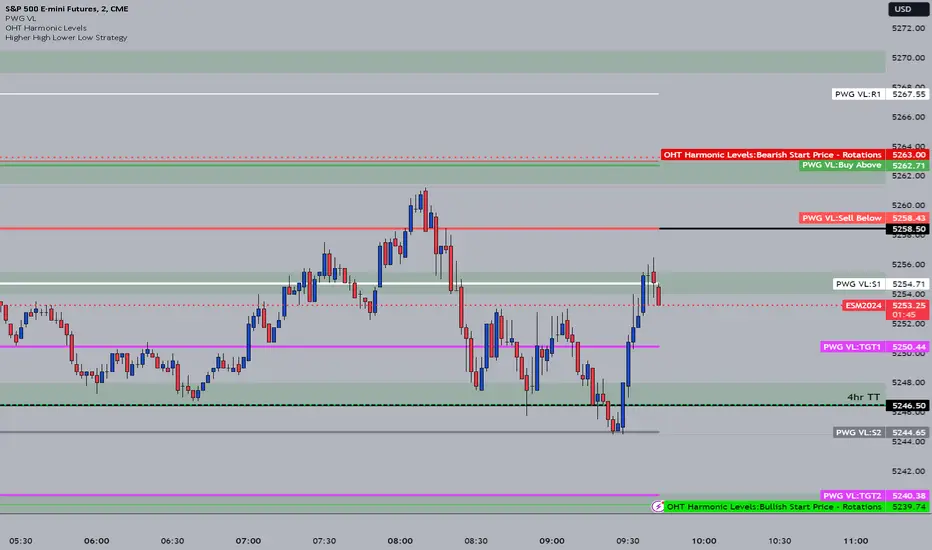
OHT Harmonic LevelsHarmonic Level plotter I've been talking about on the discord - right now a lot of this is manual and some day maybe we can get it to be automatic across different time frames but that is probably far off in the future.
For now, you need to probably create a new tab/layout for each instrument you add this to. It will then ask for the long start price and short start price. I would like to leave this how it is as I don't like using the top of pivot points, its lazy and you don't learn to go find the current trend.
The levels have an area around them equal to 10% of the rotation size, so if NQ has a rotation size of 60, there is a 6pt area around the actual level to either size to account for rotation average changes.
Gains CorrelationsScript Description: This script is to tie the major futures indexes together at a macro level with the normal relationships (i.e. 10YR Yield, DXY, VIX inversely related to Equities) and determine how strong the correlation is between them using a 20 period average. For example, a move up in the 10YR yield while having a strong inverse covariance with equities should signal a downward move for equities. In addition, if ES and NQ are going down, and the Dow and RTY have a strong covariance, the probability of them going down as well is strong. Overall, it's a macro indicator on broad market movements.
Originality & Usefulness: The script functions by tying 7 major indexes together using correlation strength relative to the currently selected ticker. The user can change the tickers and also invert if needed. This is different from the single correlation script by adding in several as they track in tandem. The chart used is to illustrate periods where correlations are tight with equities and the lines are clustered towards the top range of strong covariance. It also highlights when Equities are far out of line with others like gold (GC). A loose covariance would mean the relationship is weak and this indicator would show a divergence in price action between them. The overall intent is to show that most indexes rise and fall together but sometimes they move faster together.

MACD Crossover with +/- FilterThis is to directly target when MACD crosses the Signal line. The purpose of this script is to target a +/- change of 3 in the MACD value after the most recent cross. It uses the value of the MACD line and holds it until a value of 3.00 + or - a crossover or crossunder happens. That's the significance of the red and green circles that appear on the chart. This is not financial advice, but I wanted to recreate what a friend of mine was doing manually and automate it for him.
The first circle that appears after MACD/SIGNAL lines cross would represent a potential trade idea. The circles after the first one match the intention of the first dot as they meet the condition of more than a value of -3 or +3 as the previous dot.
Inputs:
Standard Inputs as normal MACD (Moving Average Converging Divergence) within TradingView
Fast Length: User can change it to any value they want
Slow Length: User can change it to any value they want
Standard 12, 26, 9 as normal MACD // 9 being signal smoothing
Oscillator and Signal Line moving average type is using EMA's
Timeframe is dependent on user chart.
Circles are used for signaling the change in values. Red indicates a short-term bearish trend. Green indicates a short-term bullish trend.
Tested on lower timeframes:
1m, 3m, 5m, 15m, 60m
Not used as much on higher timeframes. Used for trading futures. This is what I use it for. It can be used for other futures than just NQ or ES, but those 2 are the ones that I've tested. Code it shown below for users to tinker with.
Style of indication symbol can be changed via settings within the indicator in the "Style" tab, as well as location of the symbol(s). Additionally, color can be changed as well, if you prefer different colors.
Not financial advice. Just trade ideas.
COT MCIThe COT MCI script is a market indicator based on the data from the Commitment of Traders Reports.
Integration of COT Report Data:
The script sources COT data from futures contracts, including:
Treasury Bonds (ZB), Dollar Index (DX), 10-Year Treasury Notes (ZN)
Commodities like Soybeans (ZS), Soy Meal (ZM), Soy Oil (ZL), Corn (ZC), Wheat (ZW), Kansas City Wheat (KE), Pork (HE), Cattle (LE)
Precious Metals such as Gold (GC), Silver (SI), Palladium (PA), Platinum (PL)
Industrial Metals like Copper (HG), Aluminum (AUP), Steel (HRC)
Energy Products like Crude Oil (CL), Heating Oil (HO), Gasoline (RB), Natural Gas (NG), Brent Crude (BB)
Currencies such as AUD (6A), GBP (6B), CAD (6C), EUR (6E), JPY (6J), CHF (6S), NZD (6N), BRL (6L), MXN (6M), RUB (6R), ZAR (6Z)
Others: Sugar (SB), Coffee (KC), Cocoa (CC), Cotton (CT), Ethanol (EH), Rice (ZR), Oats (ZO), Whey (DC), Orange Juice (OJ), Lumber (LBS), Livestock (GF), E-mini S&P 500 (ES), E-mini Russell 2000 (RTY), E-mini Dow Jones (YM), E-mini NASDAQ-100 (NQ), VIX Futures (VX), S&P 500 (SP), DJIA (DJIA)
Cryptocurrencies such as Bitcoin (BTC) and Ethereum (ETH)
Functions and Logic of the Script:
COT Calculation: Determines the net positions for commercial actors and large speculators. Also Available are short and long positions of commercials or large speculators.
Position Change Analysis: Analyzes the percentage changes in net positions and open interest data over a period of 6 weeks (Weekly Chart).
Average Value Calculation: Determines short-term and long-term trend averages.
Trend Analysis: Buy and sell signals (represented in colors) are based on linear regressions and average calculations.
Usage and Application Examples:
Ideal for traders looking for a detailed analysis of market dynamics and position changes in the futures market. Suitable for decision-making in transaction timing and assessing market sentiment.
Usage Notes:
Users should be familiar with the interpretation of COT data and basic concepts of futures trading. Particularly suitable for medium to long-term trading strategies.

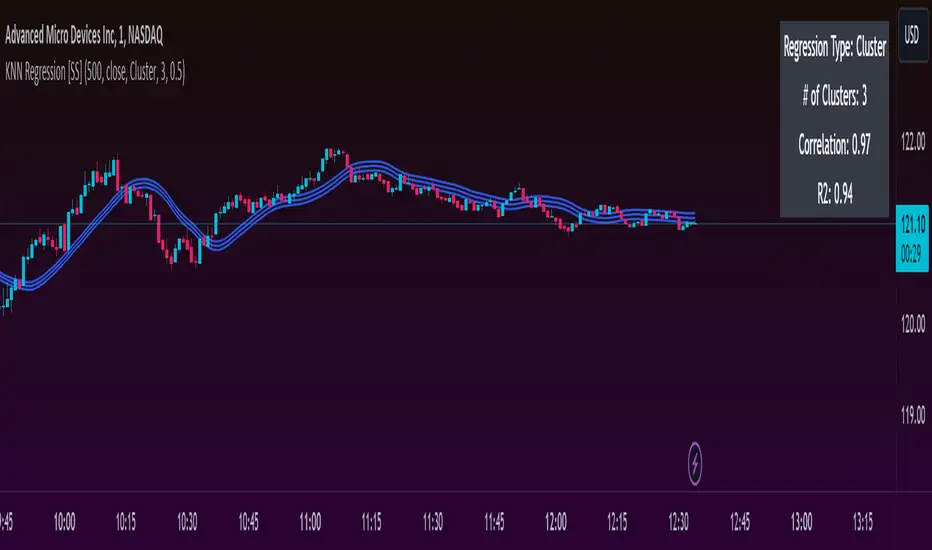
KNN Regression [SS]Another indicator release, I know.
But note, this isn't intended to be a stand-alone indicator, this is just a functional addition for those who program Machine Learning algorithms in Pinescript! There isn't enough content here to merit creating a library for (it's only 1 function), but it's a really useful function for those who like machine learning and Nearest Known Neighbour Algos (or KNN).
About the indicator:
This indicator creates a function to perform KNN-based regression.
In contrast to traditional linear regression, KNN-based regression has the following advantages over linear regression:
Advantages of KNN Regression vs. Linear Regression:
🎯 Non-linearity: KNN is a non-parametric method, meaning it makes no assumptions about the underlying data distribution. This allows it to capture non-linear relationships between features and the target variable.
🎯Simple Implementation: KNN is conceptually simple and easy to understand. It doesn't require the estimation of parameters, making it straightforward to implement.
🎯Robust to Outliers: KNN is less sensitive to outliers compared to linear regression. Outliers can have a significant impact on linear regression models, but KNN tends to be less affected.
Disadvantages of KNN Regression vs. Linear Regression:
🎯 Resource Intensive for Computation: Because KNN operates on identifying the nearest neighbors in a dataset, each new instance has to be searched for and identified within the dataset, vs. linear regression which can create a coefficient-based model and draw from the coefficient for each new data point.
🎯Curse of Dimensionality: KNN performance can degrade with an increasing number of features, leading to a "curse of dimensionality." This is because, in high-dimensional spaces, the concept of proximity becomes less meaningful.
🎯Sensitive to Noise: KNN can be sensitive to noisy data, as it relies on the local neighborhood for predictions. Noisy or irrelevant features may affect its performance.
Which is better?
I am very biased, coming from a statistics background. I will always love linear regression and will always prefer it over KNN. But depending on what you want to accomplish, KNN makes sense. If you are using highly skewed data or data that you cannot identify linearity in, KNN is probably preferable.
However, if you require precise estimations of ranges and outliers, such as creating co-integration models, I would advise sticking with linear regression. However, out of curiosity, I exported the function into a separate dummy indicator and pulled in data from QQQ to predict SPY close, and the results are actually very admirable:
And plotted with showing the standard error variance:
Pretty impressive, I must say I was a little shocked, it's really giving linear regression a run for its money. In school I was taught LinReg is the gold standard for modeling, nothing else compares. So as with most things in trading, this is challenging some biases of mine ;).
Functionality of the function
I have permitted 3 types of KNN regression. Traditional KNN regression, as I understand it, revolves around clustering. ( Clustering refers to identifying a cluster, normally 3, of identical cases and averaging out the Dependent variable in each of those cases) . Clustering is great, but when you are working with a finite dataset, identifying exact matches for 2 or 3 clusters can be challenging when you are only looking back at 500 candles or 1000 candles, etc.
So to accommodate this, I have added a functionality to clustering called "Tolerance". And it allows you to set a tolerance level for your Euclidean distance parameters. As a default, I have tested this with a default of 0.5 and it has worked great and no need to change even when working with large numbers such as NQ and ES1!.
However, I have added 2 additional regression types that can be done with KNN.
#1 One is a regression by the last IDENTICAL instance, which will find the most recent instance of a similar Independent variable and pull the Dependent variable from that instance. Or
#2 Average from all IDENTICAL instances.
Using the function
The code has the instructions for integrating the function into your own code, the parameters, and such, so I won't exhaust you with the boring details about that here.
But essentially, it exports 3, float variables, the Result, the Correlation, and the simplified R2.
As this is KNN regression, there are no coefficients, slopes, or intercepts and you do not need to test for linearity before applying it.
Also, the output can be a bit choppy, so I tend to like to throw in a bit of smoothing using the ta.sma function at a deault of 14.
For example, here is SPY from QQQ smoothed as a 14 SMA:
And it is unsmoothed:
It seems relatively similar but it does make a bit of an aesthetic difference. And if you are doing it over 14, there is no data loss and it is still quite reactive to changes in data.
And that's it! Hopefully you enjoy and find some interesting uses for this function in your own scripts :-).
Safe trades everyone!
HistDistDevsv2Iteration on ChrisakaChis' HIsDistDevs indicator which adds customizability options and automatically adjusts the deviations according to the loaded chart and timeframe. Supports ES, NQ, YM, RTY, GC

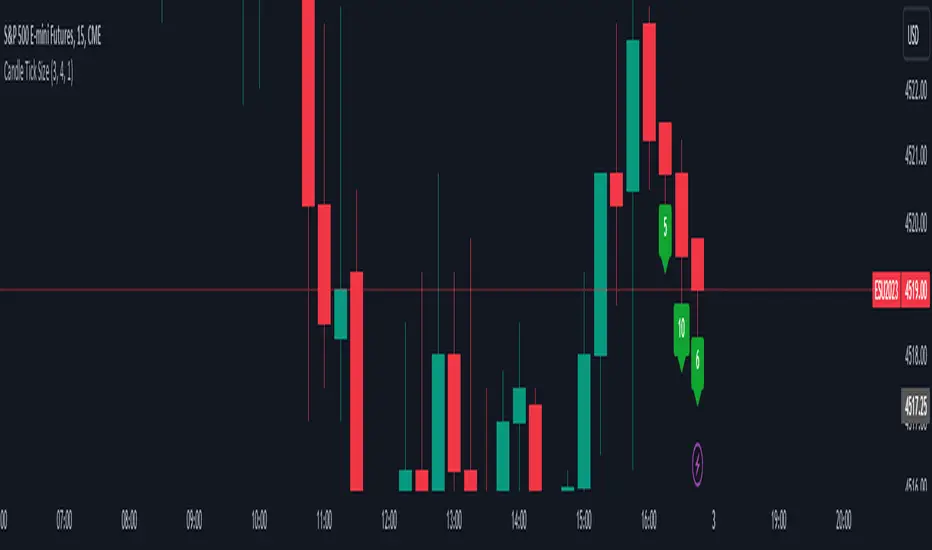
Candle Tick SizeHello everyone!
I dont think it exists, I couldnt find it any way I searched, maybe it is part of a bigger indicator. This is a really basic code, all it does, it shows the tick/pip size of the candles forming. You can adjust on how many candles should it show. Also because the code counts the point size of the candles from high to low, you can adjust that how many ticks are in one point, like for ES and NQ 4 ticks to a point, which is the basic setting. It helps me with entrys when I calculate the contract size so my risk/reward stays pretty much the same depending on the candle size for my entrys.
LNL Trend SystemLNL Trend System is an ATR based day trading system specifically designed for intra-day traders and scalpers. The System works on any chart time frame & can be applied to any market. The study consist of two components - the Trend Line and the Stop Line. Trend System is based on a special ATR calculation that is achieved by combining the previous values of the 13 EMA in relation to the ATR which creates a line of deviations that visually look similar to the basic moving average but actually produce very different results ESPECIALLY in sideways market.
Trend Line:
Trend Line is a simple line which is basically a fast gauge represented by the 13 EMA that can change the color based on the current trend structure defined by multiple averages (8,13,21,34 EMAs). Trend Line is there to simply add the confluence for the current trend. Colors of the line are pretty much self-explanatory. Whenever the line turns red it states that the current structure is bearish. Vice versa for green line. Gray line represents neutral market structure.
Stop Line:
Stop Line is an ATR deviaton line with special calculation based on the previous bar ATRs and position of the price in relation to the current and previous values of 13 EMA. As already stated, this creates an ATR deviation marker either above or below the price that trails the price up or down until they touch. Whenever the price comes into the Stop Line it means it is making an ATR expansion move up or down .This touch will usually resolve into a reaction (a bounce) which provides trade opportunities.
Trend Bars:
When turned ON, Trend Bars can provide additional confulence of the current trend alongside with the Trend Line color. Trend Bars are based on the DMI and ADX indicators. Whenever the DMI is bearish and ADX is above 20 the candles paint themselfs red. And vice versa applies for the green candles and bullish DMI. Whenever the ADX falls below the 20, candles are netural (Gray) which means there is no real trend in place at the moment.
Trend Mode:
There are total of 5 different trend modes available. Each mode is visualizing different ATR settings which provides either aggressive or more conservative approach. The more tigher the mode, the more closer the distance between the price and the Stop Line. First two modes were designed for slower markets, whereas the "Loose" and "FOMC" modes are more suitable for products with high volatility.
Trend Modes:
1. Tight
Ideal for the slowest markets. Slowest market can be any market with unusually small average true range values or just simply a market that does have a personality of a "sleeper". Tight Mode can be also used for aggresive entries in the most ridiculous trends. Sometimes price will barely pullback to the Trend Line not even the Stop Line.
2. Normal
Normal Mode is the golden mean between the modes. "Normal" provides the ideal ATR lengths for the most used markets such as S&P Futures (ES) or SPY, AAPL and plenty of other highly popular stocks. More often than not, the length of this mode is respected considering there is no breaking news or high impact market event scheduled.
3. Loose
The "Loose" mode is basically a normal mode but a little bit more loose. This mode is useful whenever the ATRs jump higher than usual or during the days of highly anticipated news events. This mode is also better suited for more active markets such as NQ futures.
4. FOMC
The FOMC mode is called FOMC for a reason. This mode provides the maximum amount of wiggle room between the price and the Stop Line. This mode was designed for the extreme volatility, breaking news events or post-FOMC trading. If the market quiets down, this mode will not get the Stop Line touch as frequently as othete modes, thus it is not very useful to run this on markets with the average volatlity. Although never properly tested, perhaps the FOMC mode can find its value in the crypto market?
5. The Net
The net mode is basically a combination of all modes into one stop line system which creates "the net" effect. The Net provides the widest Stop Line zone which can be mainly appreciated by traders that like to use scale-in scale-out methods for their trading. Not to mention the visual side of the indicator which looks pretty great with the net mode on.
HTF (Higher Time Frame) Trend System:
The system also includes additional higher time frame (HTF) trend system. This can be set to any time frame by manual HTF mode. HTF mode set to "auto" will automatically choose the best suitable higher time frame trend system based on how appropriate the aggregation is. For everything below 5min the HTF Trend System will stay on 5min. Anything between 5-15min = 30min. 30min - 120min will turn on the 240min. 180min and higher will result in Daily time frame. Anything above the Daily will result in Weekly HTF aggregation, above W = Monthly, above M = Quarterly.
Background Clouds:
In terms of visualization, each trend system is fully customizable through the inputs settings. There is also an option to turn on/off the background clouds behind the stop lines. These clouds can make the charts more clean & visible.
Tips & Tricks:
1. Different Trend Modes
Try out different modes in different markets. There is no one single mode that will fit to everyone on the same type of market. I myself actually prefer more Loose than the Normal.
2. Stop Line Mirroring
Whenever the Stop Lines start to mirror each other (there is one above the price and one below) this means the price is entering a ranging sideways market. It does not matter which Stop Line will the price touch first. They can both be faded until one of them flips.
3. Signs of the Ranging Market
Watch out for signs of ranging market. Whenever the Trend System looses its colors whether on trend line or trend bars, if everything turns neutral (gray) that is usually a solid indication of a range type action for the following moments. Also as already stated before, the Stop Line mirroring is a good sign of the range market.
4. Trailing Tool, Trend System as an Additional Study?
In case you are not a fan of the colorful green / red charts & candles. You can switch all of them off and just leave the Stop Line on. This way you can use the benefits of the trend system and still use other studies on top of that. Similarly as the Parabolic SAR is often used.
5. The Flip Setup
One of my favorite trades is the Flip Setup on the 5min charts. Whenever the Stop Line is broken , the very first opposing touch after the Trend System flips is a usually a highly participated touch. If there is a strong reaction, this means this is likely a beginning of a new trend. Once I am in the position i like to trail the Stop Line on the 1min charts.
Hope it helps.

High/Low of week: Stats & Day of Week tendencies// Purpose:
-To show High of Week (HoW) day and Low of week (LoW) day frequencies/percentages for an asset.
-To further analyze Day of Week (DoW) tendencies based on averaged data from all various custom weeks. Giving a more reliable measure of DoW tendencies ('Meta Averages').
-To backtest day-of-week tendencies: across all asset history or across custom user input periods (i.e. consolidation vs trending periods).
-Education: to see how how data from a 'hard-defined-week' may be misleading when seeking statistical evidence of DoW tendencies.
// Notes & Tips:
-Only designed for use on DAILY timeframe.
-Verification table is to make sure HoW / LoW DAY (referencing previous finished week) is printing correctly and therefore the stats table is populating correctly.
-Generally, leaving Timezone input set to "America/New_York" is best, regardless of your asset or your chart timezone. But if misaligned by 1 day =>> tweak this timezone input to correct
-If you want to use manual backtesting period (e.g. for testing consolidation periods vs trending periods): toggle these settings on, then click the indicator display line three dots >> 'Reset Points' to quickly set start & end dates.
// On custom week start days:
-For assets like BTC which trade 7 days a week, this is quite simple. Pick custom start day, use verification table to check all is well. See the start week day & time in said verification table.
-For traditional assets like S&P which trade only 5 days a week and suffer from occasional Holidays, this is a bit more complicated. If the custom start day input is a bank holiday, its custom 'week' will be discounted from the data set. E.g.1: if you choose 'use custom start day' and set it to Monday, then bank holiday Monday weeks will be discounted from the data set. E.g.2: If you choose 'use custom start day' and set it to Thursday, then the Holiday Thursday custom week (e.g Thanksgiving Thursday >> following Weds) would be discounted from the data set.
// On 'Meta Averages':
-The idea is to try and mitigate out the 'continuation bias' that comes from having a fixed week start/end time: i.e. sometimes a market is trending through the week start/end time, so the start/end day stats are over-weighted if one is trying to tease out typical weekly profile tendencies or typical DoW tendencies. You'll notice this if you compare the stats with various custom start days ('bookend' start/end days are always more heavily weighted). I wanted to try to mitigate out this 'bias' by cycling through all the possible new week start/end days and taking an average of the results. i.e. on BTC/USD the 'meta average' for Tuesday would be the average of the Tuesday HoW frequencies from the set of all 7 possible custom weeks(Mon-Sun, Tues-Mon, Weds-Tues, etc etc).
// User Inputs:
~Week Start:
-use custom week start day (default toggled OFF); Choose custom week start day
-show Meta Averages (default toggled ON)
~Verification Table:
-show table, show new week lines, number of new week lines to show
-table formatting options (position, color, size)
-timezone (only for tweaking if printed DoW is misaligned by 1 day)
~Statistics Table:
-show table, table formatting options (position, color, size)
~Manual Backtesting:
-Use start date (default toggled OFF), choose start date, choose vline color
-Use end date (defautl toggled OFF), choose end date, choose vline color
// Demo charts:
NQ1! (Nasdaq), Full History, Traditional week (Mon>>Friday) stats. And Meta Averages. Annotations in purple:
NQ1! (Nasdaq), Full History, Custom week (custom start day = Wednesday). And Meta Averages. Annotations in purple:

Sessioned EMA - Frozen EMA in post market hoursWhy I develop this indicator?
In future indices, post market data with little volume distort the moving average seriously. This indicator is to eliminate the distortion of data during low volume post market hours.
How to use?
There is a time session setting in the indicator, you can set the cash hour time, moving average outside the session will be frozen.
What this indicator gives you
This indicator give you a more make sense ema pattern, the ema lines are more respected by the prices when you set the session properly.
Setup
1. Session setting
In US indices, such as NQ, ES etc, when there was data release at 0830 hr, huge volume transaction order appears, that makes the 0830 price data important that should be included in your ema trend line calculating. If that is the case, I will set the session begin from 0830, otherwise, I start the session at 0930. Golden rule : Price with huge volume counts.
2. Time zone
The coding is decided for GMT+8 time zone, you may amend the code to fit your timezone.

MTF Evolving Weighted Composite Value Area🧾 Description:
This indicator calculates evolving value areas across 3 different timeframes/periods and combines them into one composite, multi-timeframe evolving value area - with each of the underlying timeframes' VAs assigned their own weighting/importance in the final calculation. Layered with extra smoothing options, this creates an informative and useful 'rolling value area' effect that can give you a better perspective on the value area across multiple periods at once as it develops - without total calculation resets at the onset of every new period.
Let's start with a simplified primer on value areas and then jump in to the new ideas this indicator introduces.
🤔 What is a value area?
Value areas are a tool used in market profile analysis to determine the range of prices that represents where most trading activity occurred during a specific time period, typically within a single 'bar' of a certain higher timeframe, such as the 4-hour, daily, or weekly. It helps traders understand the levels where the market finds value.
To calculate the value area, we look at the distribution of prices and trading volume. We determine a percentage, usually 70% or 80%, that represents the significant portion of trading volume. Then, we identify the price range that contains this percentage of trading volume, which becomes the value area.
Value areas are useful because they provide insights into market dynamics and potential support and resistance levels. They show where traders have been most active and where they find value, and traders can use this information to make better-informed decisions.
For example, if price is trading within the value area, it suggests that it's within a range where traders see value and are actively participating, which could indicate a balanced market. If the price moves above or below the value area, it may signal a potential shift in market sentiment or a breakout/breakdown from the established range.
By understanding the value area, traders can identify potential areas of supply and demand, determine levels of interest for buyers and sellers, and make decisions based on the market's perception of value.
📑 Limitations of traditional value areas
Static representation: Value areas are usually represented as static zones calculated after the fact. For example, after a daily period is completed, a typical 1D VA indicator will display the value area for the past period with static horizontal lines. This approach doesn't give you the power to see how the value area evolved, or developed, during the time period, as it is only displayed retroactively. It also doesn't give you the ability to view it as it evolves in real-time. This is why we chose to use an evolving value area representation, specifically borrowed from @sourcey's Value Area POC/VAH/VAL script function for calculating evolving VAs.
Rollover resets - no memory of past periods!: The traditional value area is calculated over a static period - it is calculated from the beginning of the period, for example a 1 day period, to the end, and that's the end of it. When the next daily period begins, the calculation resets, and has no memory of the preceding period. This limits the usefulness of the value area visual when viewed near the beginning of a new period before price and volume have been given ample time to define an area.
Hard to absorb all of that information: Value areas aren't generally meant to be a hardline representation of something extremely exact - they're based on a percentage of the area where traders appeared to find value over a certain time period. Most traders use them as a guide for support and resistance levels or finding an expected range. Traders typically overlay multiple VAs - sometimes requiring several instances of the same indicator to be applied - to represent the VA across multiple timeframes such as the 4H, 1D, or 1W. The chart quickly gets cluttered and it's not necessarily easy to understand the relationship between these multiple periods' VAs at a glance.
🧪 New concepts introduced in this indicator
With the evolving weighted composite value area we tried to address these limitations, and we think the result can be useful and intuitive for traders who want more dynamic and practical VAs for their everyday technical analysis.
⚖️ 1. A composite, weighted multi-timeframe VA
This indicator's value areas represent a combination or composite of the value areas calculated across multiple timeframes. The VAs calculated across each timeframe are then given a weighting percentage, which determines their contribution to the final 'weighted composite value area'.
Pictured below: a 4H/1D/1W MTF evolving weighted composite VA on the BTCUSDT Perpetual Futures (Binance) 5 minute chart:
Traditionally, when traders wanted to get a view of where the majority of trading activity occurred over the past four hours, day, and week, they would need to apply three value area indicators (or sometimes one if it allows multiple custom timeframes), each set to a different period (4H, 1D, 1W). The chart gets cluttered quickly and the information is hard to absorb in one shot. Addressing this problem was the main impetus for creating this weighted composite process.
〰️ 2. Rolling and smoothed evolving VAs
Because the composite VA is calculated based on multiple period VAs, there is no one single point where the area calculation resets (unless all 3 selected timeframes happen to rollover on the same bar). This creates a 'rolling' effect that gives a sense of the progression of the VA as price transitions through the different underlying time periods, without the traditional 'jump' in calculations between periods.
Pictured below: a 1D/1W/1M MTF evolving weighted composite VA on the NQ futures 1H chart:
To help give even more of a sense of perspective and 'progression' of the VA, there are also smoothing options to even out the 'jumps' at period-rollover points.
✔️ What's it good for?
Smoothed, rolling, and evolving multi-timeframe VAs that give you a better real-time perspective of where traders are finding value across multiple time periods at once.
📎 References
1. @sourcey's Value Area POC/VAH/VAL script by adapting its f_poc(tf) function.
💠 Features:
A MTF evolving weighted composite value area based on 3 underlying VAs calculated across customizable timeframes
Aesthetic and flexible coloring and color theme styling options
Period-roller labels and options for ease-of-use and legibility
⚙️ Settings:
Calculation Decimal Resolution: This setting essentially determines how 'granular' the value area calculating process is. This value should be set to some multiple of the tick size/smallest decimal of the symbol's price chart. Eg. On BTCUSDT, the tick size/decimal is usually 0.1. So, you might use 0.5. On TSLA, the tick size is 0.01. You might use 0.05 or 0.25. Beware: if the resolution is too small, calculation will take too long and the script may timeout.
Show Me Suggested Resolutions: If enabled, a label will display in the bottom right of the chart with some suggested resolutions for the current chart.
Area Percentage: Set the displayed percentage of the calculated composite value area. Igor method = 70%; Daniel method: 68%.
Use a Color Theme: When this setting is enabled, all manual 'Bullish and Bearish Colors' are overridden. All plots will use the colors from your selected Color Theme - excepting those plots set to use the 'Single Color' coloring method.
Color Theme: When 'Use a Color Theme' is enabled, this setting allows you to select the color theme you wish to use.
Resistance Color: When 'Use a Color Theme' is disabled, this will set the 'resistance color' for the composite VA.
Support Color: When 'Use a Color Theme' is disabled, this will set the 'support color' for the composite VA.
Show Period Rollover Labels: When enabled, a label will show above or below the composite VA marking any underlying period rollovers with the label 'New __' (eg. 'New 4H', 'New 1D', 'New 1W').
Size: Sets the font size of the period rollover labels.
Show Period Rollover Lines: When enabled, a translucent vertical dashed line will be drawn across the composite VA when one of the underlying periods rolls over.
Fill Composite Value Area: When enabled, the composite VA will be filled with a gradient coloring from the support line to the resistance line using their respective colors.
Smooth: When enabled, a smoothing moving average will be applied to the composite value area.
Smoothing Period: Set the lookback period for the smoothing average.
Smoothing Type: Set the calculation type for the smoothing average. Options include: Exponential, Simple, Weighted, Volume-Weighted, and Hull.
Enable: Include/exclude a timeframe's VA in the composite VA calculation.
Timeframe: Set the timeframe for this specific underlying VA.
Weighting %: Set the weighting percentage or 'importance' of this timeframe's value area in calculating the composite VA. Beware! The sum of the weighting percentages across all enabled timeframes must ALWAYS add up to 100 in order for this indicator to work as designed.

LNL Scalper ArrowsLNL Scalper Arrows
The indicator consist of various different types of candlestick patterns that are truly time tested by multiple veteran traders. These arrows are a combination of short-term scalping strategies taught by Linda Raschke & a trader that goes by name Quant Trade Edge. These strategies/patterns occur regularly within the markets. They offer high probability quick moves during the trending days. These four patterns are based on pure price action, no oscillators, no trend, no momentum indicators involved. Trend (ema) is there just as a simple trend gauge.
LNL Scalper Arrows were designed specifically for intra-day trading. Mostly useful for the futures but also stocks as well. These arrows can work anywhere between the fast-moving 512 or 1600 tick charts to a 1min, 2min and up to 5min or 10min charts.
Trend Gauge (Exponential Moving Average)
Nothing fancy just a classic EMA that can guide the direction of the short-term trend. I have added a custom coloring of the EMA that is based on a simple RSI filter. That should help to visualize the non-directional moments within the trend. Although the length is adjustable, for scalping it is better to focus on smaller periods such as 9, 13 or 20 or 34 but anything above 50 loses its purpose as a short-term trend gauge. Again, this is a scalping tool not a trend tool, you are not going to get rid of the fakeouts by increasing the period of the trend.
Tail Arrows (Eat the Tail Pattern)
Tail is a candlestick that is either a price rejection spike, or a flag continuation pattern on a lower time frame. A failed action. It is basically a candle with much bigger wick (shadow) of the candle than the actual body. Such candles are usually telling us about strong participation from the other side of the market. Eat the tail pattern occurs whenever the low of the Tail candle is immediately broken on a following candle "the tail is eaten alive". Such a breaks occurs in a most aggressive types of markets with a strong momentum. DO NOT try to trade this in a low volume or a ranging market. Tail Arrows are the most aggressive arrows & should be only used on the highest volume or a parabolic momentum markets.
Scalp Arrows (Scallop Pattern)
Known as Scallops or minor lows or highs, these patterns are the most common within the all scalper arrows. They occur regularly on 1min & 5min charts - basically everyday. Scallops provide the best possible risk to reward entry within the trend without the need of any indicators or oscillators. The Scallop Up 3 bar pattern consist of a high that is lower that the previous high but also low that is lower than the previous low. Scallop Up or a minor low triggers when the last high is broken, creating a three bar mountain or a peak within the 5 bar span.
Hoagie Arrows (Hoagie Pattern)
Hoagies occur way less often than any other scalping patterns. Hoagies represent two (or more) inside candles within the shadow of a first candle. Such a formation is creating a small compression or a range that sooner or later breaks out. The hoagie is triggered whenever the high or low of the shadow (first) candle is broken. The great thing about the hoagies is that they can work either way despite the trend direction. Although this indicator is coded for the 2 bar hoagies, there are no limitations on how much inside bars can hoagie include.
Umbrella Arrows (Umbrella Pattern)
Another really awesome 3 bar pattern that is really fun to trade. Umbrella occurs when the candle before the previous candle is a pin bar or a tail bar and the body of the previous candle is within the shadow or a wick of the candle before. The umbrella is triggered once the high or low of the previous bar is broken. Umbrellas are more frequent than Hoagies but occur much less than the Scallops.
Outside Bar Wedges (Outside Bar Pattern)
Pretty much self-explanatory candlestick pattern. Outside Bar is basically any bar that peaks outside of the both ends of the previous candle. So the range of the candle is higher & it looked beyond the high and beyond the low of the previous candle. These candles are signalizing the potenial momentum change. Ouside Bars usually occur at the tops or bottoms of the moves. I decided to add them because they can serve as a great addition to these scalping patterns.
Signal vs. SignalBreak Mode
The trigger can be viewed in two different ways:
1. Signal: Plots the trigger before the trigger bar, basically right when the pattern is formed but NOT YET triggered. The signal is triggered once the next candle break the high or low of the current candle.
2. SignalBrake: Plots the trigger after the break of the high or low of the actual pattern. It is basically a candle after the signal candle. (Signal is better for trading because it gives you time to prepare for the actual break of the high or low = the actual signal. SignalBrake is great for looking back in history only for the patterns that actually traded).
Pin Bar BTW Ratio
Pin Bar (Body-To-Wick) Ratio represents the size of the body of a pin bar candle for Eat the Tail and Umbrella patterns. Pin Bar BTW Ratio measures the ratio between the wick & the body of the candle. Ref. interval is 2.0 - 5.0 (ideal pin bar is 2.0 - 3.0 = the wick or a shadow is 2x - 3x bigger than the body of the candle)
ATR Stop & Target Labels
I also created three simple labels (tables) that can show you the ideal target & stop as well as the current ATR. Since LNL Scalper Arrows consist of high probability scalping patterns, a good rule of thumb to follow is to use a half of the current ATR as a target and a current ATR as a stop (or two times the target). So if the current 7 period ATR is 30 the target would be 15 pts. and a stop around 30 pts. With such a risk management you should aim for a win rate 70% or higher. Obviously you can adjust the risk management in the settings to your personal preference.
Low Range vs. High Range Markets
There are two major downsides with the Scalper Arrows:
1. You need volume and a volatility. These patterns really do struggle in ranging "boring" sideways action. It is absolutely crucial to recognize the current market environment and really stay cautions and (or completely out) in case the chop continues. Adding something like DMI can help you recognize the potential flat markets.
2. Not only do you need volume & momentum, you also need a decent range. This indicator works better on a rangy market such as NQ futures or YM. But are much tougher to trade on lower range markets such as some stocks or ZB futures or basically any other lower range market.
Hope it helps.

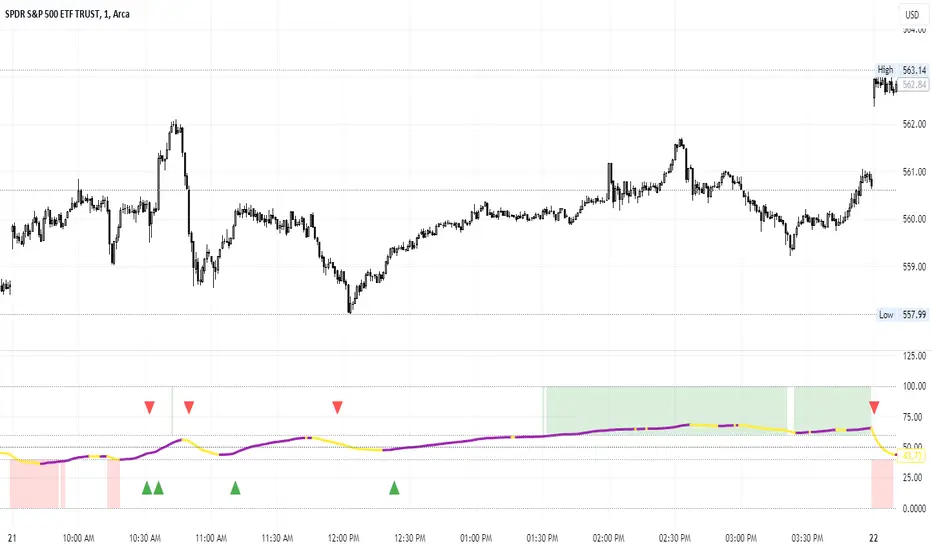
Percent of U.S. Stocks Above VWAPThis indicator plots a line reflecting the percentage of all U.S. stocks above or below their VWAP for the given candle. Horizontal lines have been placed at 40% (oversold), 50% (mid-line), and 60% (overbought). I recommend using this indicator as a market breadth indicator when trading individual stocks. In my experience, this indicator is best utilized while trading the major indices (SPX, SPY, QQQ, IWM) or their futures (ES, NQ, RTY) in the following manner:
- When the line crosses 50%, a green or red triangle is plotted indicating the majority of market momentum has turned bullish or bearish based on price positioning vs. VWAP. Look for longs when the line is rising (green) or above 50%, or shorts when the line is falling (red) or below 50%.
- When the line is below 40%, indicator shows red shading; I would not be long anything during this period. When the line exits this level, I begin looking for long entries. This line is adjustable in the indicator settings if you prefer to use a tighter or looser oversold level.
- When the line is above 60%, indicator shows green shading; I would not be short anything during this period. When the line exits this level, I begin looking for short entries. This line is adjustable in the indicator settings if you prefer to use a tighter or looser overbought level.
This indicator uses the TradingView ticker “PCTABOVEVWAP.US”, thus it only updates during NY market hours. If trading futures, I recommend applying VWAP to your chart and using that as the level to trade against in a similar manner, along with your personal price action analysis and other indicators you find useful.
Trading Day Holidays: 8am reminder of early closing day ahead-Designed for Index Futures(ES,NQ,YM). 8am Visual reminder on the morning of a holiday trading day that trading will cease at 1pm (NY time).
-This is updated and stripped down version of @Daveatt's 2020 script: 'BEST USA Bank Holidays Helper'.
-Simply marks 'HOLIDAY' on the holiday trading days, at 8am NY time on that day. Past 'HOLIDAY' labels will delete when new ones print.
-Should be 9 of these 'half-day' days throughout the year (not including Xmas period)
~I plan to update this each year

Breadth - Advance Decline ThrustBreadth indicator. Takes NYSE/NQ/US up volume and divides it by the total volume to get an advance decline thrust ratio which can be used as a measure of market breadth.
Also has the option to look at the cumulative breadth over the trailing x days.
Also has the option to display as cumulative net up volume which will show lower values than advance decline thrust on days where there were large buy/sell imbalances, but the total day's volume was low.

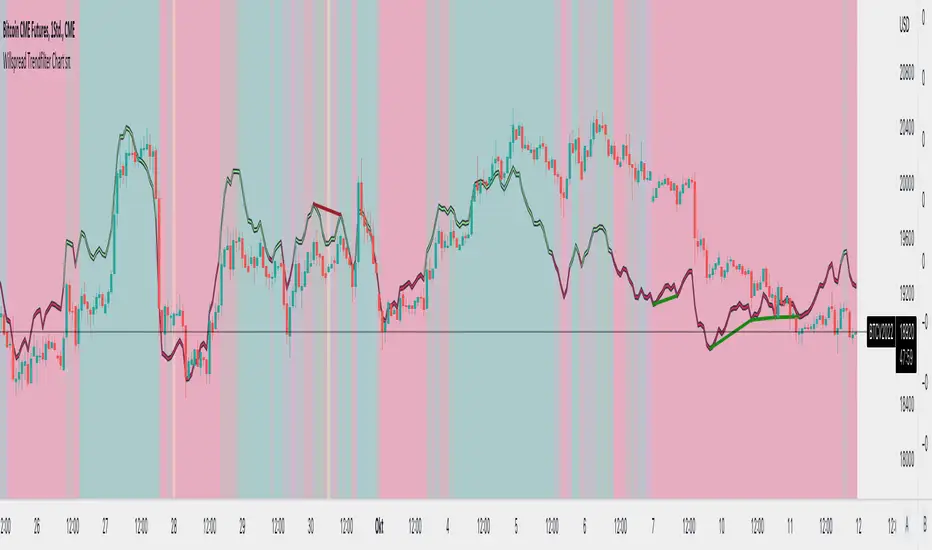
Willspread Chart + POIV & ADVolumen TrendColor sπThe Indicator is a combination of different types of measurements to the Price Action.
1. Spread: The Spread is set to measure your Symbol to another chosen Market like Dollar as Contra . But you can switch also between different markets.
2. Accumulation/Distribution with True Range of High or Low including OpenInterest. This only works with Futures .
--Energies, Metals, Bonds, Softs, Currencies, Livestock, live cattle , feeder cattle, lean hogs , index--
Open Interest for:
ZW, ZC, ZS, ZM, ZL, ZO, ZR, CL, RB, HO, NG, GC, SI, HG, PA, PL, ZN, ZB, ZT, ZF, CC, CT, KC, SB, JO, LB, AUDUSD, GBPUSD, USDCAD, EURUSD, USDJPY, USDCHF, USDMXN, NZDUSD, USDRUB, DX, BTC, ETH, LE, GF, HE, NQ, NDX, ES, SPX, RTY, VIX,
3. Accumulation/Distribution with True Range of High or Low including Volume .
4. The color shows if the Market has positive or negative (Willspread, Volume or Open Interest)
5. The Indicator also shows Divergences to Price and Willspread Movements.
If you want to have more information just give me a message.
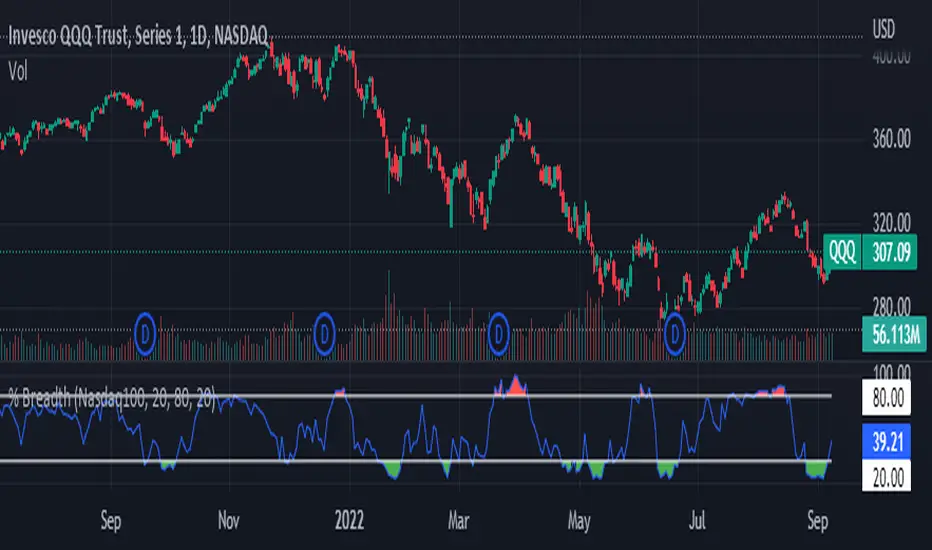
Index Breadth Percent of Stocks above Key Moving AveragesThis Indicator will plot the percent of stocks above key moving averages. This is a good way to monitor market breadth and help determine when the market is Overbought or Oversold.
Market Tickers Available = SP500, DJI, NQ, NQ100, R2000, R3000, SP500 Financials, SP500 Materials, SP500 Energy, SP500 Staples, SP500 Discretionary, SP500 Industrials, SP500 Real Estates, Overall Market
Rollover LTEThis indicator shows where price needs to be and when in order to cause the 20-sma and 50-sma moving averages to change directions. A change in direction requires the slope of a moving average to change from negative to positive or from positive to negative. When a moving average changes direction, it can be said that it has “rolled over” or “rolled up,” with the latter only applying if slope went from negative to positive.
Theory:
In order to solve for the price of the current bar that will cause the moving average to roll up, the slope from the previous bar’s average to the current bar’s average must be set equal to zero which is to say that the averages must be the same.
For the 20-sma, the equation simply stated in words is as follows:
Current MA as a function of current price and previous 19 values = previous MA which is fixed based on previous 20 values
The denominators which are both 20 cancel and the previous 19 values cancel. What’s left is current price on the left side and the value from 20 bars ago on the right.
Current price = value from 20 bars ago
and since the equation was set up for solving for the price of the current bar that will cause the MA to roll over
Rollover price = value from 20 bars ago
This makes plotting rollover price, both current and forecasted, fairly simple, as it’s merely the closing price plotted with an offset to the right the same distance as the moving average length.
Application:
The 20-sma and 50-sma rollover prices are plotted because they are considered to be the two most important moving averages for rollover analysis. Moving average lengths can be modified in the indicator settings. The 20-sma and 20-sma rollover price are both plotted in white and the 50-sma and 50-sma rollover price are both plotted in blue. There are two rollover prices because the 20-sma rollover price is the price that will cause the 20-sma to roll over and the 50-sma rollover price is the price that will cause the 50-sma to roll over. The one that's vertically furthest away from the current price is the one that will cause both to rollover, as should become clearer upon reading the explanation below.
The distance between the current price and the 20-sma rollover price is referred to as the “rollover strength” of the price relative to the 20-sma. A large disparity between the current price and the rollover price suggests bearishness (negative rollover strength) if the rollover price is overhead because price would need to travel all that distance in order to cause the moving average to roll up. If the rollover price and price are converging, as is often the case, a change in moving average and price direction becomes more plausible. The rollover strengths of the 20-sma and 50-sma are added together to calculate the Rollover Strength and if a negative number is the result then the background color of the plot cloud turns red. If the result is positive, it turns green. Rollover Strength is plotted below price as a separate indicator in this publication for reference only and it's not part of this indicator. It does not look much different from momentum indicators. The code is below if anybody wants to try to use it. The important thing is that the distances between the rollover prices and the price action are kept in mind as having shrinking, growing, or neutral bearish and bullish effects on current and forecasted price direction. Trades should not be entered based on cloud colorization changes alone.
If you are about to crash into a wall of the 20-sma rollover price, as is indicated on the chart by the green arrow, you might consider going long so long as the rollover strength, both current and forecasted, of the 50-sma isn’t questionably bearish. This is subject to analysis and interpretation. There was a 20-sma rollover wall as indicated with yellow arrow, but the bearish rollover strength of the 50-sma was growing and forecasted to remain strong for a while at that time so a long entry would have not been suggested by both rollover prices. If you are about to crash into both the 20-sma and 50-sma rollover prices at the same time (not shown on this chart), that’s a good time to place a trade in anticipation of both slopes changing direction. You may, in the case of this chart, see that a 20-sma rollover wall precedes a 50-sma rollover convergence with price and anticipate a cascade which turned out to be the case with this recent NQ rally.
Price exiting the cloud entirely to either the upside or downside has strong implications. When exiting to the downside, the 20-sma and 50-sma have both rolled over and price is below both of them. The same is true for upside exits. Re-entering the cloud after a rally may indicate a reversal is near, especially if the forecasted rollover prices, particularly the 50-sma, agree.
This indicator should be used in conjunction with other technical analysis tools.
Additional Notes:
The original version of this script which will not be published was much heavier, cluttered, and is not as useful. This is the light version, hence the “LTE” suffix.
LTE stands for “long-term evolution” in telecommunications, not “light.”
Bar colorization (red, yellow, and green bars) was added using the MACD Hybrid BSH script which is another script I’ve published.
If you’re not sure what a bar is, it’s the same thing as a candle or a data point on a line chart. Every vertical line showing price action on the chart above is a bar and it is a bar chart.
sma = simple moving average
Rollover Strength Script:
// This source code is subject to the terms of the Mozilla Public License 2.0 at mozilla.org
// © Skipper86
//@version=5
indicator(title="Rollover Strength", shorttitle="Rollover Strength", overlay=false)
source = input.source(close)
length1 = input.int(20, "Length 1", minval=1)
length2 = input.int(50, "Length 2", minval=1)
RolloverPrice1 = source
RolloverPrice2 = source
RolloverStrength1 = source-RolloverPrice1
RolloverStrength2 = source-RolloverPrice2
RolloverStrength = RolloverStrength1 + RolloverStrength2
Color1 = color.rgb(155, 155, 155, 0)
Color2 = color.rgb(0, 0, 200, 0)
Color3 = color.rgb(0, 200, 0, 0)
plot(RolloverStrength, title="Rollover Strength", color=Color3)
hline(0, "Middle Band", color=Color1)
//End of Rollover Strength Script

Caleb's Supply and Demand ZonesThis script takes predetermined levels and plots them as supply and demand zones. These zones are automatically colored as supply or demand based on price action. Additionally, two EMAs and a VWAP are included to help make intraday trading decisions. This script is written to intuitively deduce between SPY, SPX, ES, US500, QQQ, and NQ to plot the zones in their proper corresponding price levels.

Upvol and DownvolThis is a tweaked version of
What's Added?
- No negative graph lines (I want to see the crossovers in volume)
- Added NQ
- Adjusted enabled tickers (ES and the current ticker are enabled)
- Adjusted the moving average to better fit the strategy I was backtesting
How to use?
I watch it with other indicators for the cross over in positive delta/negative delta of the volume
- short volume crossing above long? consider going long
- long volume crossing below short consider going short
Also watching the total volume to see if it's going up or down (don't enter if it's dropping or consider getting out)
