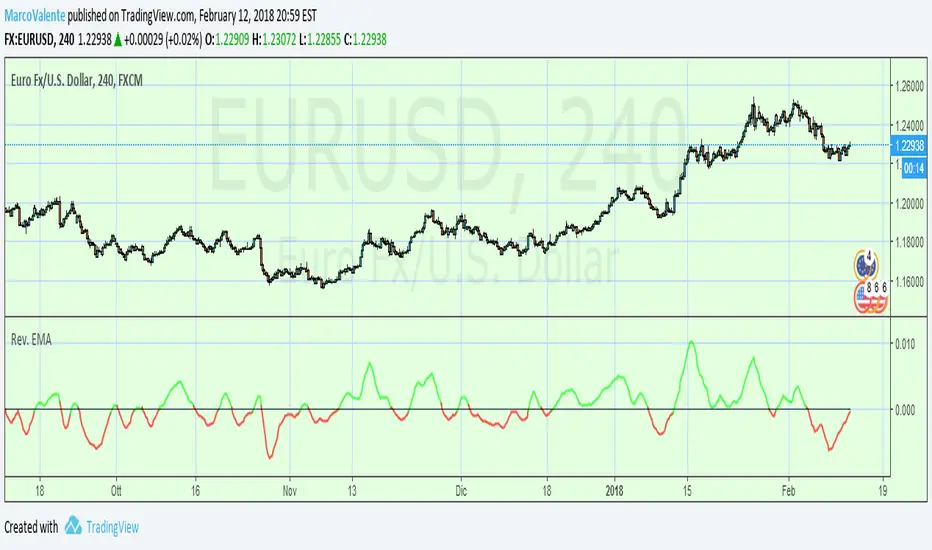
Reverse EMA “The Reverse EMA Indicator” , author John Ehlers presents very interesting filtering technique based on a Z-transform of the exponential moving average.
Search in scripts for "Reverse EMA"
Ehlers Reverse EMAOverview
The Ehlers Reverse EMA is an advanced momentum indicator designed by John Ehlers and implemented here with additional features for improved trading decision-making. This indicator helps identify trend direction, potential reversals, and generates precise buy/sell signals based on multiple confirmation methods.
What Makes It Unique
Unlike conventional EMAs, the Ehlers Reverse EMA uses a sophisticated reverse-engineering approach to provide smoother, more responsive signals with reduced lag. The indicator combines a proprietary EMA calculation with optional moving average confirmation to filter out market noise and highlight meaningful price movements.
Features
Dynamic Color Coding: Green when momentum is positive, red when negative
Moving Average Overlay: Optional MA with selectable types (SMA, EMA, WMA, VWMA)
Multiple Signal Generation Methods:
Zero-Line Crossovers: Signals when momentum shifts from positive to negative or vice versa
MA Crossovers: Signals when the Ehlers EMA crosses its own moving average
Combined Confirmation: Requires both zero-line and MA crossovers for highest probability signals
On-Chart Signal Visualization: Clear buy/sell arrows directly on the price chart
Customizable Parameters: Adjust alpha value, MA type, and signal generation to suit your trading style
How To Use
Add the main "Ehlers Reverse EMA" indicator to your chart
Add the companion "EREMA Signals" indicator to display buy/sell signals on the price chart
Ensure both indicators have matching settings for consistency
Signal Interpretation
Buy Signals (Green Triangles): Appear below price bars when conditions are met
Sell Signals (Red Triangles): Appear above price bars when conditions are met
Recommended Timeframes
Works well on all timeframes from 5-minute to daily charts. For swing trading, 4H or daily timeframes often provide the most reliable signals.
Strategy Applications
Trend Following: Use zero-line crossovers to enter with the trend
Momentum Trading: Use MA crossovers for entry and exit points
Confirmation Tool: Combine with price action or other indicators for higher-probability trades
Divergence Analysis: Compare indicator movement with price action to spot potential reversals
Parameter Settings
Alpha (Default: 0.1): Lower values create smoother lines but more lag; higher values increase responsiveness but may increase false signals
MA Length (Default: 14): Adjust based on your trading timeframe and style
This versatile indicator helps identify high-probability trading opportunities while filtering out market noise, making it valuable for both novice and experienced traders alike.

[blackcat] L2 Ehlers Reverse EMALevel: 2
Background
John F. Ehlers introuced Reverse EMA in Sep, 2017.
Function
In “The Reverse EMA Indicator” in Sep, 2017, John Ehlers presented very interesting filtering technique based on a Z-transform of the exponential moving average. It is a causal forward and backward EMA indicator that could be used in real trading. It has double smoothing at the high end of the spectrum to reduce aliased components and is able to mitigate the impact of spectral dilation at the low end. The author described the indicator as having unique flexibility in that it could display trend or cycle information by varying the alpha parameter and do this with very low lag.
Key Signal
TrendRevEMA --> Ehlers Reverse EMA slow line
CycleRevEMA --> Ehlers Reverse EMA fast line
Pros and Cons
100% John F. Ehlers definition translation, even variable names are the same. This help readers who would like to use pine to read his book.
Remarks
The 88th script for Blackcat1402 John F. Ehlers Week publication.
Readme
In real life, I am a prolific inventor. I have successfully applied for more than 60 international and regional patents in the past 12 years. But in the past two years or so, I have tried to transfer my creativity to the development of trading strategies. Tradingview is the ideal platform for me. I am selecting and contributing some of the hundreds of scripts to publish in Tradingview community. Welcome everyone to interact with me to discuss these interesting pine scripts.
The scripts posted are categorized into 5 levels according to my efforts or manhours put into these works.
Level 1 : interesting script snippets or distinctive improvement from classic indicators or strategy. Level 1 scripts can usually appear in more complex indicators as a function module or element.
Level 2 : composite indicator/strategy. By selecting or combining several independent or dependent functions or sub indicators in proper way, the composite script exhibits a resonance phenomenon which can filter out noise or fake trading signal to enhance trading confidence level.
Level 3 : comprehensive indicator/strategy. They are simple trading systems based on my strategies. They are commonly containing several or all of entry signal, close signal, stop loss, take profit, re-entry, risk management, and position sizing techniques. Even some interesting fundamental and mass psychological aspects are incorporated.
Level 4 : script snippets or functions that do not disclose source code. Interesting element that can reveal market laws and work as raw material for indicators and strategies. If you find Level 1~2 scripts are helpful, Level 4 is a private version that took me far more efforts to develop.
Level 5 : indicator/strategy that do not disclose source code. private version of Level 3 script with my accumulated script processing skills or a large number of custom functions. I had a private function library built in past two years. Level 5 scripts use many of them to achieve private trading strategy.

Ehlers Forward Reverse EMAThis is Ehlers most recent indicator, today is 6/17/18 "Forward and Reverse EMA". I have done my best to translate the code form trade stations easy language.
If anyone knows easy language could they check my translation against the easy language code below.
{
Forward / Reverse EMA
(c) 2017 John F. Ehlers
}
Inputs:
AA(.1);
Vars:
CC(.9),
RE1(0),
RE2(0),
RE3(0),
RE4(0),
RE5(0),
RE6(0),
RE7(0),
RE8(0),
EMA(0),
Signal(0);
CC = 1 - AA;
EMA = AA*Close + CC*EMA ;
RE1 = CC*EMA + EMA ;
RE2 = Power(CC, 2)*RE1 + RE1 ;
RE3 = Power(CC, 4)*RE2 + RE2 ;
RE4 = Power(CC, 8)*RE3 + RE3 ;
RE5 = Power(CC, 16)*RE4 + RE4 ;
RE6 = Power(CC, 32)*RE5 + RE5 ;
RE7 = Power(CC, 64)*RE6 + RE6 ;
RE8 = Power(CC, 128)*RE7 + RE7 ;
Signal = EMA - AA*RE8;
Plot1(Signal);
Plot2(0);
reverse EMA Osc - John EhlersThis an universal oscillator with features such as minimum lag and a single-input parameter that lets it highlight cycle, momentum, and trend components.
It is based on reverse impulse response filter technique applied to EMA.
Color style borrowed from Awesome Oscillator, between one can notice a better lag response with this indicator.
reverse EMA Osc - John EhlersThis an universal oscillator with features such as minimum lag and a single-input parameter that lets it highlight cycle, momentum, and trend components.
based on reverse impulse response filter design applied to EMA.
colorstyle for histogram style borrowed from Awesome Oscilator, but one will notice the superior lag response.

Scout Regiment - Bias# Scout Regiment - Bias Indicator
## English Documentation
### Overview
Scout Regiment - Bias is a technical indicator that measures the deviation (bias) between the current price and exponential moving averages (EMAs). It helps traders identify overbought/oversold conditions, trend strength, and potential reversal points through divergence detection.
### What is Bias?
Bias measures how far the price has moved away from a moving average, expressed as a percentage:
- **Positive Bias**: Price is above the EMA (potential overbought)
- **Negative Bias**: Price is below the EMA (potential oversold)
- **Formula**: Bias = (Price - EMA) / EMA × 100
### Key Features
#### 1. **Triple EMA Bias Lines**
The indicator calculates bias from three different EMAs:
- **EMA 55 Bias** (Default: Green/Red, 1px line)
- Short-term bias measurement
- Quick response to price changes
- Best for intraday and swing trading
- **EMA 144 Bias** (Pink, 2px line)
- Medium-term bias measurement
- Balanced response to price movements
- Ideal for swing trading
- **EMA 233 Bias** (White, 2px line)
- Long-term bias measurement
- Slower response, more stable
- Best for position trading
**Color Coding:**
- Green: Price above EMA (bullish)
- Red: Price below EMA (bearish)
#### 2. **Visual Components**
**Histogram Display**
- Shows EMA 55 bias as a histogram for easy visualization
- Green bars: Price above EMA 55
- Red bars: Price below EMA 55
- Can be toggled on/off
**Background Color**
- Light green background: Bullish bias (price above EMA 55)
- Light red background: Bearish bias (price below EMA 55)
- Optional display for cleaner charts
**Zero Line**
- White horizontal line at 0%
- Reference point for positive/negative bias
- Crossovers indicate trend changes
**Crossover Labels**
- "突破" (Breakout): When bias crosses above zero
- "跌破" (Breakdown): When bias crosses below zero
- Can be enabled/disabled for clarity
#### 3. **Divergence Detection**
The indicator automatically detects regular divergences for all three bias lines:
**Bullish Divergence (Yellow Labels)**
- Price makes lower lows
- Bias makes higher lows
- Suggests potential upward reversal
- Labels: "55涨", "144涨", "233涨"
**Bearish Divergence (Blue Labels)**
- Price makes higher highs
- Bias makes lower highs
- Suggests potential downward reversal
- Labels: "55跌", "144跌", "233跌"
**Divergence Parameters** (Customizable for each EMA):
- Left Lookback: Bars to the left of pivot (default: 5)
- Right Lookback: Bars to the right of pivot (default: 1)
- Max Lookback Range: Maximum distance between pivots (default: 60)
- Min Lookback Range: Minimum distance between pivots (default: 5)
### Configuration Settings
#### Bias Settings
- **EMA Periods**: Customize lengths for EMA 55, 144, and 233
- **Price Source**: Choose calculation source (default: close)
- **Enable/Disable**: Toggle each bias line independently
#### Display Settings
- **Show Histogram**: Toggle histogram display
- **Show Background Color**: Toggle background coloring
- **Show Crossover Labels**: Toggle breakout/breakdown labels
#### Divergence Settings (Per EMA)
- Individual controls for EMA 55, 144, and 233 divergences
- Customizable lookback parameters for precision tuning
- Adjustable range settings for different market conditions
### How to Use
#### For Trend Trading
1. **Identify Trend Direction**
- Price above zero = Uptrend
- Price below zero = Downtrend
2. **Confirm with Multiple Timeframes**
- EMA 55: Short-term trend
- EMA 144: Medium-term trend
- EMA 233: Long-term trend
3. **Trade in Direction of Bias**
- All three lines positive = Strong uptrend
- All three lines negative = Strong downtrend
#### For Mean Reversion Trading
1. **Identify Extremes**
- High positive bias (>5-10%) = Overbought
- High negative bias (<-5 to -10%) = Oversold
2. **Wait for Confirmation**
- Look for bias to turn back toward zero
- Watch for crossover labels
3. **Enter on Reversal**
- Enter long when extreme negative bias starts rising
- Enter short when extreme positive bias starts falling
#### For Divergence Trading
1. **Spot Divergence Labels**
- Yellow labels = Bullish divergence (potential buy)
- Blue labels = Bearish divergence (potential sell)
2. **Confirm with Price Action**
- Wait for price to confirm with structure break
- Look for support/resistance reactions
3. **Use Multiple EMAs**
- EMA 55 divergence: Quick reversals
- EMA 144 divergence: Reliable signals
- EMA 233 divergence: Major trend changes
#### For Multi-Timeframe Analysis
1. **Check Long-term Bias** (EMA 233)
- Determines overall market direction
2. **Find Medium-term Entry** (EMA 144)
- Look for pullbacks in long-term trend
3. **Time Short-term Entry** (EMA 55)
- Enter when short-term aligns with longer timeframes
### Trading Strategies
#### Strategy 1: Triple Confirmation
- Wait for all three bias lines to be positive (or negative)
- Enter in direction of unanimous bias
- Exit when any line crosses zero
- Best for: Strong trending markets
#### Strategy 2: Divergence Trading
- Enable all divergence detection
- Take trades only when divergence appears
- Confirm with price structure
- Best for: Range-bound and reversal setups
#### Strategy 3: Zero Line Crossover
- Enable crossover labels
- Enter long on "突破" labels
- Enter short on "跌破" labels
- Use stop loss at recent swing points
- Best for: Trend following
#### Strategy 4: Extreme Reversion
- Wait for bias to reach extremes (>10% or <-10%)
- Enter counter-trend when bias reverses
- Exit at zero line
- Best for: Ranging markets
### Best Practices
1. **Combine with Price Action**
- Don't trade bias alone
- Confirm with support/resistance
- Look for candlestick patterns
2. **Use Multiple Timeframes**
- Check higher timeframe bias
- Trade in direction of larger trend
- Use lower timeframe for entry timing
3. **Manage Risk**
- Set stop losses beyond recent swings
- Don't fight extreme bias in strong trends
- Reduce position size at extremes
4. **Customize for Your Market**
- Volatile assets: Use wider ranges
- Stable assets: Use tighter ranges
- Adjust EMA periods for your timeframe
5. **Watch for False Signals**
- Multiple small divergences = Less reliable
- Divergences at extremes = More reliable
- Confirm with other indicators
### Indicator Combinations
**With Volume:**
- High bias + Low volume = Weak move
- High bias + High volume = Strong move
**With Moving Averages:**
- Check if price is above/below key EMAs
- Bias confirms EMA trend strength
**With RSI/MACD:**
- Multiple indicator divergence = Stronger signal
- Use bias for overbought/oversold confirmation
### Performance Tips
- Disable unused features for faster loading
- Use histogram for quick visual reference
- Enable background color for trend clarity
- Use divergence detection selectively
### Common Patterns
1. **Bias Expansion**: Bias increasing = Strong trend
2. **Bias Contraction**: Bias decreasing = Trend weakening
3. **Zero Line Bounce**: Price respects EMA as support/resistance
4. **Extreme Bias**: Over-extension, watch for reversal
5. **Divergence Cluster**: Multiple EMAs diverging = High probability reversal
### Alert Conditions
You can set alerts for:
- Bias crossing above/below zero
- Extreme bias levels
- Divergence detection
- All three bias lines aligned
---
## 中文说明文档
### 概述
Scout Regiment - Bias 是一个技术指标,用于测量当前价格与指数移动平均线(EMA)之间的偏离程度(乖离率)。它帮助交易者识别超买超卖状况、趋势强度,以及通过背离检测发现潜在的反转点。
### 什么是乖离率?
乖离率衡量价格偏离移动平均线的程度,以百分比表示:
- **正乖离**:价格高于EMA(可能超买)
- **负乖离**:价格低于EMA(可能超卖)
- **计算公式**:乖离率 = (价格 - EMA) / EMA × 100
### 核心功能
#### 1. **三重EMA乖离率线**
指标计算三条不同EMA的乖离率:
- **EMA 55 乖离率**(默认:绿色/红色,1像素线)
- 短期乖离测量
- 对价格变化反应快速
- 适合日内和波段交易
- **EMA 144 乖离率**(粉色,2像素线)
- 中期乖离测量
- 对价格波动反应平衡
- 最适合波段交易
- **EMA 233 乖离率**(白色,2像素线)
- 长期乖离测量
- 反应较慢,更稳定
- 适合仓位交易
**颜色编码:**
- 绿色:价格高于EMA(看涨)
- 红色:价格低于EMA(看跌)
#### 2. **视觉组件**
**柱状图显示**
- 以柱状图形式显示EMA 55乖离率,便于可视化
- 绿色柱:价格高于EMA 55
- 红色柱:价格低于EMA 55
- 可开关显示
**背景颜色**
- 浅绿色背景:看涨乖离(价格高于EMA 55)
- 浅红色背景:看跌乖离(价格低于EMA 55)
- 可选显示,图表更清爽
**零轴**
- 零点位置的白色横线
- 正负乖离的参考点
- 穿越表示趋势变化
**穿越标签**
- "突破":乖离率向上穿越零轴
- "跌破":乖离率向下穿越零轴
- 可启用/禁用以保持清晰
#### 3. **背离检测**
指标自动检测所有三条乖离率线的常规背离:
**看涨背离(黄色标签)**
- 价格创新低
- 乖离率创更高的低点
- 暗示潜在向上反转
- 标签:"55涨"、"144涨"、"233涨"
**看跌背离(蓝色标签)**
- 价格创新高
- 乖离率创更低的高点
- 暗示潜在向下反转
- 标签:"55跌"、"144跌"、"233跌"
**背离参数**(每个EMA可自定义):
- 左侧回溯:枢轴点左侧K线数(默认:5)
- 右侧回溯:枢轴点右侧K线数(默认:1)
- 最大回溯范围:枢轴点之间最大距离(默认:60)
- 最小回溯范围:枢轴点之间最小距离(默认:5)
### 配置设置
#### Bias设置
- **EMA周期**:自定义EMA 55、144和233的长度
- **价格源**:选择计算源(默认:收盘价)
- **启用/禁用**:独立切换每条乖离率线
#### 显示设置
- **显示柱状图**:切换柱状图显示
- **显示背景颜色**:切换背景着色
- **显示突破标签**:切换突破/跌破标签
#### 背离设置(按EMA)
- EMA 55、144和233背离的独立控制
- 可自定义回溯参数用于精确调整
- 可调整范围设置以适应不同市场状况
### 使用方法
#### 趋势交易
1. **识别趋势方向**
- 价格高于零 = 上升趋势
- 价格低于零 = 下降趋势
2. **多时间框架确认**
- EMA 55:短期趋势
- EMA 144:中期趋势
- EMA 233:长期趋势
3. **顺乖离方向交易**
- 三条线全部为正 = 强劲上升趋势
- 三条线全部为负 = 强劲下降趋势
#### 均值回归交易
1. **识别极值**
- 高正乖离(>5-10%)= 超买
- 高负乖离(<-5至-10%)= 超卖
2. **等待确认**
- 等待乖离率回归零轴
- 观察穿越标签
3. **在反转时进场**
- 极端负乖离开始上升时做多
- 极端正乖离开始下降时做空
#### 背离交易
1. **发现背离标签**
- 黄色标签 = 看涨背离(潜在买入)
- 蓝色标签 = 看跌背离(潜在卖出)
2. **用价格行为确认**
- 等待价格通过结构突破确认
- 观察支撑/阻力反应
3. **使用多个EMA**
- EMA 55背离:快速反转
- EMA 144背离:可靠信号
- EMA 233背离:重大趋势变化
#### 多时间框架分析
1. **检查长期乖离**(EMA 233)
- 确定整体市场方向
2. **寻找中期入场**(EMA 144)
- 在长期趋势中寻找回调
3. **把握短期入场时机**(EMA 55)
- 短期与长期时间框架一致时进场
### 交易策略
#### 策略1:三重确认
- 等待三条乖离率线全部为正(或负)
- 顺一致乖离方向入场
- 任一线穿越零轴时离场
- 适合:强趋势市场
#### 策略2:背离交易
- 启用所有背离检测
- 仅在出现背离时交易
- 用价格结构确认
- 适合:震荡和反转设置
#### 策略3:零轴穿越
- 启用穿越标签
- 在"突破"标签时做多
- 在"跌破"标签时做空
- 在近期波动点设置止损
- 适合:趋势跟随
#### 策略4:极值回归
- 等待乖离率达到极值(>10%或<-10%)
- 乖离率反转时逆趋势入场
- 在零轴离场
- 适合:震荡市场
### 最佳实践
1. **结合价格行为**
- 不要单独使用乖离率交易
- 用支撑/阻力确认
- 寻找K线形态
2. **使用多时间框架**
- 检查更高时间框架的乖离
- 顺大趋势方向交易
- 用低时间框架把握入场时机
3. **风险管理**
- 在近期波动之外设置止损
- 不要在强趋势中对抗极端乖离
- 在极值处减少仓位
4. **针对您的市场定制**
- 波动大的资产:使用更宽的范围
- 稳定的资产:使用更紧的范围
- 根据时间框架调整EMA周期
5. **警惕假信号**
- 多个小背离 = 可靠性较低
- 极值处的背离 = 更可靠
- 用其他指标确认
### 指标组合
**与成交量配合:**
- 高乖离 + 低成交量 = 弱势波动
- 高乖离 + 高成交量 = 强势波动
**与移动平均线配合:**
- 检查价格是否在关键EMA上方/下方
- 乖离率确认EMA趋势强度
**与RSI/MACD配合:**
- 多指标背离 = 更强信号
- 使用乖离率确认超买超卖
### 性能提示
- 禁用未使用的功能以加快加载
- 使用柱状图快速视觉参考
- 启用背景颜色以清晰显示趋势
- 有选择地使用背离检测
### 常见形态
1. **乖离扩张**:乖离率增大 = 强趋势
2. **乖离收缩**:乖离率减小 = 趋势减弱
3. **零轴反弹**:价格将EMA作为支撑/阻力
4. **极端乖离**:过度延伸,注意反转
5. **背离集群**:多个EMA背离 = 高概率反转
### 警报条件
您可以为以下情况设置警报:
- 乖离率向上/向下穿越零轴
- 极端乖离水平
- 背离检测
- 三条乖离率线对齐
---
## Technical Support
For questions or issues, please refer to the TradingView community or contact the indicator creator.
## 技术支持
如有问题,请参考TradingView社区或联系指标创建者。

EMA 12-26-100 Momentum Strategy# Triple EMA Multi-Signal Momentum Strategy
## 📊 Overview
**Triple EMA Multi-Signal** is a comprehensive trend-following momentum strategy designed specifically for cryptocurrency markets. It combines multiple technical indicators and signal types to identify high-probability trading opportunities while maintaining strict risk management protocols.
The strategy excels in trending markets and uses adaptive position sizing with trailing stops to maximize profits during strong trends while protecting capital during choppy conditions.
## 🎯 Core Algorithm
### Triple EMA System
The strategy employs a three-layer EMA system to identify trend direction and strength:
- **Fast EMA (12)**: Quick response to price changes
- **Slow EMA (26)**: Confirmation of trend direction
- **Trend EMA (100)**: Overall market bias filter
Trades are only taken when all three EMAs align in the same direction, ensuring we trade with the dominant trend.
### Multi-Signal Confirmation (8 Signal Types)
The strategy requires at least 1-2 confirmed signals from multiple independent sources before entering a position:
1. **EMA Crossover** - Fast EMA crossing Slow EMA (primary signal)
2. **MACD Cross** - MACD line crossing signal line (momentum confirmation)
3. **RSI Reversal** - RSI bouncing from oversold/overbought zones
4. **Price Action** - Strong bullish/bearish candles (>60% of range)
5. **Volume Spike** - Above-average volume confirmation
6. **Breakout** - Price breaking 20-period high/low with volume
7. **Pullback to EMA** - Trend continuation after healthy retracement
8. **Bollinger Bounce** - Price bouncing from BB bands
This multi-signal approach significantly reduces false signals and improves win rate.
## 💰 Risk Management
### Position Sizing
- Default: 20-25% of equity per trade
- Adjustable based on risk tolerance
- Smaller positions recommended for leveraged trading
### Stop Loss & Take Profit
- **Stop Loss**: 2.0% (tight control of risk)
- **Take Profit**: 5.5% (2.75:1 reward-to-risk ratio)
- Both levels are fixed at entry to avoid emotional decisions
### Trailing Stop System
- Activates after 1.8% profit
- Trails at 1.3% below current price
- Locks in profits during extended trends
- Automatically adjusts as price moves in your favor
### Maximum Hold Time
- 36-48 hours maximum (configurable)
- Designed to minimize funding rate costs on futures
- Forces position closure to avoid excessive exposure
- Helps maintain capital velocity
## 📈 Key Features
### Trend Filters
- **ADX Filter**: Ensures sufficient trend strength (threshold: 20)
- **EMA Alignment**: All three EMAs must confirm trend direction
- **RSI Boundaries**: Avoids extreme overbought/oversold entries
### Volume Analysis
- Volume must exceed 20-period moving average
- Configurable multiplier (default: 1.0x)
- Helps identify institutional participation
### Automatic Exit Conditions
1. Take Profit target reached
2. Stop Loss triggered
3. Trailing stop activated
4. Trend reversal (EMA cross in opposite direction)
5. Maximum hold time exceeded
## 🎮 Recommended Settings
### For Spot Trading (Conservative)
```
Position Size: 15-20%
Stop Loss: 2.5%
Take Profit: 6.0%
Max Hold: 72 hours
Leverage: 1x
```
### For Futures 3-5x Leverage (Balanced)
```
Position Size: 12-15%
Stop Loss: 2.0%
Take Profit: 5.5%
Max Hold: 36 hours
Trailing: Active
```
### For Aggressive Trading 5-10x (High Risk)
```
Position Size: 8-12%
Stop Loss: 1.5%
Take Profit: 4.5%
Max Hold: 24 hours
ADX Filter: Disabled
```
## 📊 Performance Metrics
### Backtested Results (BTC/USDT 1H, 2 years)
- **Total Return**: ~19% (spot) / ~75% (5x leverage)*
- **Total Trades**: 240-300
- **Win Rate**: 49-52%
- **Profit Factor**: 1.25-1.50
- **Max Drawdown**: ~18-22%
- **Average Trade**: 0.5-3 days
*Leverage results exclude funding rates and real-world slippage
### Optimal Timeframes
- **1 Hour**: Best for active trading (recommended)
- **4 Hour**: More stable, fewer signals
- **15 Min**: High frequency (requires monitoring)
### Best Performing Assets
- BTC/USDT (most tested)
- ETH/USDT
- Major altcoins with good liquidity
- Not recommended for low-cap or illiquid pairs
## ⚙️ How to Use
1. **Add to Chart**: Apply strategy to 1H BTC/USDT chart
2. **Adjust Settings**: Configure risk parameters based on your preference
3. **Review Signals**: Green = Long, Red = Short, labels show signal count
4. **Monitor Performance**: Check strategy tester for detailed statistics
5. **Optimize**: Use strategy optimization to find best parameters for your market
## 🎨 Visual Indicators
The strategy provides clear visual feedback:
- **EMA Lines**: Blue (Fast), Red (Slow), Orange (Trend)
- **BUY/SELL Labels**: Show entry points with signal count
- **Stop/Target Lines**: Red (SL), Green (TP) displayed during active trades
- **Background Color**: Light green (long), light red (short) when in position
- **Info Panel**: Shows current trend, RSI, ADX, and volume status
## ⚠️ Important Notes
### Risk Disclaimer
- This strategy is for educational purposes only
- Past performance does not guarantee future results
- Cryptocurrency trading involves substantial risk
- Only trade with capital you can afford to lose
- Always use proper position sizing and risk management
### Limitations
- Performs poorly in sideways/choppy markets
- Requires sufficient liquidity for best execution
- Backtests do not include:
- Real-world slippage (especially during volatility)
- Funding rates (for perpetual futures)
- Exchange downtime or connection issues
- Emotional trading decisions
### For Futures Trading
If using this strategy on futures with leverage:
- Reduce position size proportionally to leverage
- Account for funding rates (~0.01% per 8h)
- Set max hold time to minimize funding costs
- Use lower leverage (3-5x max recommended)
- Monitor liquidation price carefully
## 🔧 Customization
All parameters are fully customizable:
- EMA periods (fast/slow/trend)
- MACD settings (12/26/9)
- RSI levels (30/70)
- Stop Loss / Take Profit percentages
- Trailing stop activation and offset
- Volume multiplier
- ADX threshold
- Maximum hold time
## 📚 Strategy Logic
The strategy follows this decision tree:
```
1. Check Trend Direction (EMA alignment)
↓
2. Scan for Entry Signals (8 types)
↓
3. Confirm with Filters (ADX, Volume, RSI)
↓
4. Enter Position with Fixed SL/TP
↓
5. Monitor for Exit Conditions:
- TP Hit → Close with profit
- SL Hit → Close with loss
- Trailing Active → Follow price
- Trend Reversal → Close position
- Max Time → Force close
```
## 🎓 Best Practices
1. **Start Conservative**: Use smaller position sizes initially
2. **Track Performance**: Monitor actual vs backtested results
3. **Optimize Regularly**: Market conditions change, adapt parameters
4. **Combine with Analysis**: Don't rely solely on automated signals
5. **Manage Emotions**: Stick to the system, avoid manual overrides
6. **Paper Trade First**: Test on demo before risking real capital
## 📞 Support & Updates
This strategy is actively maintained and updated based on:
- Market condition changes
- User feedback and suggestions
- Performance optimization
- Bug fixes and improvements
## 🏆 Conclusion
Triple EMA Multi-Signal Strategy offers a robust, systematic approach to cryptocurrency trading by combining trend following, momentum indicators, and strict risk management. Its multi-signal confirmation system helps filter false signals while the trailing stop mechanism captures extended trends.
The strategy is suitable for both manual traders looking for high-probability setups and algorithmic traders seeking a proven systematic approach.
**Remember**: No strategy wins 100% of the time. Success comes from consistent application, proper risk management, and continuous adaptation to changing market conditions.
---
*Version: 1.0*
*Last Updated: November 2025*
*Tested on: BTC/USDT, ETH/USDT (1H, 4H timeframes)*
*Recommended Capital: $5,000+ for optimal position sizing*

EREMA SignalsOverview
The EREMA Signals indicator is a specialized overlay tool designed to display precise buy and sell signals directly on your price chart. Working as a companion to the main Ehlers Reverse EMA indicator, it brings powerful momentum-based signals to your trading strategy without cluttering your chart with additional indicator panels.
Key Features
On-Chart Signal Visualization: Clear buy/sell arrows appear directly on the price chart
Dynamic Signal Positioning: Signals automatically adjust their distance from price using ATR for optimal visibility
Multiple Signal Types: Choose from three distinct signal generation methods
Clean Chart Interface: Displays only the essential signals, maintaining chart clarity
Signal Types
Zero Cross: Generates signals when the Ehlers Reverse EMA crosses above/below the zero line
MA Cross: Identifies when the Ehlers Reverse EMA crosses its own moving average
Zero & MA Cross: The strictest filter, requiring both zero line and MA crossovers for signal generation
How To Use
Setup
First add the main "Ehlers Reverse EMA" indicator to your chart
Then add this "EREMA Signals" indicator as an overlay
Configure both indicators with identical settings for alpha, MA type, and signal method
Reading Signals
Green Triangles (below price): Buy signals indicating potential upward momentum
Red Triangles (above price): Sell signals indicating potential downward momentum
Trading Applications
Trend Identification: Zero cross signals help identify changes in overall trend direction
Momentum Trading: MA cross signals can identify shorter-term momentum shifts
Confirmation Tool: Use alongside other technical indicators or price action strategies
Multiple Timeframe Analysis: Apply to different timeframes for more robust trading decisions
Best Practices
Consider using longer timeframes (4H, Daily) for more reliable signals
The combined "Zero & MA Cross" setting provides fewer but higher-quality signals
For tighter entries, use the "MA Cross" option in established trends
Adjust the Alpha parameter to match your trading style (lower for longer-term, higher for shorter-term)
This indicator works seamlessly with the main Ehlers Reverse EMA indicator while maintaining a clean chart interface, making it ideal for traders who prefer visual simplicity without sacrificing analytical power.

Opening Range Breakout with Multi-Timeframe Liquidity]═══════════════════════════════════════
OPENING RANGE BREAKOUT WITH MULTI-TIMEFRAME LIQUIDITY
═══════════════════════════════════════
A professional Opening Range Breakout (ORB) indicator enhanced with multi-timeframe liquidity detection, trading session visualization, volume analysis, and trend confirmation tools. Designed for intraday trading with comprehensive alert system.
───────────────────────────────────────
WHAT THIS INDICATOR DOES
───────────────────────────────────────
This indicator combines multiple trading concepts:
- Opening Range Breakout (ORB) - Customizable time period detection with automatic high/low identification
- Multi-Timeframe Liquidity - HTF (Higher Timeframe) and LTF (Lower Timeframe) key level detection
- Trading Sessions - Tokyo, London, New York, and Sydney session visualization
- Volume Analysis - Volume spike detection and strength measurement
- Multi-Timeframe Confirmation - Trend bias from higher timeframes
- EMA Integration - Trend filter and dynamic support/resistance
- Smart Alerts - Quality-filtered breakout notifications
───────────────────────────────────────
HOW IT WORKS
───────────────────────────────────────
OPENING RANGE BREAKOUT (ORB):
Concept:
The Opening Range is a period at the start of a trading session where price establishes an initial high and low. Breakouts beyond this range often indicate the direction of the day's trend.
Detection Method:
- Default: 15-minute opening range (configurable)
- Custom Range: Set specific session times with timezone support
- Automatically identifies ORH (Opening Range High) and ORL (Opening Range Low)
- Tracks ORB mid-point for reference
Range Establishment:
1. Session starts (or custom time begins)
2. Tracks highest high and lowest low during the period
3. Range confirmed at end of opening period
4. Levels extend throughout the session
Breakout Detection:
- Bullish Breakout: Close above ORH
- Bearish Breakout: Close below ORL
- Mid-point acts as bias indicator
Visual Display:
- Shaded box during range formation
- Horizontal lines for ORH, ORL, and mid-point
- Labels showing level values
- Color-coded fills based on selected method
Fill Color Methods:
1. Session Comparison:
- Green: Current OR mid > Previous OR mid
- Red: Current OR mid < Previous OR mid
- Gray: Equal or first session
- Shows day-over-day momentum
2. Breakout Direction (Recommended):
- Green: Price currently above ORH (bullish breakout)
- Red: Price currently below ORL (bearish breakout)
- Gray: Price inside range (no breakout)
- Real-time breakout status
MULTI-TIMEFRAME LIQUIDITY:
Two-Tier System for comprehensive level identification:
HTF (Higher Timeframe) Key Liquidity:
- Default: 4H timeframe (configurable to Daily, Weekly)
- Identifies major institutional levels
- Uses pivot detection with adjustable parameters
- Suitable for swing highs/lows where large orders rest
LTF (Lower Timeframe) Key Liquidity:
- Default: 1H timeframe (configurable)
- Provides precision entry/exit levels
- Finer granularity for intraday trading
- Captures minor swing points
Calculation Method:
- Pivot high/low detection algorithm
- Configurable left bars (lookback) and right bars (confirmation)
- Timeframe multiplier for accurate multi-timeframe detection
- Automatic level extension
Mitigation System:
- Tracks when levels are swept (broken)
- Configurable mitigation type: Wick or Close-based
- Option to remove or show mitigated levels
- Display limit prevents chart clutter
Asset-Specific Optimization:
The indicator includes quick reference settings for different assets:
- Major Forex (EUR/USD, GBP/USD): Default settings optimal
- Crypto (BTC/ETH): Left=12, Right=4, Display=7
- Gold: HTF=1D, Left=20
TRADING SESSIONS:
Four Major Sessions with Full Customization:
Tokyo Session:
- Default: 04:00-13:00 UTC+4
- Asian trading hours
- Often sets daily range
London Session:
- Default: 11:00-20:00 UTC+4
- Highest liquidity period
- Major institutional activity
New York Session:
- Default: 16:00-01:00 UTC+4
- US market hours
- High-impact news events
Sydney Session:
- Default: 01:00-10:00 UTC+4
- Earliest Asian activity
- Lower volatility
Session Features:
- Shaded background boxes
- Session name labels
- Optional open/close lines
- Session high/low tracking with colored lines
- Each session has independent color settings
- Fully customizable times and timezones
VOLUME ANALYSIS:
Volume-Based Trade Confirmation:
Volume MA:
- Configurable period (default: 20)
- Establishes average volume baseline
- Used for spike detection
Volume Spike Detection:
- Identifies when volume exceeds MA * multiplier
- Default: 1.5x average volume
- Confirms breakout strength
Volume Strength Measurement:
- Calculates current volume as percentage of average
- Shows relative volume intensity
- Used in alert quality filtering
High Volume Bars:
- Identifies bars above 50th percentile
- Additional confirmation layer
- Indicates institutional participation
MULTI-TIMEFRAME CONFIRMATION:
Trend Bias from Higher Timeframes:
HTF 1 (Trend):
- Default: 1H timeframe
- Uses EMA to determine intermediate trend
- Compares current timeframe EMA to HTF EMA
HTF 2 (Bias):
- Default: 4H timeframe
- Uses 50 EMA for longer-term bias
- Confirms overall market direction
Bias Classifications:
- Bullish Bias: HTF close > HTF 50 EMA AND Current EMA > HTF1 EMA
- Bearish Bias: HTF close < HTF 50 EMA AND Current EMA < HTF1 EMA
- Neutral Bias: Mixed signals between timeframes
EMA Stack Analysis:
- Compares EMA alignment across timeframes
- +1: Bullish stack (lower TF EMA > higher TF EMA)
- -1: Bearish stack (lower TF EMA < higher TF EMA)
- 0: Neutral/crossed
Usage:
- Filters false breakouts
- Confirms trend direction
- Improves trade quality
EMA INTEGRATION:
Dynamic EMA for Trend Reference:
Features:
- Configurable period (default: 20)
- Customizable color and width
- Acts as dynamic support/resistance
- Trend filter for ORB trades
Application:
- Above EMA: Favor long breakouts
- Below EMA: Favor short breakouts
- EMA cross: Potential trend change
- Distance from EMA: Momentum gauge
SMART ALERT SYSTEM:
Quality-Filtered Breakout Notifications:
Alert Types:
1. Standard ORB Breakout
2. High Quality ORB Breakout
Quality Criteria:
- Volume Confirmation: Volume > 1.2x average
- MTF Confirmation: Bias aligned with breakout direction
Standard Alert:
- Basic breakout detection
- Price crosses ORH or ORL
- Icon: 🚀 (bullish) or 🔻 (bearish)
High Quality Alert:
- Both volume AND MTF confirmed
- Stronger probability setup
- Icon: 🚀⭐ (bullish) or 🔻⭐ (bearish)
Alert Information Includes:
- Alert quality rating
- Breakout level and current price
- Volume strength percentage (if enabled)
- MTF bias status (if enabled)
- Recommended action
One Alert Per Bar:
- Prevents alert spam
- Uses flag system to track sent alerts
- Resets on new ORB session
───────────────────────────────────────
HOW TO USE
───────────────────────────────────────
OPENING RANGE SETUP:
Basic Configuration:
1. Select time period for opening range (default: 15 minutes)
2. Choose fill color method (Breakout Direction recommended)
3. Enable historical data display if needed
Custom Range (Advanced):
1. Enable Custom Range toggle
2. Set specific session time (e.g., 0930-0945)
3. Select appropriate timezone
4. Useful for specific market opens (NYSE, LSE, etc.)
LIQUIDITY LEVELS SETUP:
Quick Configuration by Asset:
- Forex: Use default settings (Left=15, Right=5)
- Crypto: Set Left=12, Right=4, Display=7
- Gold: Set HTF=1D, Left=20
HTF Liquidity:
- Purpose: Major support/resistance levels
- Recommended: 4H for day trading, 1D for swing trading
- Use as profit targets or reversal zones
LTF Liquidity:
- Purpose: Entry/exit refinement
- Recommended: 1H for day trading, 4H for swing trading
- Use for position management
Mitigation Settings:
- Wick-based: More sensitive (default)
- Close-based: More conservative
- Remove or Show mitigated levels based on preference
TRADING SESSIONS SETUP:
Enable/Disable Sessions:
- Master toggle for all sessions
- Individual session controls
- Show/hide session names
Session High/Low Lines:
- Enable to see session extremes
- Each session has custom colors
- Useful for range trading
Customization:
- Adjust session times for your broker
- Set timezone to match your location
- Customize colors for visibility
VOLUME ANALYSIS SETUP:
Enable Volume Analysis:
1. Toggle on Volume Analysis
2. Set MA length (20 recommended)
3. Adjust spike multiplier (1.5 typical)
Usage:
- Confirm breakouts with volume
- Identify climactic moves
- Filter false signals
MULTI-TIMEFRAME SETUP:
HTF Selection:
- HTF 1 (Trend): 1H for day trading, 4H for swing
- HTF 2 (Bias): 4H for day trading, 1D for swing
Interpretation:
- Trade only with bias alignment
- Neutral bias: Be cautious
- Bias changes: Potential reversals
EMA SETUP:
Configuration:
- Period: 20 for responsive, 50 for smoother
- Color: Choose contrasting color
- Width: 1-2 for visibility
Usage:
- Filter trades: Long above, Short below
- Dynamic support/resistance reference
- Trend confirmation
ALERT SETUP:
TradingView Alert Creation:
1. Enable alerts in indicator settings
2. Enable ORB Breakout Alerts
3. Right-click chart → Add Alert
4. Select this indicator
5. Choose "Any alert() function call"
6. Configure delivery method (mobile, email, webhook)
Alert Filtering:
- All alerts include quality rating
- High Quality alerts = Volume + MTF confirmed
- Standard alerts = Basic breakout only
───────────────────────────────────────
TRADING STRATEGIES
───────────────────────────────────────
CLASSIC ORB STRATEGY:
Setup:
1. Wait for opening range to complete
2. Price breaks and closes above ORH or below ORL
3. Volume > average (if enabled)
4. MTF bias aligned (if enabled)
Entry:
- Bullish: Buy on break above ORH
- Bearish: Sell on break below ORL
- Consider retest entries for better risk/reward
Stop Loss:
- Bullish: Below ORL or range mid-point
- Bearish: Above ORH or range mid-point
- Adjust based on volatility
Targets:
- Initial: Range width extension (ORH + range width)
- Secondary: HTF liquidity levels
- Final: Session high/low or major support/resistance
ORB + LIQUIDITY CONFLUENCE:
Enhanced Setup:
1. Opening range established
2. HTF liquidity level near or beyond ORH/ORL
3. Breakout occurs with volume
4. Price targets the liquidity level
Entry:
- Enter on ORB breakout
- Target the HTF liquidity level
- Use LTF liquidity for position management
Management:
- Partial profits at ORB + range width
- Move stop to breakeven at LTF liquidity
- Final exit at HTF liquidity sweep
ORB REJECTION STRATEGY (Counter-Trend):
Setup:
1. Price breaks above ORH or below ORL
2. Weak volume (below average)
3. MTF bias opposite to breakout
4. Price closes back inside range
Entry:
- Failed bullish break: Short below ORH
- Failed bearish break: Long above ORL
Stop Loss:
- Beyond the failed breakout level
- Or beyond session extreme
Target:
- Opposite end of opening range
- Range mid-point for partial profit
SESSION-BASED ORB TRADING:
Tokyo Session:
- Typically narrower ranges
- Good for range trading
- Wait for London open breakout
London Session:
- Highest volume and volatility
- Strong ORB setups
- Major liquidity sweeps common
New York Session:
- Strong trending moves
- News-driven volatility
- Good for momentum trades
Sydney Session:
- Quieter conditions
- Suitable for range strategies
- Sets up Tokyo session
EMA-FILTERED ORB:
Rules:
- Only take bullish breaks if price > EMA
- Only take bearish breaks if price < EMA
- Ignore counter-trend breaks
Benefits:
- Reduces false signals
- Aligns with larger trend
- Improves win rate
───────────────────────────────────────
CONFIGURATION GUIDE
───────────────────────────────────────
OPENING RANGE SETTINGS:
Time Period:
- 15 min: Standard for most markets
- 30 min: Wider range, fewer breakouts
- 60 min: For slower markets or swing trades
Custom Range:
- Use for specific market opens
- NYSE: 0930-1000 EST
- LSE: 0800-0830 GMT
- Set timezone to match exchange
Historical Display:
- Enable: See all previous session data
- Disable: Cleaner chart, current session only
LIQUIDITY SETTINGS:
Left Bars (5-30):
- Lower: More frequent, sensitive levels
- Higher: Fewer, more significant levels
- Recommended: 15 for most markets
Right Bars (1-25):
- Confirmation period
- Higher: More reliable, less frequent
- Recommended: 5 for balance
Display Limit (1-20):
- Number of active levels shown
- Higher: More context, busier chart
- Recommended: 7 for clarity
Extension Options:
- Short: Levels visible near formation
- Current: Extended to current bar (recommended)
- Max: Extended indefinitely
VOLUME SETTINGS:
MA Length (5-50):
- Shorter: More responsive to spikes
- Longer: Smoother baseline
- Recommended: 20 for balance
Spike Multiplier (1.0-3.0):
- Lower: More sensitive spike detection
- Higher: Only extreme spikes
- Recommended: 1.5 for day trading
MULTI-TIMEFRAME SETTINGS:
HTF 1 (Trend):
- 5m chart: Use 15m or 1H
- 15m chart: Use 1H or 4H
- 1H chart: Use 4H or 1D
HTF 2 (Bias):
- One level higher than HTF 1
- Provides longer-term context
- Don't use same as HTF 1
EMA SETTINGS:
Length:
- 20: Responsive, more signals
- 50: Smoother, stronger filter
- 200: Long-term trend only
Style:
- Choose contrasting color
- Width 1-2 for visibility
- Match your trading style
───────────────────────────────────────
BEST PRACTICES
───────────────────────────────────────
Chart Timeframe Selection:
- ORB Trading: Use 5m or 15m charts
- Session Review: Use 1H or 4H charts
- Swing Trading: Use 1H or 4H charts
Quality Over Quantity:
- Wait for high-quality alerts (volume + MTF)
- Avoid trading every breakout
- Focus on confluence setups
Risk Management:
- Position size based on range width
- Wider ranges = smaller positions
- Use stop losses always
- Take partial profits at targets
Market Conditions:
- Best results in trending markets
- Reduce position size in choppy conditions
- Consider session overlaps for volatility
- Avoid trading near major news if inexperienced
Continuous Improvement:
- Track win rate by session
- Note which confluence factors work best
- Adjust settings based on market volatility
- Review performance weekly
───────────────────────────────────────
PERFORMANCE OPTIMIZATION
───────────────────────────────────────
This indicator is optimized with:
- max_bars_back declarations for efficient processing
- Conditional calculations based on enabled features
- Proper memory management for drawing objects
- Minimal recalculation on each bar
Best Practices:
- Disable unused features (sessions, MTF, volume)
- Limit historical display to reduce rendering
- Use appropriate timeframe for your strategy
- Clear old drawing objects periodically
───────────────────────────────────────
EDUCATIONAL DISCLAIMER
───────────────────────────────────────
This indicator combines established trading concepts:
- Opening Range Breakout theory (price action)
- Liquidity level detection (pivot analysis)
- Session-based trading (time-of-day patterns)
- Volume analysis (confirmation technique)
- Multi-timeframe analysis (trend alignment)
All calculations use standard technical analysis methods:
- Pivot high/low detection algorithms
- Moving averages for trend and volume
- Session time filtering
- Timeframe security functions
The indicator identifies potential trading setups but does not predict future price movements. Success requires proper application within a complete trading strategy including risk management, position sizing, and market context.
───────────────────────────────────────
USAGE DISCLAIMER
───────────────────────────────────────
This tool is for educational and analytical purposes. Opening Range Breakout trading involves substantial risk. The alert system and quality filters are designed to identify potential setups but do not guarantee profitability. Always conduct independent analysis, use proper risk management, and never risk capital you cannot afford to lose. Past performance does not indicate future results. Trading intraday breakouts requires experience and discipline.
───────────────────────────────────────
CREDITS & ATTRIBUTION
───────────────────────────────────────
ORIGINAL SOURCE:
This indicator builds upon concepts from LuxAlgo's-ORB

TASC 2021.11 MADH Moving Average Difference, Hann█ OVERVIEW
Presented here is code for the "Moving Average Difference, Hann" indicator originally conceived by John Ehlers. The code is also published in the November 2021 issue of Trader's Tips by Technical Analysis of Stocks & Commodities (TASC) magazine.
█ CONCEPTS
By employing a Hann windowed finite impulse response filter (FIR), John Ehlers has enhanced the Moving Average Difference (MAD) to provide an oscillator with exceptional smoothness.
Of notable mention, the wave form of MADH resembles Ehlers' "Reverse EMA" Indicator, formerly revealed in the September 2017 issue of TASC. Many variations of the "Reverse EMA" were published in TradingView's Public Library.
█ FEATURES
Three values in the script's "Settings/Inputs" provide control over the oscillators behavior:
• The price source
• A "Short Length" with a default of 8, to manage the lower band edge of the oscillator
• The "Dominant Cycle", originally set at 27, which appears to be a placeholder for an adaptive control mechanism
Two coloring options are provided for the line's fill:
• "ZeroCross", the default, uses the line's position above/below the zero level. This is the mode used in the top version of MADH on this chart.
• "Momentum" uses the line's up/down state, as shown in the bottom version of the indicator on the chart.
█ NOTES
Calculations
The source price is used in two independent Hann windowed FIR filters having two different periods (lengths) of historical observation for calculation, one being a "Short Length" and the other termed "Dominant Cycle". These are then passed to a "rate of change" calculation and then returned by the reusable function. The secret sauce is that a "windowed Hann FIR filter" is superior tp a generic SMA filter, and that ultimately reveals Ehlers' clever enhancement. We'll have to wait and see what ingenuities Ehlers has next to unleash. Stay tuned...
The `madh()` function code was optimized for computational efficiency in Pine, differing visibly from Ehlers' original formula, but yielding the same results as Ehlers' version.
Background
This indicator has a sibling indicator discussed in the "The MAD Indicator, Enhanced" article by Ehlers. MADH is an evolutionary update from the prior MAD indicator code published in the October 2021 issue of TASC.
Sibling Indicators
• Moving Average Difference (MAD)
• Cycle/Trend Analytics
Related Information
• Cycle/Trend Analytics And The MAD Indicator
• The Reverse EMA Indicator
• Hann Window
• ROC
Join TradingView!

EMAs Personalizáveis (até 5)📘 Indicator Explanation – Customizable EMAs (up to 5)
This indicator was developed in Pine Script v6 to make it easier to visualize multiple Exponential Moving Averages (EMAs) on a single chart.
🔑 Main features:
Supports up to 5 different EMAs.
Ability to enable or disable each EMA individually.
Fully customizable period for each EMA.
Flexible color selection for better visual organization.
Adjustable line thickness to highlight the most relevant levels.
📌 How to use:
Open the indicator settings.
Select which EMAs you want to display (from 1 to 5).
Define the period (e.g., 20, 50, 100, 200, etc.).
Choose a color for each EMA.
Observe price behavior relative to the EMAs to identify:
Trends → price above long EMAs indicates bullish strength.
Reversals → EMA crossovers may signal a change in direction.
Dynamic support and resistance → EMAs often act as reaction zones for price.
💡 Practical example:
Short EMA (20) → shows short-term movement.
Mid-term EMA (50 or 100) → confirms trend direction.
Long EMA (200 or 500) → indicates the overall market trend.
👉 This indicator is flexible and can be used for scalping, swing trading, or position trading, depending on the chosen periods.
Ehlers Reverse Exponential Moving AverageEhlers Reverse Exponential Moving Average script.
This indicator was originally developed by John F. Ehlers (Stocks & Commodities V. 35:10: The Reverse EMA Indicator).

BONK/USD (1H) - $4k DCA + Dual Trailing + Date FilterThis strategy trades BONK/USD on the 1-hour chart, employing a Dollar-Cost Averaging (DCA) approach for long entries.
It initiates a Base Order when a faster Exponential Moving Average (EMA) crosses above a slower one (signaling a potential uptrend, default 9/21 EMA). If the price declines after entry, it can automatically place up to two additional Safety Orders at predetermined lower levels, calculated using either Average True Range (ATR) volatility or fixed percentage drops.
Exits are triggered by a trend reversal (EMA crossunder) or a dual trailing stop-loss mechanism, which includes both a standard trail and a tighter profit-locking trail activated after reaching a certain profit target.
The strategy includes user-configurable inputs for all key parameters (EMAs, order sizes, trailing stops, SO spacing) and an optional date filter to limit backtesting or execution to a specific period. It also generates alerts formatted for potential automation with platforms like 3Commas.

GARCH Range PredictorThis was inspired by deltatrendtrading's video on GARCH models to predict daily trading ranges and identify favorable trading conditions. Based on advanced volatility forecasting techniques, it predicts whether a trading day's true range will exceed a threshold, helping traders decide when to trade or skip a session.
Key Features
GARCH(1,1) Volatility Modeling: Uses log-transformed true ranges with exponential moving average centering
Forward-Looking Predictions: Makes predictions at session start before the day unfolds
Dynamic or Static Thresholds: Choose between fixed dollar thresholds or adaptive 20-day averages
Accuracy Tracking: Monitors prediction accuracy with overall and recent (20-day) hit rates
Visual Session Boxes: Colors trading sessions green (trade) or red (skip) based on predictions
Real-Time Statistics: Displays current predictions, thresholds, and performance metrics
How It Works
Data Transformation: Log-transforms daily true ranges and centers them using an EMA
Variance Modeling: Updates GARCH variance using: σ²ₜ = ω + α(residual²) + β(σ²ₜ₋₁)
Prediction Generation: Back-transforms log predictions to dollar values
Signal Generation: Compares predictions to threshold to generate trade/skip signals
Performance Tracking: Validates predictions against actual outcomes
Parameters
GARCH Parameters (ω, α, β): Control volatility persistence and mean reversion
EMA Period: Smoothing period for log range centering
Threshold Settings: Static dollar amount or dynamic multiplier of recent averages
Session Time: Define regular trading hours for analysis
Best Use Cases
Breakout and momentum strategies that perform better on high-range days
Risk management by avoiding low-volatility sessions
Futures day trading (optimized for MNQ/NQ detection)
Any strategy where daily range impacts profitability
Important Notes
Requires 5+ sessions for initialization and warm-up
Accuracy depends heavily on proper parameter tuning for your specific instrument
Default parameters may need adjustment for different markets
Monitor the hit rate to validate effectiveness on your timeframe

TrapLightTrap Light is built off the stochastic RSI to provide convenience and make your entries while scalping either long/short more straightforward.
Notes/Disclaimer:
This indicator is not guaranteed to work every time. Use it at your own discretion and perform your own due diligence. None of this is financial advice.
The main idea behind this is that when the stochastic RSI reaches such extremes that it often moves in a favorable direction.
K = momentum or the blue line of the stochastic RSI indicator.
Perks:
Don't have to look away from candlesticks and measure stochastic RSI's K level.
Simple visual indication of what to do.
Don't have to stare at your chart all day waiting for things to get exciting.
How to Use:
(Above the current candlestick on any timeframe)
1. When K is greater than or equal to 99.5, it shows a sell signal. This is to indicate a short entry.
2. When K is less than or equal to 0.5, it shows a buy signal. This is to indicate a long entry.
3. If neither the conditions for a short/long entry are present, it shows a circle that is like a traffic light.
Red Light: When K is between 99.5 and 95, a red circle is shown to indicate that a short entry may be available soon.
Yellow Light: When K is between 95 and 5, a yellow circle is shown to indicate that neither a long nor short entry may be available soon.
Green Light: When K is between 5 and 0.5, a green circle is shown to indicate that a long entry may be available soon.
Alerts:
Set an alert on the ticker you trade to notify you when either the green or red light is present so that you have time to prepare to make an entry either long/short.
The Code:
The PineScript is open-source and annotated to explain different parts of the script for ease of understanding.
@Credit to Kingson1 for this strategy and his feedback on its creation/implementation.
