RSI Oversold/UndersoldThe study script will place GREEN BUY arrows BELOW oversold conditions and RED SHORT arrows ABOVE overbought conditions. You can configure the period
Most RSI(14) indicators use a 14-period, I prefer a 5-period. The period, overbought and oversold periods are settings that can easily be changed by adding this study to your chart and clicking the "gear" icon next to the study inside your chart.
Search in scripts for "Rsi"

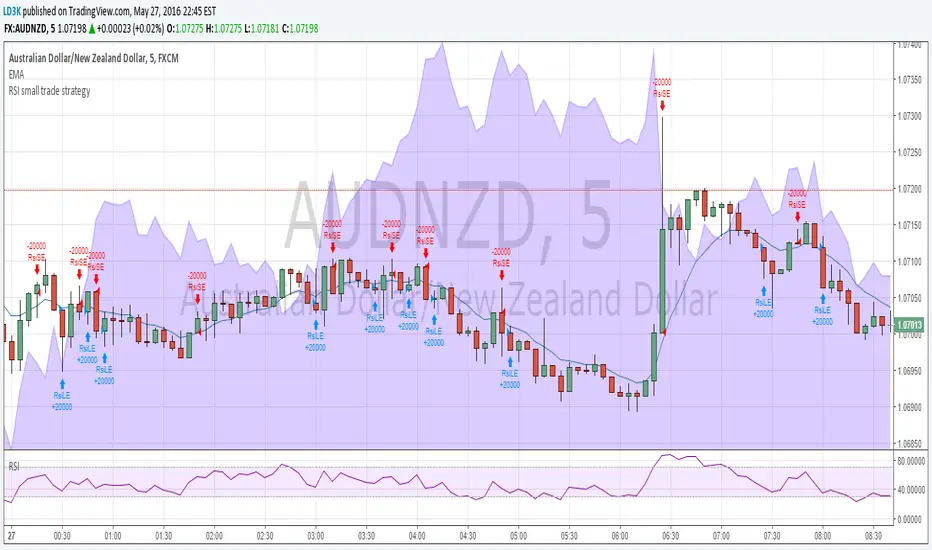
RSI small trade strategyTrialling a small gains strategy.
Unfortunately it caps out at 2000 trades otherwise I would be improving the maximum loss of stopping out trades once the RSI entered an overbought or oversold region
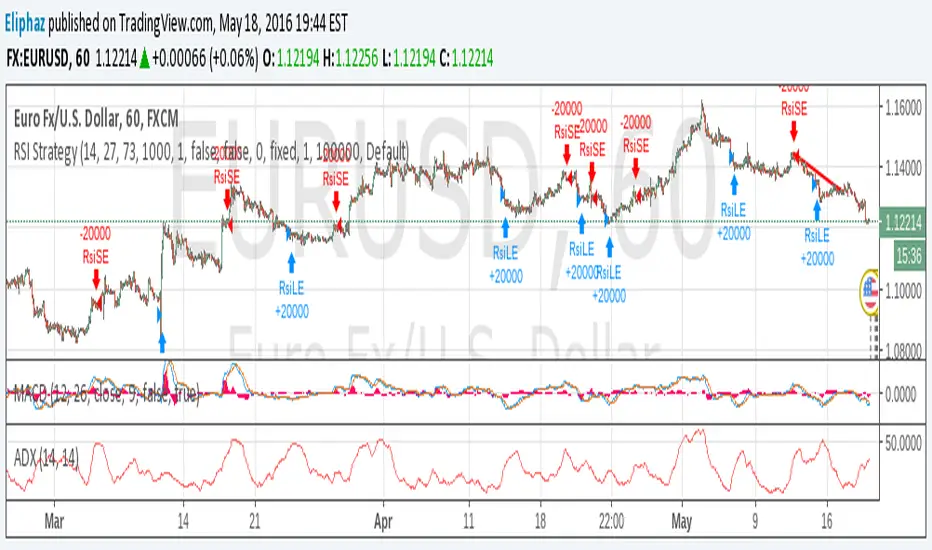
RSI Strategy EUR/USD 1H 700%A rsi strategy that has potential to do over 700% annually on the EURUSD 1h


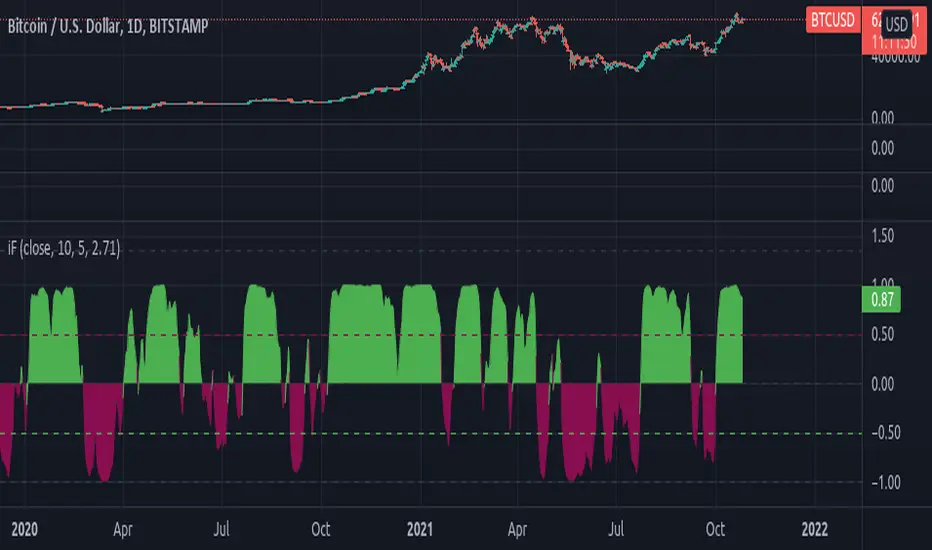
[RS]RSI Inverse Fisher Transform V1RSI inverse fisher transform (fishy turbo) as described here:
autotradingstrategy.wordpress.com
forexsb.com
update:
added color conditional.
[RS]RSI Inverse Fisher Transform V0RSI inverse fisher transform (fishy turbo) as described here:
autotradingstrategy.wordpress.com
forexsb.com

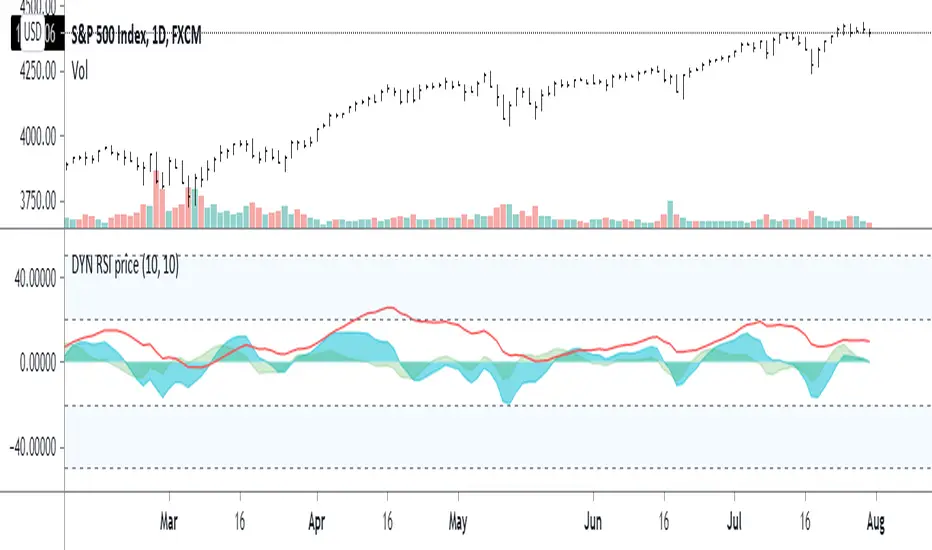
RSI InertiaRedline - vanilla RSI (where are we now)
Aqua - first difference/moment (how fast are we going)
Grey/Green - Second difference/moment (are we speeding up / slowing down?) aka Inertia

RSI-EMA IndicatorThis indicator calculates and plots 2 separate EMAs of the RSI. The default settings below work great on SPX/SPY daily chart. General rule is if an EMA is above 50, the stock's near term outlook is bullish. If an EMA is below 50, the near term outlook is bearish. Personally, I like to use a fast EMA as a buy signal and a slow EMA as a sell signal.
Default settings:
RSI = 50
EMA1 = 100
EMA2 = 200


RSI HistoAlert StrategyThis is simple indicator modified RSI Strategy
You can use in the xPrice any series: Open, High, Low, Close, HL2, HLC3, OHLC4 and ect...

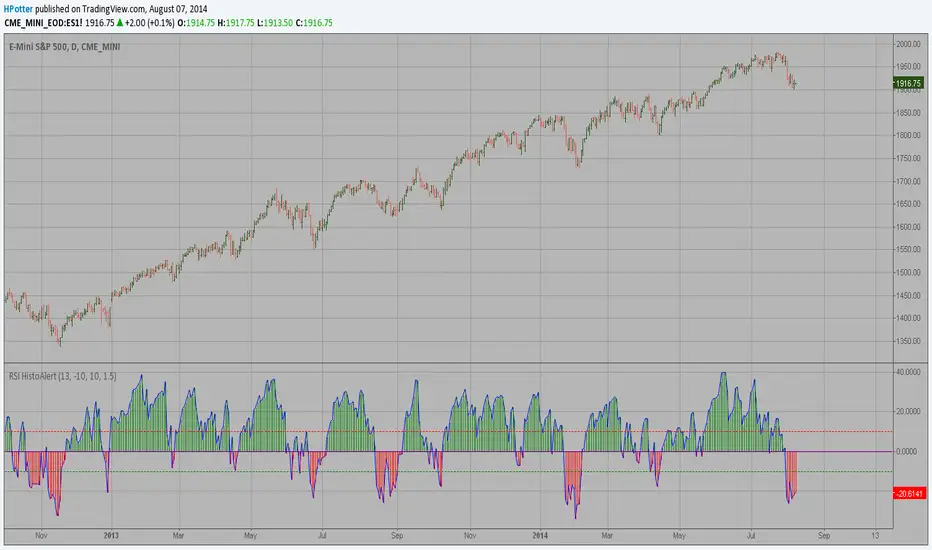
RSI HistoAlertThis is simple indicator modified RSI
You can use in the xPrice any series: Open, High, Low, Close, HL2, HLC3, OHLC4 and ect...
RSI CandlesCan be used as a 50 level cross by rsi or as overbought/oversold by setting the levels accordingly eg 70/30

Triple EMA + RSI + ATRThis comprehensive trading system combines triple EMA alignment, RSI momentum filtering, and dynamic ATR-based risk management. The strategy enters positions only when fast, medium, and slow EMAs align in proper order (bullish or bearish), confirmed by RSI remaining within defined thresholds (not overbought/oversold) and a volume spike above its moving average. Exits are managed intelligently using a multi-tier approach: a fixed stop-loss based on ATR, a first profit target at a predefined risk-reward ratio, and a trailing stop that activates after reaching a second, higher profit tier. Designed for trend-following with built-in momentum and volume confirmation, it features professional order execution with configurable commission and slippage for realistic backtesting. Visual cues including colored backgrounds and signal shapes enhance chart clarity.
