Uptrend Downtrend Loopback Candle Identification LibThis library is for identifying uptrends and downtrends using a loopback candle analysis method. Which contains two functions:
uptrendLoopbackCandleIdentification() and downtrendLoopbackCandleIdentification() . These functions check if the current candle is part of an uptrend or downtrend, respectively, based on the specified lookback period.
The uptrendLoopbackCandleIdentification() takes two arguments: index , which is the index of the current bar, and lookbackPeriod , which is the number of previous candles to check for an uptrend. The function returns false if the index is less than the lookback period. Otherwise, it initializes a boolean variable isHigherHigh as true and loops through the previous candles. If any of the previous candles have a higher high than the current candle, isHigherHigh is set to false , and the loop breaks. Finally, the function returns the value of isHigherHigh .
The downtrendLoopbackCandleIdentification() takes the same arguments and returns false if the index is less than the lookback period. The function initializes a boolean variable isHigherLow as true and loops through the previous candles. If any of the previous candles have a higher low than the current candle, isHigherLow is set to false , and the loop breaks. The function returns the value of isHigherLow .
Search in scripts for "TAKE"

Goertzel Cycle Composite Wave [Loxx]As the financial markets become increasingly complex and data-driven, traders and analysts must leverage powerful tools to gain insights and make informed decisions. One such tool is the Goertzel Cycle Composite Wave indicator, a sophisticated technical analysis indicator that helps identify cyclical patterns in financial data. This powerful tool is capable of detecting cyclical patterns in financial data, helping traders to make better predictions and optimize their trading strategies. With its unique combination of mathematical algorithms and advanced charting capabilities, this indicator has the potential to revolutionize the way we approach financial modeling and trading.
*** To decrease the load time of this indicator, only XX many bars back will render to the chart. You can control this value with the setting "Number of Bars to Render". This doesn't have anything to do with repainting or the indicator being endpointed***
█ Brief Overview of the Goertzel Cycle Composite Wave
The Goertzel Cycle Composite Wave is a sophisticated technical analysis tool that utilizes the Goertzel algorithm to analyze and visualize cyclical components within a financial time series. By identifying these cycles and their characteristics, the indicator aims to provide valuable insights into the market's underlying price movements, which could potentially be used for making informed trading decisions.
The Goertzel Cycle Composite Wave is considered a non-repainting and endpointed indicator. This means that once a value has been calculated for a specific bar, that value will not change in subsequent bars, and the indicator is designed to have a clear start and end point. This is an important characteristic for indicators used in technical analysis, as it allows traders to make informed decisions based on historical data without the risk of hindsight bias or future changes in the indicator's values. This means traders can use this indicator trading purposes.
The repainting version of this indicator with forecasting, cycle selection/elimination options, and data output table can be found here:
Goertzel Browser
The primary purpose of this indicator is to:
1. Detect and analyze the dominant cycles present in the price data.
2. Reconstruct and visualize the composite wave based on the detected cycles.
To achieve this, the indicator performs several tasks:
1. Detrending the price data: The indicator preprocesses the price data using various detrending techniques, such as Hodrick-Prescott filters, zero-lag moving averages, and linear regression, to remove the underlying trend and focus on the cyclical components.
2. Applying the Goertzel algorithm: The indicator applies the Goertzel algorithm to the detrended price data, identifying the dominant cycles and their characteristics, such as amplitude, phase, and cycle strength.
3. Constructing the composite wave: The indicator reconstructs the composite wave by combining the detected cycles, either by using a user-defined list of cycles or by selecting the top N cycles based on their amplitude or cycle strength.
4. Visualizing the composite wave: The indicator plots the composite wave, using solid lines for the cycles. The color of the lines indicates whether the wave is increasing or decreasing.
This indicator is a powerful tool that employs the Goertzel algorithm to analyze and visualize the cyclical components within a financial time series. By providing insights into the underlying price movements, the indicator aims to assist traders in making more informed decisions.
█ What is the Goertzel Algorithm?
The Goertzel algorithm, named after Gerald Goertzel, is a digital signal processing technique that is used to efficiently compute individual terms of the Discrete Fourier Transform (DFT). It was first introduced in 1958, and since then, it has found various applications in the fields of engineering, mathematics, and physics.
The Goertzel algorithm is primarily used to detect specific frequency components within a digital signal, making it particularly useful in applications where only a few frequency components are of interest. The algorithm is computationally efficient, as it requires fewer calculations than the Fast Fourier Transform (FFT) when detecting a small number of frequency components. This efficiency makes the Goertzel algorithm a popular choice in applications such as:
1. Telecommunications: The Goertzel algorithm is used for decoding Dual-Tone Multi-Frequency (DTMF) signals, which are the tones generated when pressing buttons on a telephone keypad. By identifying specific frequency components, the algorithm can accurately determine which button has been pressed.
2. Audio processing: The algorithm can be used to detect specific pitches or harmonics in an audio signal, making it useful in applications like pitch detection and tuning musical instruments.
3. Vibration analysis: In the field of mechanical engineering, the Goertzel algorithm can be applied to analyze vibrations in rotating machinery, helping to identify faulty components or signs of wear.
4. Power system analysis: The algorithm can be used to measure harmonic content in power systems, allowing engineers to assess power quality and detect potential issues.
The Goertzel algorithm is used in these applications because it offers several advantages over other methods, such as the FFT:
1. Computational efficiency: The Goertzel algorithm requires fewer calculations when detecting a small number of frequency components, making it more computationally efficient than the FFT in these cases.
2. Real-time analysis: The algorithm can be implemented in a streaming fashion, allowing for real-time analysis of signals, which is crucial in applications like telecommunications and audio processing.
3. Memory efficiency: The Goertzel algorithm requires less memory than the FFT, as it only computes the frequency components of interest.
4. Precision: The algorithm is less susceptible to numerical errors compared to the FFT, ensuring more accurate results in applications where precision is essential.
The Goertzel algorithm is an efficient digital signal processing technique that is primarily used to detect specific frequency components within a signal. Its computational efficiency, real-time capabilities, and precision make it an attractive choice for various applications, including telecommunications, audio processing, vibration analysis, and power system analysis. The algorithm has been widely adopted since its introduction in 1958 and continues to be an essential tool in the fields of engineering, mathematics, and physics.
█ Goertzel Algorithm in Quantitative Finance: In-Depth Analysis and Applications
The Goertzel algorithm, initially designed for signal processing in telecommunications, has gained significant traction in the financial industry due to its efficient frequency detection capabilities. In quantitative finance, the Goertzel algorithm has been utilized for uncovering hidden market cycles, developing data-driven trading strategies, and optimizing risk management. This section delves deeper into the applications of the Goertzel algorithm in finance, particularly within the context of quantitative trading and analysis.
Unveiling Hidden Market Cycles:
Market cycles are prevalent in financial markets and arise from various factors, such as economic conditions, investor psychology, and market participant behavior. The Goertzel algorithm's ability to detect and isolate specific frequencies in price data helps trader analysts identify hidden market cycles that may otherwise go unnoticed. By examining the amplitude, phase, and periodicity of each cycle, traders can better understand the underlying market structure and dynamics, enabling them to develop more informed and effective trading strategies.
Developing Quantitative Trading Strategies:
The Goertzel algorithm's versatility allows traders to incorporate its insights into a wide range of trading strategies. By identifying the dominant market cycles in a financial instrument's price data, traders can create data-driven strategies that capitalize on the cyclical nature of markets.
For instance, a trader may develop a mean-reversion strategy that takes advantage of the identified cycles. By establishing positions when the price deviates from the predicted cycle, the trader can profit from the subsequent reversion to the cycle's mean. Similarly, a momentum-based strategy could be designed to exploit the persistence of a dominant cycle by entering positions that align with the cycle's direction.
Enhancing Risk Management:
The Goertzel algorithm plays a vital role in risk management for quantitative strategies. By analyzing the cyclical components of a financial instrument's price data, traders can gain insights into the potential risks associated with their trading strategies.
By monitoring the amplitude and phase of dominant cycles, a trader can detect changes in market dynamics that may pose risks to their positions. For example, a sudden increase in amplitude may indicate heightened volatility, prompting the trader to adjust position sizing or employ hedging techniques to protect their portfolio. Additionally, changes in phase alignment could signal a potential shift in market sentiment, necessitating adjustments to the trading strategy.
Expanding Quantitative Toolkits:
Traders can augment the Goertzel algorithm's insights by combining it with other quantitative techniques, creating a more comprehensive and sophisticated analysis framework. For example, machine learning algorithms, such as neural networks or support vector machines, could be trained on features extracted from the Goertzel algorithm to predict future price movements more accurately.
Furthermore, the Goertzel algorithm can be integrated with other technical analysis tools, such as moving averages or oscillators, to enhance their effectiveness. By applying these tools to the identified cycles, traders can generate more robust and reliable trading signals.
The Goertzel algorithm offers invaluable benefits to quantitative finance practitioners by uncovering hidden market cycles, aiding in the development of data-driven trading strategies, and improving risk management. By leveraging the insights provided by the Goertzel algorithm and integrating it with other quantitative techniques, traders can gain a deeper understanding of market dynamics and devise more effective trading strategies.
█ Indicator Inputs
src: This is the source data for the analysis, typically the closing price of the financial instrument.
detrendornot: This input determines the method used for detrending the source data. Detrending is the process of removing the underlying trend from the data to focus on the cyclical components.
The available options are:
hpsmthdt: Detrend using Hodrick-Prescott filter centered moving average.
zlagsmthdt: Detrend using zero-lag moving average centered moving average.
logZlagRegression: Detrend using logarithmic zero-lag linear regression.
hpsmth: Detrend using Hodrick-Prescott filter.
zlagsmth: Detrend using zero-lag moving average.
DT_HPper1 and DT_HPper2: These inputs define the period range for the Hodrick-Prescott filter centered moving average when detrendornot is set to hpsmthdt.
DT_ZLper1 and DT_ZLper2: These inputs define the period range for the zero-lag moving average centered moving average when detrendornot is set to zlagsmthdt.
DT_RegZLsmoothPer: This input defines the period for the zero-lag moving average used in logarithmic zero-lag linear regression when detrendornot is set to logZlagRegression.
HPsmoothPer: This input defines the period for the Hodrick-Prescott filter when detrendornot is set to hpsmth.
ZLMAsmoothPer: This input defines the period for the zero-lag moving average when detrendornot is set to zlagsmth.
MaxPer: This input sets the maximum period for the Goertzel algorithm to search for cycles.
squaredAmp: This boolean input determines whether the amplitude should be squared in the Goertzel algorithm.
useAddition: This boolean input determines whether the Goertzel algorithm should use addition for combining the cycles.
useCosine: This boolean input determines whether the Goertzel algorithm should use cosine waves instead of sine waves.
UseCycleStrength: This boolean input determines whether the Goertzel algorithm should compute the cycle strength, which is a normalized measure of the cycle's amplitude.
WindowSizePast: These inputs define the window size for the composite wave.
FilterBartels: This boolean input determines whether Bartel's test should be applied to filter out non-significant cycles.
BartNoCycles: This input sets the number of cycles to be used in Bartel's test.
BartSmoothPer: This input sets the period for the moving average used in Bartel's test.
BartSigLimit: This input sets the significance limit for Bartel's test, below which cycles are considered insignificant.
SortBartels: This boolean input determines whether the cycles should be sorted by their Bartel's test results.
StartAtCycle: This input determines the starting index for selecting the top N cycles when UseCycleList is set to false. This allows you to skip a certain number of cycles from the top before selecting the desired number of cycles.
UseTopCycles: This input sets the number of top cycles to use for constructing the composite wave when UseCycleList is set to false. The cycles are ranked based on their amplitudes or cycle strengths, depending on the UseCycleStrength input.
SubtractNoise: This boolean input determines whether to subtract the noise (remaining cycles) from the composite wave. If set to true, the composite wave will only include the top N cycles specified by UseTopCycles.
█ Exploring Auxiliary Functions
The following functions demonstrate advanced techniques for analyzing financial markets, including zero-lag moving averages, Bartels probability, detrending, and Hodrick-Prescott filtering. This section examines each function in detail, explaining their purpose, methodology, and applications in finance. We will examine how each function contributes to the overall performance and effectiveness of the indicator and how they work together to create a powerful analytical tool.
Zero-Lag Moving Average:
The zero-lag moving average function is designed to minimize the lag typically associated with moving averages. This is achieved through a two-step weighted linear regression process that emphasizes more recent data points. The function calculates a linearly weighted moving average (LWMA) on the input data and then applies another LWMA on the result. By doing this, the function creates a moving average that closely follows the price action, reducing the lag and improving the responsiveness of the indicator.
The zero-lag moving average function is used in the indicator to provide a responsive, low-lag smoothing of the input data. This function helps reduce the noise and fluctuations in the data, making it easier to identify and analyze underlying trends and patterns. By minimizing the lag associated with traditional moving averages, this function allows the indicator to react more quickly to changes in market conditions, providing timely signals and improving the overall effectiveness of the indicator.
Bartels Probability:
The Bartels probability function calculates the probability of a given cycle being significant in a time series. It uses a mathematical test called the Bartels test to assess the significance of cycles detected in the data. The function calculates coefficients for each detected cycle and computes an average amplitude and an expected amplitude. By comparing these values, the Bartels probability is derived, indicating the likelihood of a cycle's significance. This information can help in identifying and analyzing dominant cycles in financial markets.
The Bartels probability function is incorporated into the indicator to assess the significance of detected cycles in the input data. By calculating the Bartels probability for each cycle, the indicator can prioritize the most significant cycles and focus on the market dynamics that are most relevant to the current trading environment. This function enhances the indicator's ability to identify dominant market cycles, improving its predictive power and aiding in the development of effective trading strategies.
Detrend Logarithmic Zero-Lag Regression:
The detrend logarithmic zero-lag regression function is used for detrending data while minimizing lag. It combines a zero-lag moving average with a linear regression detrending method. The function first calculates the zero-lag moving average of the logarithm of input data and then applies a linear regression to remove the trend. By detrending the data, the function isolates the cyclical components, making it easier to analyze and interpret the underlying market dynamics.
The detrend logarithmic zero-lag regression function is used in the indicator to isolate the cyclical components of the input data. By detrending the data, the function enables the indicator to focus on the cyclical movements in the market, making it easier to analyze and interpret market dynamics. This function is essential for identifying cyclical patterns and understanding the interactions between different market cycles, which can inform trading decisions and enhance overall market understanding.
Bartels Cycle Significance Test:
The Bartels cycle significance test is a function that combines the Bartels probability function and the detrend logarithmic zero-lag regression function to assess the significance of detected cycles. The function calculates the Bartels probability for each cycle and stores the results in an array. By analyzing the probability values, traders and analysts can identify the most significant cycles in the data, which can be used to develop trading strategies and improve market understanding.
The Bartels cycle significance test function is integrated into the indicator to provide a comprehensive analysis of the significance of detected cycles. By combining the Bartels probability function and the detrend logarithmic zero-lag regression function, this test evaluates the significance of each cycle and stores the results in an array. The indicator can then use this information to prioritize the most significant cycles and focus on the most relevant market dynamics. This function enhances the indicator's ability to identify and analyze dominant market cycles, providing valuable insights for trading and market analysis.
Hodrick-Prescott Filter:
The Hodrick-Prescott filter is a popular technique used to separate the trend and cyclical components of a time series. The function applies a smoothing parameter to the input data and calculates a smoothed series using a two-sided filter. This smoothed series represents the trend component, which can be subtracted from the original data to obtain the cyclical component. The Hodrick-Prescott filter is commonly used in economics and finance to analyze economic data and financial market trends.
The Hodrick-Prescott filter is incorporated into the indicator to separate the trend and cyclical components of the input data. By applying the filter to the data, the indicator can isolate the trend component, which can be used to analyze long-term market trends and inform trading decisions. Additionally, the cyclical component can be used to identify shorter-term market dynamics and provide insights into potential trading opportunities. The inclusion of the Hodrick-Prescott filter adds another layer of analysis to the indicator, making it more versatile and comprehensive.
Detrending Options: Detrend Centered Moving Average:
The detrend centered moving average function provides different detrending methods, including the Hodrick-Prescott filter and the zero-lag moving average, based on the selected detrending method. The function calculates two sets of smoothed values using the chosen method and subtracts one set from the other to obtain a detrended series. By offering multiple detrending options, this function allows traders and analysts to select the most appropriate method for their specific needs and preferences.
The detrend centered moving average function is integrated into the indicator to provide users with multiple detrending options, including the Hodrick-Prescott filter and the zero-lag moving average. By offering multiple detrending methods, the indicator allows users to customize the analysis to their specific needs and preferences, enhancing the indicator's overall utility and adaptability. This function ensures that the indicator can cater to a wide range of trading styles and objectives, making it a valuable tool for a diverse group of market participants.
The auxiliary functions functions discussed in this section demonstrate the power and versatility of mathematical techniques in analyzing financial markets. By understanding and implementing these functions, traders and analysts can gain valuable insights into market dynamics, improve their trading strategies, and make more informed decisions. The combination of zero-lag moving averages, Bartels probability, detrending methods, and the Hodrick-Prescott filter provides a comprehensive toolkit for analyzing and interpreting financial data. The integration of advanced functions in a financial indicator creates a powerful and versatile analytical tool that can provide valuable insights into financial markets. By combining the zero-lag moving average,
█ In-Depth Analysis of the Goertzel Cycle Composite Wave Code
The Goertzel Cycle Composite Wave code is an implementation of the Goertzel Algorithm, an efficient technique to perform spectral analysis on a signal. The code is designed to detect and analyze dominant cycles within a given financial market data set. This section will provide an extremely detailed explanation of the code, its structure, functions, and intended purpose.
Function signature and input parameters:
The Goertzel Cycle Composite Wave function accepts numerous input parameters for customization, including source data (src), the current bar (forBar), sample size (samplesize), period (per), squared amplitude flag (squaredAmp), addition flag (useAddition), cosine flag (useCosine), cycle strength flag (UseCycleStrength), past sizes (WindowSizePast), Bartels filter flag (FilterBartels), Bartels-related parameters (BartNoCycles, BartSmoothPer, BartSigLimit), sorting flag (SortBartels), and output buffers (goeWorkPast, cyclebuffer, amplitudebuffer, phasebuffer, cycleBartelsBuffer).
Initializing variables and arrays:
The code initializes several float arrays (goeWork1, goeWork2, goeWork3, goeWork4) with the same length as twice the period (2 * per). These arrays store intermediate results during the execution of the algorithm.
Preprocessing input data:
The input data (src) undergoes preprocessing to remove linear trends. This step enhances the algorithm's ability to focus on cyclical components in the data. The linear trend is calculated by finding the slope between the first and last values of the input data within the sample.
Iterative calculation of Goertzel coefficients:
The core of the Goertzel Cycle Composite Wave algorithm lies in the iterative calculation of Goertzel coefficients for each frequency bin. These coefficients represent the spectral content of the input data at different frequencies. The code iterates through the range of frequencies, calculating the Goertzel coefficients using a nested loop structure.
Cycle strength computation:
The code calculates the cycle strength based on the Goertzel coefficients. This is an optional step, controlled by the UseCycleStrength flag. The cycle strength provides information on the relative influence of each cycle on the data per bar, considering both amplitude and cycle length. The algorithm computes the cycle strength either by squaring the amplitude (controlled by squaredAmp flag) or using the actual amplitude values.
Phase calculation:
The Goertzel Cycle Composite Wave code computes the phase of each cycle, which represents the position of the cycle within the input data. The phase is calculated using the arctangent function (math.atan) based on the ratio of the imaginary and real components of the Goertzel coefficients.
Peak detection and cycle extraction:
The algorithm performs peak detection on the computed amplitudes or cycle strengths to identify dominant cycles. It stores the detected cycles in the cyclebuffer array, along with their corresponding amplitudes and phases in the amplitudebuffer and phasebuffer arrays, respectively.
Sorting cycles by amplitude or cycle strength:
The code sorts the detected cycles based on their amplitude or cycle strength in descending order. This allows the algorithm to prioritize cycles with the most significant impact on the input data.
Bartels cycle significance test:
If the FilterBartels flag is set, the code performs a Bartels cycle significance test on the detected cycles. This test determines the statistical significance of each cycle and filters out the insignificant cycles. The significant cycles are stored in the cycleBartelsBuffer array. If the SortBartels flag is set, the code sorts the significant cycles based on their Bartels significance values.
Waveform calculation:
The Goertzel Cycle Composite Wave code calculates the waveform of the significant cycles for specified time windows. The windows are defined by the WindowSizePast parameters, respectively. The algorithm uses either cosine or sine functions (controlled by the useCosine flag) to calculate the waveforms for each cycle. The useAddition flag determines whether the waveforms should be added or subtracted.
Storing waveforms in a matrix:
The calculated waveforms for the cycle is stored in the matrix - goeWorkPast. This matrix holds the waveforms for the specified time windows. Each row in the matrix represents a time window position, and each column corresponds to a cycle.
Returning the number of cycles:
The Goertzel Cycle Composite Wave function returns the total number of detected cycles (number_of_cycles) after processing the input data. This information can be used to further analyze the results or to visualize the detected cycles.
The Goertzel Cycle Composite Wave code is a comprehensive implementation of the Goertzel Algorithm, specifically designed for detecting and analyzing dominant cycles within financial market data. The code offers a high level of customization, allowing users to fine-tune the algorithm based on their specific needs. The Goertzel Cycle Composite Wave's combination of preprocessing, iterative calculations, cycle extraction, sorting, significance testing, and waveform calculation makes it a powerful tool for understanding cyclical components in financial data.
█ Generating and Visualizing Composite Waveform
The indicator calculates and visualizes the composite waveform for specified time windows based on the detected cycles. Here's a detailed explanation of this process:
Updating WindowSizePast:
The WindowSizePast is updated to ensure they are at least twice the MaxPer (maximum period).
Initializing matrices and arrays:
The matrix goeWorkPast is initialized to store the Goertzel results for specified time windows. Multiple arrays are also initialized to store cycle, amplitude, phase, and Bartels information.
Preparing the source data (srcVal) array:
The source data is copied into an array, srcVal, and detrended using one of the selected methods (hpsmthdt, zlagsmthdt, logZlagRegression, hpsmth, or zlagsmth).
Goertzel function call:
The Goertzel function is called to analyze the detrended source data and extract cycle information. The output, number_of_cycles, contains the number of detected cycles.
Initializing arrays for waveforms:
The goertzel array is initialized to store the endpoint Goertzel.
Calculating composite waveform (goertzel array):
The composite waveform is calculated by summing the selected cycles (either from the user-defined cycle list or the top cycles) and optionally subtracting the noise component.
Drawing composite waveform (pvlines):
The composite waveform is drawn on the chart using solid lines. The color of the lines is determined by the direction of the waveform (green for upward, red for downward).
To summarize, this indicator generates a composite waveform based on the detected cycles in the financial data. It calculates the composite waveforms and visualizes them on the chart using colored lines.
█ Enhancing the Goertzel Algorithm-Based Script for Financial Modeling and Trading
The Goertzel algorithm-based script for detecting dominant cycles in financial data is a powerful tool for financial modeling and trading. It provides valuable insights into the past behavior of these cycles. However, as with any algorithm, there is always room for improvement. This section discusses potential enhancements to the existing script to make it even more robust and versatile for financial modeling, general trading, advanced trading, and high-frequency finance trading.
Enhancements for Financial Modeling
Data preprocessing: One way to improve the script's performance for financial modeling is to introduce more advanced data preprocessing techniques. This could include removing outliers, handling missing data, and normalizing the data to ensure consistent and accurate results.
Additional detrending and smoothing methods: Incorporating more sophisticated detrending and smoothing techniques, such as wavelet transform or empirical mode decomposition, can help improve the script's ability to accurately identify cycles and trends in the data.
Machine learning integration: Integrating machine learning techniques, such as artificial neural networks or support vector machines, can help enhance the script's predictive capabilities, leading to more accurate financial models.
Enhancements for General and Advanced Trading
Customizable indicator integration: Allowing users to integrate their own technical indicators can help improve the script's effectiveness for both general and advanced trading. By enabling the combination of the dominant cycle information with other technical analysis tools, traders can develop more comprehensive trading strategies.
Risk management and position sizing: Incorporating risk management and position sizing functionality into the script can help traders better manage their trades and control potential losses. This can be achieved by calculating the optimal position size based on the user's risk tolerance and account size.
Multi-timeframe analysis: Enhancing the script to perform multi-timeframe analysis can provide traders with a more holistic view of market trends and cycles. By identifying dominant cycles on different timeframes, traders can gain insights into the potential confluence of cycles and make better-informed trading decisions.
Enhancements for High-Frequency Finance Trading
Algorithm optimization: To ensure the script's suitability for high-frequency finance trading, optimizing the algorithm for faster execution is crucial. This can be achieved by employing efficient data structures and refining the calculation methods to minimize computational complexity.
Real-time data streaming: Integrating real-time data streaming capabilities into the script can help high-frequency traders react to market changes more quickly. By continuously updating the cycle information based on real-time market data, traders can adapt their strategies accordingly and capitalize on short-term market fluctuations.
Order execution and trade management: To fully leverage the script's capabilities for high-frequency trading, implementing functionality for automated order execution and trade management is essential. This can include features such as stop-loss and take-profit orders, trailing stops, and automated trade exit strategies.
While the existing Goertzel algorithm-based script is a valuable tool for detecting dominant cycles in financial data, there are several potential enhancements that can make it even more powerful for financial modeling, general trading, advanced trading, and high-frequency finance trading. By incorporating these improvements, the script can become a more versatile and effective tool for traders and financial analysts alike.
█ Understanding the Limitations of the Goertzel Algorithm
While the Goertzel algorithm-based script for detecting dominant cycles in financial data provides valuable insights, it is important to be aware of its limitations and drawbacks. Some of the key drawbacks of this indicator are:
Lagging nature:
As with many other technical indicators, the Goertzel algorithm-based script can suffer from lagging effects, meaning that it may not immediately react to real-time market changes. This lag can lead to late entries and exits, potentially resulting in reduced profitability or increased losses.
Parameter sensitivity:
The performance of the script can be sensitive to the chosen parameters, such as the detrending methods, smoothing techniques, and cycle detection settings. Improper parameter selection may lead to inaccurate cycle detection or increased false signals, which can negatively impact trading performance.
Complexity:
The Goertzel algorithm itself is relatively complex, making it difficult for novice traders or those unfamiliar with the concept of cycle analysis to fully understand and effectively utilize the script. This complexity can also make it challenging to optimize the script for specific trading styles or market conditions.
Overfitting risk:
As with any data-driven approach, there is a risk of overfitting when using the Goertzel algorithm-based script. Overfitting occurs when a model becomes too specific to the historical data it was trained on, leading to poor performance on new, unseen data. This can result in misleading signals and reduced trading performance.
Limited applicability:
The Goertzel algorithm-based script may not be suitable for all markets, trading styles, or timeframes. Its effectiveness in detecting cycles may be limited in certain market conditions, such as during periods of extreme volatility or low liquidity.
While the Goertzel algorithm-based script offers valuable insights into dominant cycles in financial data, it is essential to consider its drawbacks and limitations when incorporating it into a trading strategy. Traders should always use the script in conjunction with other technical and fundamental analysis tools, as well as proper risk management, to make well-informed trading decisions.
█ Interpreting Results
The Goertzel Cycle Composite Wave indicator can be interpreted by analyzing the plotted lines. The indicator plots two lines: composite waves. The composite wave represents the composite wave of the price data.
The composite wave line displays a solid line, with green indicating a bullish trend and red indicating a bearish trend.
Interpreting the Goertzel Cycle Composite Wave indicator involves identifying the trend of the composite wave lines and matching them with the corresponding bullish or bearish color.
█ Conclusion
The Goertzel Cycle Composite Wave indicator is a powerful tool for identifying and analyzing cyclical patterns in financial markets. Its ability to detect multiple cycles of varying frequencies and strengths make it a valuable addition to any trader's technical analysis toolkit. However, it is important to keep in mind that the Goertzel Cycle Composite Wave indicator should be used in conjunction with other technical analysis tools and fundamental analysis to achieve the best results. With continued refinement and development, the Goertzel Cycle Composite Wave indicator has the potential to become a highly effective tool for financial modeling, general trading, advanced trading, and high-frequency finance trading. Its accuracy and versatility make it a promising candidate for further research and development.
█ Footnotes
What is the Bartels Test for Cycle Significance?
The Bartels Cycle Significance Test is a statistical method that determines whether the peaks and troughs of a time series are statistically significant. The test is named after its inventor, George Bartels, who developed it in the mid-20th century.
The Bartels test is designed to analyze the cyclical components of a time series, which can help traders and analysts identify trends and cycles in financial markets. The test calculates a Bartels statistic, which measures the degree of non-randomness or autocorrelation in the time series.
The Bartels statistic is calculated by first splitting the time series into two halves and calculating the range of the peaks and troughs in each half. The test then compares these ranges using a t-test, which measures the significance of the difference between the two ranges.
If the Bartels statistic is greater than a critical value, it indicates that the peaks and troughs in the time series are non-random and that there is a significant cyclical component to the data. Conversely, if the Bartels statistic is less than the critical value, it suggests that the peaks and troughs are random and that there is no significant cyclical component.
The Bartels Cycle Significance Test is particularly useful in financial analysis because it can help traders and analysts identify significant cycles in asset prices, which can in turn inform investment decisions. However, it is important to note that the test is not perfect and can produce false signals in certain situations, particularly in noisy or volatile markets. Therefore, it is always recommended to use the test in conjunction with other technical and fundamental indicators to confirm trends and cycles.
Deep-dive into the Hodrick-Prescott Fitler
The Hodrick-Prescott (HP) filter is a statistical tool used in economics and finance to separate a time series into two components: a trend component and a cyclical component. It is a powerful tool for identifying long-term trends in economic and financial data and is widely used by economists, central banks, and financial institutions around the world.
The HP filter was first introduced in the 1990s by economists Robert Hodrick and Edward Prescott. It is a simple, two-parameter filter that separates a time series into a trend component and a cyclical component. The trend component represents the long-term behavior of the data, while the cyclical component captures the shorter-term fluctuations around the trend.
The HP filter works by minimizing the following objective function:
Minimize: (Sum of Squared Deviations) + λ (Sum of Squared Second Differences)
Where:
1. The first term represents the deviation of the data from the trend.
2. The second term represents the smoothness of the trend.
3. λ is a smoothing parameter that determines the degree of smoothness of the trend.
The smoothing parameter λ is typically set to a value between 100 and 1600, depending on the frequency of the data. Higher values of λ lead to a smoother trend, while lower values lead to a more volatile trend.
The HP filter has several advantages over other smoothing techniques. It is a non-parametric method, meaning that it does not make any assumptions about the underlying distribution of the data. It also allows for easy comparison of trends across different time series and can be used with data of any frequency.
However, the HP filter also has some limitations. It assumes that the trend is a smooth function, which may not be the case in some situations. It can also be sensitive to changes in the smoothing parameter λ, which may result in different trends for the same data. Additionally, the filter may produce unrealistic trends for very short time series.
Despite these limitations, the HP filter remains a valuable tool for analyzing economic and financial data. It is widely used by central banks and financial institutions to monitor long-term trends in the economy, and it can be used to identify turning points in the business cycle. The filter can also be used to analyze asset prices, exchange rates, and other financial variables.
The Hodrick-Prescott filter is a powerful tool for analyzing economic and financial data. It separates a time series into a trend component and a cyclical component, allowing for easy identification of long-term trends and turning points in the business cycle. While it has some limitations, it remains a valuable tool for economists, central banks, and financial institutions around the world.

Adaptive Price Channel StrategyThis strategy is an adaptive price channel strategy based on the Average True Range (ATR) indicator and the Average Directional Index (ADX). It aims to identify sideways markets and trends in the price movements and make trades accordingly.
The strategy uses a length parameter for the ATR and ADX indicators, which determines the length of the calculation for these indicators. The strategy also uses an ATR multiplier, which is multiplied by the ATR to determine the upper and lower bounds of the price channel.
The first step of the strategy is to calculate the highest high (HH) and lowest low (LL) over the specified length. The ATR is also calculated over the same length. Then the strategy calculates the positive directional indicator (+DI) and negative directional indicator (-DI) based on the up and down moves in the price, and uses these to calculate the ADX.
If the ADX is less than 25, the market is considered to be in a sideways phase. In this case, if the price closes above the upper bound of the price channel (HH - ATR multiplier * ATR), the strategy enters a long position, and if the price closes below the lower bound of the price channel (LL + ATR multiplier * ATR), the strategy enters a short position.
If the ADX is greater than or equal to 25 and the +DI is greater than the -DI, the market is considered to be in a bullish phase. In this case, if the price closes above the upper bound of the price channel, the strategy enters a long position. If the ADX is greater than or equal to 25 and the +DI is less than the -DI, the market is considered to be in a bearish phase. In this case, if the price closes below the lower bound of the price channel, the strategy enters a short position.
The strategy exits a position after a certain number of bars have passed since the entry, as specified by the exit_length input.
In summary, this strategy attempts to trade in accordance with the prevailing market conditions by identifying sideways markets and trends and making trades based on price movements within a dynamically-adjusted price channel.
This strategy takes a read on the market and either takes a channel strategy or trades volatility based on current trend. Works well on 2, 3 ,4, 12 hour for BTC. It’s my first attempt and creating a strategy. I am very interested in constructive criticism. I will look into better risk management, maybe a trailing stop loss. Other suggestions welcome. This is my first attempt at a strategy.
Here are the settings I used.
Inputs
Length 20
Exit 10
ATR 3.2
Dates I picked when I got into Crypto
Properties
Capital 1000
Order size 2 Contracts
Pyramiding 1
Commission .05

Goertzel Browser [Loxx]As the financial markets become increasingly complex and data-driven, traders and analysts must leverage powerful tools to gain insights and make informed decisions. One such tool is the Goertzel Browser indicator, a sophisticated technical analysis indicator that helps identify cyclical patterns in financial data. This powerful tool is capable of detecting cyclical patterns in financial data, helping traders to make better predictions and optimize their trading strategies. With its unique combination of mathematical algorithms and advanced charting capabilities, this indicator has the potential to revolutionize the way we approach financial modeling and trading.
█ Brief Overview of the Goertzel Browser
The Goertzel Browser is a sophisticated technical analysis tool that utilizes the Goertzel algorithm to analyze and visualize cyclical components within a financial time series. By identifying these cycles and their characteristics, the indicator aims to provide valuable insights into the market's underlying price movements, which could potentially be used for making informed trading decisions.
The primary purpose of this indicator is to:
1. Detect and analyze the dominant cycles present in the price data.
2. Reconstruct and visualize the composite wave based on the detected cycles.
3. Project the composite wave into the future, providing a potential roadmap for upcoming price movements.
To achieve this, the indicator performs several tasks:
1. Detrending the price data: The indicator preprocesses the price data using various detrending techniques, such as Hodrick-Prescott filters, zero-lag moving averages, and linear regression, to remove the underlying trend and focus on the cyclical components.
2. Applying the Goertzel algorithm: The indicator applies the Goertzel algorithm to the detrended price data, identifying the dominant cycles and their characteristics, such as amplitude, phase, and cycle strength.
3. Constructing the composite wave: The indicator reconstructs the composite wave by combining the detected cycles, either by using a user-defined list of cycles or by selecting the top N cycles based on their amplitude or cycle strength.
4. Visualizing the composite wave: The indicator plots the composite wave, using solid lines for the past and dotted lines for the future projections. The color of the lines indicates whether the wave is increasing or decreasing.
5. Displaying cycle information: The indicator provides a table that displays detailed information about the detected cycles, including their rank, period, Bartel's test results, amplitude, and phase.
This indicator is a powerful tool that employs the Goertzel algorithm to analyze and visualize the cyclical components within a financial time series. By providing insights into the underlying price movements and their potential future trajectory, the indicator aims to assist traders in making more informed decisions.
█ What is the Goertzel Algorithm?
The Goertzel algorithm, named after Gerald Goertzel, is a digital signal processing technique that is used to efficiently compute individual terms of the Discrete Fourier Transform (DFT). It was first introduced in 1958, and since then, it has found various applications in the fields of engineering, mathematics, and physics.
The Goertzel algorithm is primarily used to detect specific frequency components within a digital signal, making it particularly useful in applications where only a few frequency components are of interest. The algorithm is computationally efficient, as it requires fewer calculations than the Fast Fourier Transform (FFT) when detecting a small number of frequency components. This efficiency makes the Goertzel algorithm a popular choice in applications such as:
1. Telecommunications: The Goertzel algorithm is used for decoding Dual-Tone Multi-Frequency (DTMF) signals, which are the tones generated when pressing buttons on a telephone keypad. By identifying specific frequency components, the algorithm can accurately determine which button has been pressed.
2. Audio processing: The algorithm can be used to detect specific pitches or harmonics in an audio signal, making it useful in applications like pitch detection and tuning musical instruments.
3. Vibration analysis: In the field of mechanical engineering, the Goertzel algorithm can be applied to analyze vibrations in rotating machinery, helping to identify faulty components or signs of wear.
4. Power system analysis: The algorithm can be used to measure harmonic content in power systems, allowing engineers to assess power quality and detect potential issues.
The Goertzel algorithm is used in these applications because it offers several advantages over other methods, such as the FFT:
1. Computational efficiency: The Goertzel algorithm requires fewer calculations when detecting a small number of frequency components, making it more computationally efficient than the FFT in these cases.
2. Real-time analysis: The algorithm can be implemented in a streaming fashion, allowing for real-time analysis of signals, which is crucial in applications like telecommunications and audio processing.
3. Memory efficiency: The Goertzel algorithm requires less memory than the FFT, as it only computes the frequency components of interest.
4. Precision: The algorithm is less susceptible to numerical errors compared to the FFT, ensuring more accurate results in applications where precision is essential.
The Goertzel algorithm is an efficient digital signal processing technique that is primarily used to detect specific frequency components within a signal. Its computational efficiency, real-time capabilities, and precision make it an attractive choice for various applications, including telecommunications, audio processing, vibration analysis, and power system analysis. The algorithm has been widely adopted since its introduction in 1958 and continues to be an essential tool in the fields of engineering, mathematics, and physics.
█ Goertzel Algorithm in Quantitative Finance: In-Depth Analysis and Applications
The Goertzel algorithm, initially designed for signal processing in telecommunications, has gained significant traction in the financial industry due to its efficient frequency detection capabilities. In quantitative finance, the Goertzel algorithm has been utilized for uncovering hidden market cycles, developing data-driven trading strategies, and optimizing risk management. This section delves deeper into the applications of the Goertzel algorithm in finance, particularly within the context of quantitative trading and analysis.
Unveiling Hidden Market Cycles:
Market cycles are prevalent in financial markets and arise from various factors, such as economic conditions, investor psychology, and market participant behavior. The Goertzel algorithm's ability to detect and isolate specific frequencies in price data helps trader analysts identify hidden market cycles that may otherwise go unnoticed. By examining the amplitude, phase, and periodicity of each cycle, traders can better understand the underlying market structure and dynamics, enabling them to develop more informed and effective trading strategies.
Developing Quantitative Trading Strategies:
The Goertzel algorithm's versatility allows traders to incorporate its insights into a wide range of trading strategies. By identifying the dominant market cycles in a financial instrument's price data, traders can create data-driven strategies that capitalize on the cyclical nature of markets.
For instance, a trader may develop a mean-reversion strategy that takes advantage of the identified cycles. By establishing positions when the price deviates from the predicted cycle, the trader can profit from the subsequent reversion to the cycle's mean. Similarly, a momentum-based strategy could be designed to exploit the persistence of a dominant cycle by entering positions that align with the cycle's direction.
Enhancing Risk Management:
The Goertzel algorithm plays a vital role in risk management for quantitative strategies. By analyzing the cyclical components of a financial instrument's price data, traders can gain insights into the potential risks associated with their trading strategies.
By monitoring the amplitude and phase of dominant cycles, a trader can detect changes in market dynamics that may pose risks to their positions. For example, a sudden increase in amplitude may indicate heightened volatility, prompting the trader to adjust position sizing or employ hedging techniques to protect their portfolio. Additionally, changes in phase alignment could signal a potential shift in market sentiment, necessitating adjustments to the trading strategy.
Expanding Quantitative Toolkits:
Traders can augment the Goertzel algorithm's insights by combining it with other quantitative techniques, creating a more comprehensive and sophisticated analysis framework. For example, machine learning algorithms, such as neural networks or support vector machines, could be trained on features extracted from the Goertzel algorithm to predict future price movements more accurately.
Furthermore, the Goertzel algorithm can be integrated with other technical analysis tools, such as moving averages or oscillators, to enhance their effectiveness. By applying these tools to the identified cycles, traders can generate more robust and reliable trading signals.
The Goertzel algorithm offers invaluable benefits to quantitative finance practitioners by uncovering hidden market cycles, aiding in the development of data-driven trading strategies, and improving risk management. By leveraging the insights provided by the Goertzel algorithm and integrating it with other quantitative techniques, traders can gain a deeper understanding of market dynamics and devise more effective trading strategies.
█ Indicator Inputs
src: This is the source data for the analysis, typically the closing price of the financial instrument.
detrendornot: This input determines the method used for detrending the source data. Detrending is the process of removing the underlying trend from the data to focus on the cyclical components.
The available options are:
hpsmthdt: Detrend using Hodrick-Prescott filter centered moving average.
zlagsmthdt: Detrend using zero-lag moving average centered moving average.
logZlagRegression: Detrend using logarithmic zero-lag linear regression.
hpsmth: Detrend using Hodrick-Prescott filter.
zlagsmth: Detrend using zero-lag moving average.
DT_HPper1 and DT_HPper2: These inputs define the period range for the Hodrick-Prescott filter centered moving average when detrendornot is set to hpsmthdt.
DT_ZLper1 and DT_ZLper2: These inputs define the period range for the zero-lag moving average centered moving average when detrendornot is set to zlagsmthdt.
DT_RegZLsmoothPer: This input defines the period for the zero-lag moving average used in logarithmic zero-lag linear regression when detrendornot is set to logZlagRegression.
HPsmoothPer: This input defines the period for the Hodrick-Prescott filter when detrendornot is set to hpsmth.
ZLMAsmoothPer: This input defines the period for the zero-lag moving average when detrendornot is set to zlagsmth.
MaxPer: This input sets the maximum period for the Goertzel algorithm to search for cycles.
squaredAmp: This boolean input determines whether the amplitude should be squared in the Goertzel algorithm.
useAddition: This boolean input determines whether the Goertzel algorithm should use addition for combining the cycles.
useCosine: This boolean input determines whether the Goertzel algorithm should use cosine waves instead of sine waves.
UseCycleStrength: This boolean input determines whether the Goertzel algorithm should compute the cycle strength, which is a normalized measure of the cycle's amplitude.
WindowSizePast and WindowSizeFuture: These inputs define the window size for past and future projections of the composite wave.
FilterBartels: This boolean input determines whether Bartel's test should be applied to filter out non-significant cycles.
BartNoCycles: This input sets the number of cycles to be used in Bartel's test.
BartSmoothPer: This input sets the period for the moving average used in Bartel's test.
BartSigLimit: This input sets the significance limit for Bartel's test, below which cycles are considered insignificant.
SortBartels: This boolean input determines whether the cycles should be sorted by their Bartel's test results.
UseCycleList: This boolean input determines whether a user-defined list of cycles should be used for constructing the composite wave. If set to false, the top N cycles will be used.
Cycle1, Cycle2, Cycle3, Cycle4, and Cycle5: These inputs define the user-defined list of cycles when 'UseCycleList' is set to true. If using a user-defined list, each of these inputs represents the period of a specific cycle to include in the composite wave.
StartAtCycle: This input determines the starting index for selecting the top N cycles when UseCycleList is set to false. This allows you to skip a certain number of cycles from the top before selecting the desired number of cycles.
UseTopCycles: This input sets the number of top cycles to use for constructing the composite wave when UseCycleList is set to false. The cycles are ranked based on their amplitudes or cycle strengths, depending on the UseCycleStrength input.
SubtractNoise: This boolean input determines whether to subtract the noise (remaining cycles) from the composite wave. If set to true, the composite wave will only include the top N cycles specified by UseTopCycles.
█ Exploring Auxiliary Functions
The following functions demonstrate advanced techniques for analyzing financial markets, including zero-lag moving averages, Bartels probability, detrending, and Hodrick-Prescott filtering. This section examines each function in detail, explaining their purpose, methodology, and applications in finance. We will examine how each function contributes to the overall performance and effectiveness of the indicator and how they work together to create a powerful analytical tool.
Zero-Lag Moving Average:
The zero-lag moving average function is designed to minimize the lag typically associated with moving averages. This is achieved through a two-step weighted linear regression process that emphasizes more recent data points. The function calculates a linearly weighted moving average (LWMA) on the input data and then applies another LWMA on the result. By doing this, the function creates a moving average that closely follows the price action, reducing the lag and improving the responsiveness of the indicator.
The zero-lag moving average function is used in the indicator to provide a responsive, low-lag smoothing of the input data. This function helps reduce the noise and fluctuations in the data, making it easier to identify and analyze underlying trends and patterns. By minimizing the lag associated with traditional moving averages, this function allows the indicator to react more quickly to changes in market conditions, providing timely signals and improving the overall effectiveness of the indicator.
Bartels Probability:
The Bartels probability function calculates the probability of a given cycle being significant in a time series. It uses a mathematical test called the Bartels test to assess the significance of cycles detected in the data. The function calculates coefficients for each detected cycle and computes an average amplitude and an expected amplitude. By comparing these values, the Bartels probability is derived, indicating the likelihood of a cycle's significance. This information can help in identifying and analyzing dominant cycles in financial markets.
The Bartels probability function is incorporated into the indicator to assess the significance of detected cycles in the input data. By calculating the Bartels probability for each cycle, the indicator can prioritize the most significant cycles and focus on the market dynamics that are most relevant to the current trading environment. This function enhances the indicator's ability to identify dominant market cycles, improving its predictive power and aiding in the development of effective trading strategies.
Detrend Logarithmic Zero-Lag Regression:
The detrend logarithmic zero-lag regression function is used for detrending data while minimizing lag. It combines a zero-lag moving average with a linear regression detrending method. The function first calculates the zero-lag moving average of the logarithm of input data and then applies a linear regression to remove the trend. By detrending the data, the function isolates the cyclical components, making it easier to analyze and interpret the underlying market dynamics.
The detrend logarithmic zero-lag regression function is used in the indicator to isolate the cyclical components of the input data. By detrending the data, the function enables the indicator to focus on the cyclical movements in the market, making it easier to analyze and interpret market dynamics. This function is essential for identifying cyclical patterns and understanding the interactions between different market cycles, which can inform trading decisions and enhance overall market understanding.
Bartels Cycle Significance Test:
The Bartels cycle significance test is a function that combines the Bartels probability function and the detrend logarithmic zero-lag regression function to assess the significance of detected cycles. The function calculates the Bartels probability for each cycle and stores the results in an array. By analyzing the probability values, traders and analysts can identify the most significant cycles in the data, which can be used to develop trading strategies and improve market understanding.
The Bartels cycle significance test function is integrated into the indicator to provide a comprehensive analysis of the significance of detected cycles. By combining the Bartels probability function and the detrend logarithmic zero-lag regression function, this test evaluates the significance of each cycle and stores the results in an array. The indicator can then use this information to prioritize the most significant cycles and focus on the most relevant market dynamics. This function enhances the indicator's ability to identify and analyze dominant market cycles, providing valuable insights for trading and market analysis.
Hodrick-Prescott Filter:
The Hodrick-Prescott filter is a popular technique used to separate the trend and cyclical components of a time series. The function applies a smoothing parameter to the input data and calculates a smoothed series using a two-sided filter. This smoothed series represents the trend component, which can be subtracted from the original data to obtain the cyclical component. The Hodrick-Prescott filter is commonly used in economics and finance to analyze economic data and financial market trends.
The Hodrick-Prescott filter is incorporated into the indicator to separate the trend and cyclical components of the input data. By applying the filter to the data, the indicator can isolate the trend component, which can be used to analyze long-term market trends and inform trading decisions. Additionally, the cyclical component can be used to identify shorter-term market dynamics and provide insights into potential trading opportunities. The inclusion of the Hodrick-Prescott filter adds another layer of analysis to the indicator, making it more versatile and comprehensive.
Detrending Options: Detrend Centered Moving Average:
The detrend centered moving average function provides different detrending methods, including the Hodrick-Prescott filter and the zero-lag moving average, based on the selected detrending method. The function calculates two sets of smoothed values using the chosen method and subtracts one set from the other to obtain a detrended series. By offering multiple detrending options, this function allows traders and analysts to select the most appropriate method for their specific needs and preferences.
The detrend centered moving average function is integrated into the indicator to provide users with multiple detrending options, including the Hodrick-Prescott filter and the zero-lag moving average. By offering multiple detrending methods, the indicator allows users to customize the analysis to their specific needs and preferences, enhancing the indicator's overall utility and adaptability. This function ensures that the indicator can cater to a wide range of trading styles and objectives, making it a valuable tool for a diverse group of market participants.
The auxiliary functions functions discussed in this section demonstrate the power and versatility of mathematical techniques in analyzing financial markets. By understanding and implementing these functions, traders and analysts can gain valuable insights into market dynamics, improve their trading strategies, and make more informed decisions. The combination of zero-lag moving averages, Bartels probability, detrending methods, and the Hodrick-Prescott filter provides a comprehensive toolkit for analyzing and interpreting financial data. The integration of advanced functions in a financial indicator creates a powerful and versatile analytical tool that can provide valuable insights into financial markets. By combining the zero-lag moving average,
█ In-Depth Analysis of the Goertzel Browser Code
The Goertzel Browser code is an implementation of the Goertzel Algorithm, an efficient technique to perform spectral analysis on a signal. The code is designed to detect and analyze dominant cycles within a given financial market data set. This section will provide an extremely detailed explanation of the code, its structure, functions, and intended purpose.
Function signature and input parameters:
The Goertzel Browser function accepts numerous input parameters for customization, including source data (src), the current bar (forBar), sample size (samplesize), period (per), squared amplitude flag (squaredAmp), addition flag (useAddition), cosine flag (useCosine), cycle strength flag (UseCycleStrength), past and future window sizes (WindowSizePast, WindowSizeFuture), Bartels filter flag (FilterBartels), Bartels-related parameters (BartNoCycles, BartSmoothPer, BartSigLimit), sorting flag (SortBartels), and output buffers (goeWorkPast, goeWorkFuture, cyclebuffer, amplitudebuffer, phasebuffer, cycleBartelsBuffer).
Initializing variables and arrays:
The code initializes several float arrays (goeWork1, goeWork2, goeWork3, goeWork4) with the same length as twice the period (2 * per). These arrays store intermediate results during the execution of the algorithm.
Preprocessing input data:
The input data (src) undergoes preprocessing to remove linear trends. This step enhances the algorithm's ability to focus on cyclical components in the data. The linear trend is calculated by finding the slope between the first and last values of the input data within the sample.
Iterative calculation of Goertzel coefficients:
The core of the Goertzel Browser algorithm lies in the iterative calculation of Goertzel coefficients for each frequency bin. These coefficients represent the spectral content of the input data at different frequencies. The code iterates through the range of frequencies, calculating the Goertzel coefficients using a nested loop structure.
Cycle strength computation:
The code calculates the cycle strength based on the Goertzel coefficients. This is an optional step, controlled by the UseCycleStrength flag. The cycle strength provides information on the relative influence of each cycle on the data per bar, considering both amplitude and cycle length. The algorithm computes the cycle strength either by squaring the amplitude (controlled by squaredAmp flag) or using the actual amplitude values.
Phase calculation:
The Goertzel Browser code computes the phase of each cycle, which represents the position of the cycle within the input data. The phase is calculated using the arctangent function (math.atan) based on the ratio of the imaginary and real components of the Goertzel coefficients.
Peak detection and cycle extraction:
The algorithm performs peak detection on the computed amplitudes or cycle strengths to identify dominant cycles. It stores the detected cycles in the cyclebuffer array, along with their corresponding amplitudes and phases in the amplitudebuffer and phasebuffer arrays, respectively.
Sorting cycles by amplitude or cycle strength:
The code sorts the detected cycles based on their amplitude or cycle strength in descending order. This allows the algorithm to prioritize cycles with the most significant impact on the input data.
Bartels cycle significance test:
If the FilterBartels flag is set, the code performs a Bartels cycle significance test on the detected cycles. This test determines the statistical significance of each cycle and filters out the insignificant cycles. The significant cycles are stored in the cycleBartelsBuffer array. If the SortBartels flag is set, the code sorts the significant cycles based on their Bartels significance values.
Waveform calculation:
The Goertzel Browser code calculates the waveform of the significant cycles for both past and future time windows. The past and future windows are defined by the WindowSizePast and WindowSizeFuture parameters, respectively. The algorithm uses either cosine or sine functions (controlled by the useCosine flag) to calculate the waveforms for each cycle. The useAddition flag determines whether the waveforms should be added or subtracted.
Storing waveforms in matrices:
The calculated waveforms for each cycle are stored in two matrices - goeWorkPast and goeWorkFuture. These matrices hold the waveforms for the past and future time windows, respectively. Each row in the matrices represents a time window position, and each column corresponds to a cycle.
Returning the number of cycles:
The Goertzel Browser function returns the total number of detected cycles (number_of_cycles) after processing the input data. This information can be used to further analyze the results or to visualize the detected cycles.
The Goertzel Browser code is a comprehensive implementation of the Goertzel Algorithm, specifically designed for detecting and analyzing dominant cycles within financial market data. The code offers a high level of customization, allowing users to fine-tune the algorithm based on their specific needs. The Goertzel Browser's combination of preprocessing, iterative calculations, cycle extraction, sorting, significance testing, and waveform calculation makes it a powerful tool for understanding cyclical components in financial data.
█ Generating and Visualizing Composite Waveform
The indicator calculates and visualizes the composite waveform for both past and future time windows based on the detected cycles. Here's a detailed explanation of this process:
Updating WindowSizePast and WindowSizeFuture:
The WindowSizePast and WindowSizeFuture are updated to ensure they are at least twice the MaxPer (maximum period).
Initializing matrices and arrays:
Two matrices, goeWorkPast and goeWorkFuture, are initialized to store the Goertzel results for past and future time windows. Multiple arrays are also initialized to store cycle, amplitude, phase, and Bartels information.
Preparing the source data (srcVal) array:
The source data is copied into an array, srcVal, and detrended using one of the selected methods (hpsmthdt, zlagsmthdt, logZlagRegression, hpsmth, or zlagsmth).
Goertzel function call:
The Goertzel function is called to analyze the detrended source data and extract cycle information. The output, number_of_cycles, contains the number of detected cycles.
Initializing arrays for past and future waveforms:
Three arrays, epgoertzel, goertzel, and goertzelFuture, are initialized to store the endpoint Goertzel, non-endpoint Goertzel, and future Goertzel projections, respectively.
Calculating composite waveform for past bars (goertzel array):
The past composite waveform is calculated by summing the selected cycles (either from the user-defined cycle list or the top cycles) and optionally subtracting the noise component.
Calculating composite waveform for future bars (goertzelFuture array):
The future composite waveform is calculated in a similar way as the past composite waveform.
Drawing past composite waveform (pvlines):
The past composite waveform is drawn on the chart using solid lines. The color of the lines is determined by the direction of the waveform (green for upward, red for downward).
Drawing future composite waveform (fvlines):
The future composite waveform is drawn on the chart using dotted lines. The color of the lines is determined by the direction of the waveform (fuchsia for upward, yellow for downward).
Displaying cycle information in a table (table3):
A table is created to display the cycle information, including the rank, period, Bartel value, amplitude (or cycle strength), and phase of each detected cycle.
Filling the table with cycle information:
The indicator iterates through the detected cycles and retrieves the relevant information (period, amplitude, phase, and Bartel value) from the corresponding arrays. It then fills the table with this information, displaying the values up to six decimal places.
To summarize, this indicator generates a composite waveform based on the detected cycles in the financial data. It calculates the composite waveforms for both past and future time windows and visualizes them on the chart using colored lines. Additionally, it displays detailed cycle information in a table, including the rank, period, Bartel value, amplitude (or cycle strength), and phase of each detected cycle.
█ Enhancing the Goertzel Algorithm-Based Script for Financial Modeling and Trading
The Goertzel algorithm-based script for detecting dominant cycles in financial data is a powerful tool for financial modeling and trading. It provides valuable insights into the past behavior of these cycles and potential future impact. However, as with any algorithm, there is always room for improvement. This section discusses potential enhancements to the existing script to make it even more robust and versatile for financial modeling, general trading, advanced trading, and high-frequency finance trading.
Enhancements for Financial Modeling
Data preprocessing: One way to improve the script's performance for financial modeling is to introduce more advanced data preprocessing techniques. This could include removing outliers, handling missing data, and normalizing the data to ensure consistent and accurate results.
Additional detrending and smoothing methods: Incorporating more sophisticated detrending and smoothing techniques, such as wavelet transform or empirical mode decomposition, can help improve the script's ability to accurately identify cycles and trends in the data.
Machine learning integration: Integrating machine learning techniques, such as artificial neural networks or support vector machines, can help enhance the script's predictive capabilities, leading to more accurate financial models.
Enhancements for General and Advanced Trading
Customizable indicator integration: Allowing users to integrate their own technical indicators can help improve the script's effectiveness for both general and advanced trading. By enabling the combination of the dominant cycle information with other technical analysis tools, traders can develop more comprehensive trading strategies.
Risk management and position sizing: Incorporating risk management and position sizing functionality into the script can help traders better manage their trades and control potential losses. This can be achieved by calculating the optimal position size based on the user's risk tolerance and account size.
Multi-timeframe analysis: Enhancing the script to perform multi-timeframe analysis can provide traders with a more holistic view of market trends and cycles. By identifying dominant cycles on different timeframes, traders can gain insights into the potential confluence of cycles and make better-informed trading decisions.
Enhancements for High-Frequency Finance Trading
Algorithm optimization: To ensure the script's suitability for high-frequency finance trading, optimizing the algorithm for faster execution is crucial. This can be achieved by employing efficient data structures and refining the calculation methods to minimize computational complexity.
Real-time data streaming: Integrating real-time data streaming capabilities into the script can help high-frequency traders react to market changes more quickly. By continuously updating the cycle information based on real-time market data, traders can adapt their strategies accordingly and capitalize on short-term market fluctuations.
Order execution and trade management: To fully leverage the script's capabilities for high-frequency trading, implementing functionality for automated order execution and trade management is essential. This can include features such as stop-loss and take-profit orders, trailing stops, and automated trade exit strategies.
While the existing Goertzel algorithm-based script is a valuable tool for detecting dominant cycles in financial data, there are several potential enhancements that can make it even more powerful for financial modeling, general trading, advanced trading, and high-frequency finance trading. By incorporating these improvements, the script can become a more versatile and effective tool for traders and financial analysts alike.
█ Understanding the Limitations of the Goertzel Algorithm
While the Goertzel algorithm-based script for detecting dominant cycles in financial data provides valuable insights, it is important to be aware of its limitations and drawbacks. Some of the key drawbacks of this indicator are:
Lagging nature:
As with many other technical indicators, the Goertzel algorithm-based script can suffer from lagging effects, meaning that it may not immediately react to real-time market changes. This lag can lead to late entries and exits, potentially resulting in reduced profitability or increased losses.
Parameter sensitivity:
The performance of the script can be sensitive to the chosen parameters, such as the detrending methods, smoothing techniques, and cycle detection settings. Improper parameter selection may lead to inaccurate cycle detection or increased false signals, which can negatively impact trading performance.
Complexity:
The Goertzel algorithm itself is relatively complex, making it difficult for novice traders or those unfamiliar with the concept of cycle analysis to fully understand and effectively utilize the script. This complexity can also make it challenging to optimize the script for specific trading styles or market conditions.
Overfitting risk:
As with any data-driven approach, there is a risk of overfitting when using the Goertzel algorithm-based script. Overfitting occurs when a model becomes too specific to the historical data it was trained on, leading to poor performance on new, unseen data. This can result in misleading signals and reduced trading performance.
No guarantee of future performance: While the script can provide insights into past cycles and potential future trends, it is important to remember that past performance does not guarantee future results. Market conditions can change, and relying solely on the script's predictions without considering other factors may lead to poor trading decisions.
Limited applicability: The Goertzel algorithm-based script may not be suitable for all markets, trading styles, or timeframes. Its effectiveness in detecting cycles may be limited in certain market conditions, such as during periods of extreme volatility or low liquidity.
While the Goertzel algorithm-based script offers valuable insights into dominant cycles in financial data, it is essential to consider its drawbacks and limitations when incorporating it into a trading strategy. Traders should always use the script in conjunction with other technical and fundamental analysis tools, as well as proper risk management, to make well-informed trading decisions.
█ Interpreting Results
The Goertzel Browser indicator can be interpreted by analyzing the plotted lines and the table presented alongside them. The indicator plots two lines: past and future composite waves. The past composite wave represents the composite wave of the past price data, and the future composite wave represents the projected composite wave for the next period.
The past composite wave line displays a solid line, with green indicating a bullish trend and red indicating a bearish trend. On the other hand, the future composite wave line is a dotted line with fuchsia indicating a bullish trend and yellow indicating a bearish trend.
The table presented alongside the indicator shows the top cycles with their corresponding rank, period, Bartels, amplitude or cycle strength, and phase. The amplitude is a measure of the strength of the cycle, while the phase is the position of the cycle within the data series.
Interpreting the Goertzel Browser indicator involves identifying the trend of the past and future composite wave lines and matching them with the corresponding bullish or bearish color. Additionally, traders can identify the top cycles with the highest amplitude or cycle strength and utilize them in conjunction with other technical indicators and fundamental analysis for trading decisions.
This indicator is considered a repainting indicator because the value of the indicator is calculated based on the past price data. As new price data becomes available, the indicator's value is recalculated, potentially causing the indicator's past values to change. This can create a false impression of the indicator's performance, as it may appear to have provided a profitable trading signal in the past when, in fact, that signal did not exist at the time.
The Goertzel indicator is also non-endpointed, meaning that it is not calculated up to the current bar or candle. Instead, it uses a fixed amount of historical data to calculate its values, which can make it difficult to use for real-time trading decisions. For example, if the indicator uses 100 bars of historical data to make its calculations, it cannot provide a signal until the current bar has closed and become part of the historical data. This can result in missed trading opportunities or delayed signals.
█ Conclusion
The Goertzel Browser indicator is a powerful tool for identifying and analyzing cyclical patterns in financial markets. Its ability to detect multiple cycles of varying frequencies and strengths make it a valuable addition to any trader's technical analysis toolkit. However, it is important to keep in mind that the Goertzel Browser indicator should be used in conjunction with other technical analysis tools and fundamental analysis to achieve the best results. With continued refinement and development, the Goertzel Browser indicator has the potential to become a highly effective tool for financial modeling, general trading, advanced trading, and high-frequency finance trading. Its accuracy and versatility make it a promising candidate for further research and development.
█ Footnotes
What is the Bartels Test for Cycle Significance?
The Bartels Cycle Significance Test is a statistical method that determines whether the peaks and troughs of a time series are statistically significant. The test is named after its inventor, George Bartels, who developed it in the mid-20th century.
The Bartels test is designed to analyze the cyclical components of a time series, which can help traders and analysts identify trends and cycles in financial markets. The test calculates a Bartels statistic, which measures the degree of non-randomness or autocorrelation in the time series.
The Bartels statistic is calculated by first splitting the time series into two halves and calculating the range of the peaks and troughs in each half. The test then compares these ranges using a t-test, which measures the significance of the difference between the two ranges.
If the Bartels statistic is greater than a critical value, it indicates that the peaks and troughs in the time series are non-random and that there is a significant cyclical component to the data. Conversely, if the Bartels statistic is less than the critical value, it suggests that the peaks and troughs are random and that there is no significant cyclical component.
The Bartels Cycle Significance Test is particularly useful in financial analysis because it can help traders and analysts identify significant cycles in asset prices, which can in turn inform investment decisions. However, it is important to note that the test is not perfect and can produce false signals in certain situations, particularly in noisy or volatile markets. Therefore, it is always recommended to use the test in conjunction with other technical and fundamental indicators to confirm trends and cycles.
Deep-dive into the Hodrick-Prescott Fitler
The Hodrick-Prescott (HP) filter is a statistical tool used in economics and finance to separate a time series into two components: a trend component and a cyclical component. It is a powerful tool for identifying long-term trends in economic and financial data and is widely used by economists, central banks, and financial institutions around the world.
The HP filter was first introduced in the 1990s by economists Robert Hodrick and Edward Prescott. It is a simple, two-parameter filter that separates a time series into a trend component and a cyclical component. The trend component represents the long-term behavior of the data, while the cyclical component captures the shorter-term fluctuations around the trend.
The HP filter works by minimizing the following objective function:
Minimize: (Sum of Squared Deviations) + λ (Sum of Squared Second Differences)
Where:
The first term represents the deviation of the data from the trend.
The second term represents the smoothness of the trend.
λ is a smoothing parameter that determines the degree of smoothness of the trend.
The smoothing parameter λ is typically set to a value between 100 and 1600, depending on the frequency of the data. Higher values of λ lead to a smoother trend, while lower values lead to a more volatile trend.
The HP filter has several advantages over other smoothing techniques. It is a non-parametric method, meaning that it does not make any assumptions about the underlying distribution of the data. It also allows for easy comparison of trends across different time series and can be used with data of any frequency.
However, the HP filter also has some limitations. It assumes that the trend is a smooth function, which may not be the case in some situations. It can also be sensitive to changes in the smoothing parameter λ, which may result in different trends for the same data. Additionally, the filter may produce unrealistic trends for very short time series.
Despite these limitations, the HP filter remains a valuable tool for analyzing economic and financial data. It is widely used by central banks and financial institutions to monitor long-term trends in the economy, and it can be used to identify turning points in the business cycle. The filter can also be used to analyze asset prices, exchange rates, and other financial variables.
The Hodrick-Prescott filter is a powerful tool for analyzing economic and financial data. It separates a time series into a trend component and a cyclical component, allowing for easy identification of long-term trends and turning points in the business cycle. While it has some limitations, it remains a valuable tool for economists, central banks, and financial institutions around the world.

Ticker Correlation Reference IndicatorHello,
I am super excited to be releasing this Ticker Correlation assessment indicator. This is a big one so let us get right into it!
Inspiration:
The inspiration for this indicator came from a similar indicator by Balipour called the Correlation with P-Value and Confidence Interval. It’s a great indicator, you should check it out!
I used it quite a lot when looking for correlations; however, there were some limitations to this indicator’s functionality that I wanted. So I decided to make my own indicator that had the functionality I wanted. I have been using this for some time but decided to actual spruce it up a bit and make it user friendly so that I could share it publically. So let me get into what this indicator does and, most importantly, the expanded functionality of this indicator.
What it does:
This indicator determines the correlation between 2 separate tickers. The user selects the two tickers they wish to compare and it performs a correlation assessment over a defaulted 14 period length and displays the results. However, the indicator takes this much further. The complete functionality of this indicator includes the following:
1. Assesses the correlation of all 4 ticker variables (Open, High, Low and Close) over a user defined period of time (defaulted to 14);
2. Converts both tickers to a Z-Score in order to standardize the data and provide a side by side comparison;
3. Displays areas of high and low correlation between all 4 variables;
4. Looks back over the consistency of the relationship (is correlation consistent among the two tickers or infrequent?);
5. Displays the variance in the correlation (there may be a statistically significant relationship, but if there is a high variance, it means the relationship is unstable);
6. Permits manual conversion between prices; and
7. Determines the degree of statistical significance (be it stable, unstable or non-existent).
I will discuss each of these functions below.
Function 1: Assesses the correlation of all 4 variables.
The only other indicator that does this only determines the correlation of the close price. However, correlation between all 4 variables varies. The correlation between open prices, high prices, low prices and close prices varies in statistically significant ways. As such, this indicator plots the correlation of all 4 ticker variables and displays each correlation.
Assessing this matters because sometimes a stock may not have the same magnitude in highs and lows as another stock (one stock may be more bullish, i.e. attain higher highs in comparison to another stock). Close price is helpful but does not pain the full picture. As such, the indicator displays the correlation relationship between all 4 variables (image below):
Function 2: Converts both tickers to Z-Score
Z-Score is a way of standardizing data. It simply measures how far a stock is trading in relation to its mean. As such, it is a way to express both tickers on a level playing field. Z-Score was also chosen because the Z-Score Values (0 – 4) also provide an appropriate scale to plot correlation lines (which range from 0 to 1).
The primary ticker (Ticker 1) is plotted in blue, the secondary comparison ticker (Ticker 2) is plotted in a colour changing format (which will be discussed below). See the image below:
Function 3: Displays areas of high and low correlation
While Ticker 1 is plotted in a static blue, Ticker 2 (the comparison ticker) is plotted in a dynamic, colour changing format. It will display areas of high correlation (i.e. areas with a P value greater than or equal to 0.9 or less than and equal to -0.9) in green, areas of moderate correlation in white. Areas of low correlation (between 0.4 and 0 or -0.4 and 0) are in red. (see image below):
Function 4: Checks consistency of relationship
While at the time of assessing a stock there very well maybe a high correlation, whether that correlation is consistent or not is the question. The indicator employs the use of the SMA function to plot the average correlation over a defined period of time. If the correlation is consistently high, the SMA should be within an area of statistical significance (over 0.5 or under -0.5). If the relationship is inconsistent, the SMA will read a lower value than the actual correlation.
You can see an example of this when you compare ETH to Tezos in the image below:
You can see that the correlation between ETH and Tezo’s on the high level seems to be inconsistent. While the current correlation is significant, the SMA is showing that the average correlation between the highs is actually less than 0.5.
The indicator also tells the user narratively the degree of consistency in the statistical relationship. This will be discussed later.
Function 5: Displays the variance
When it comes to correlation, variance is important. Variance simply means the distance between the highest and lowest value. The indicator assess the variance. A high degree of variance (i.e. a number surpassing 0.5 or greater) generally means the consistency and stability of the relationship is in issue. If there is a high variance, it means that the two tickers, while seemingly significantly correlated, tend to deviate from each other quite extensively.
The indicator will tell the user the variance in the narrative bar at the bottom of the chart (see image below):
Function 6: Permits manual conversion of price
One thing that I frequently want and like to do is convert prices between tickers. If I am looking at SPX and I want to calculate a price on SPY, I want to be able to do that quickly. This indicator permits you to do that by employing a regression based formula to convert Ticker 1 to Ticker 2.
The user can actually input which variable they would like to convert, whether they want to convert Ticker 1 Close to Ticker 2 Close, or Ticker 1 High to Ticker 2 High, or low or open.
To do this, open the settings and click “Permit Manual Conversion”. This will then take the current Ticker 1 Close price and convert it to Ticker 2 based on the regression calculations.
If you want to know what a specific price on Ticker 1 is on Ticker 2, simply click the “Allow Manual Price Input” variable and type in the price of Ticker 1 you want to know on Ticker 2. It will perform the calculation for you and will also list the standard error of the calculation.
Below is an example of calculating a SPY price using SPX data:
Above, the indicator was asked to convert an SPX price of 4,100 to a SPY price. The result was 408.83 with a standard error of 4.31, meaning we can expect 4,100 to fall within 408.83 +/- 4.31 on SPY.
Function 7: Determines the degree of statistical significance
The indicator will provide the user with a narrative output of the degree of statistical significance. The indicator looks beyond simply what the correlation is at the time of the assessment. It uses the SMA and the highest and lowest function to make an assessment of the stability of the statistical relationship and then indicates this to the user. Below is an example of IWM compared to SPY:
You will see, the indicator indicates that, while there is a statistically significant positive relationship, the relationship is somewhat unstable and inconsistent. Not only does it tell you this, but it indicates the degree of inconsistencies by listing the variance and the range of the inconsistencies.
And below is SPY to DIA:
SPY to BTCUSD:
And finally SPY to USDCAD Currency:
Other functions:
The indicator will also plot the raw or smoothed correlation result for the Open, High, Low or Close price. The default is to close price and smoothed. Smoothed just means it is displaying the SMA over the raw correlation score. Unsmoothing it will show you the raw correlation score.
The user also has the ability to toggle on and off the correlation table and the narrative table so that they can just review the chart (the side by side comparison of the 2 tickers).
Customizability
All of the functions are customizable for the most part. The user can determine the length of lookback, etc. The default parameters for all are 14. The only thing not customizable is the assessment used for determining the stability of a statistical relationship (set at 100 candle lookback) and the regression analysis used to convert price (10 candle lookback).
User Notes and important application tips:
#1: If using the manual calculation function to convert price, it is recommended to use this on the hourly or daily chart.
#2: Leaving pre-market data on can cause some errors. It is recommended to use the indicator with regular market hours enabled and extended market hours disabled.
#3: No ticker is off limits. You can compare anything against anything! Have fun with it and experiment!
Non-Indicator Specific Discussions:
Why does correlation between stocks mater?
This can matter for a number of reasons. For investors, it is good to diversify your portfolio and have a good array of stocks that operate somewhat independently of each other. This will allow you to see how your investments compare to each other and the degree of the relationship.
Another function may be getting exposure to more expensive tickers. I am guilty of trading IWM to gain exposure to SPY at a reduced cost basis :-).
What is a statistically significant correlation?
The rule of thumb is anything 0.5 or greater is considered statistically significant. The ideal setup is 0.9 or more as the effect is almost identical. That said, a lot of factors play into statistical significance. For example, the consistency and variance are 2 important factors most do not consider when ascertaining significance. Perhaps IWM and SPY are significantly correlated today, but is that a reliable relationship and can that be counted on as a rule?
These are things that should be considered when trading one ticker against another and these are things that I have attempted to address with this indicator!
Final notes:
I know I usually do tutorial videos. I have not done one here, but I will. Check back later for this.
I hope you enjoy the indicator and please feel free to share your thoughts and suggestions!
Safe trades all!

FTR, WMA, OBV & RSI StrategyThis Pine Script code is a trading strategy that uses several indicators such as Fisher Transform (FTR), On-Balance Volume (OBV), Relative Strength Index (RSI), and a Weighted Moving Average (WMA). The strategy generates buy and sell signals based on the conditions of these indicators.
The Fisher Transform function is a technical indicator that uses past prices to determine whether the current market is bullish or bearish. The Fisher Transform function takes in four multipliers and a length parameter. The four multipliers are used to calculate four Fisher Transform values, and these values are used in combination to determine if the market is bullish or bearish.
The Weighted Moving Average (WMA) is a technical indicator that smooths out the price data by giving more weight to the most recent prices.
The Relative Strength Index (RSI) is a momentum indicator that measures the strength of a security's price action. The RSI ranges from 0 to 100 and is typically used to identify overbought or oversold conditions in the market.
The On-Balance Volume (OBV) is a technical indicator that uses volume to predict changes in the stock price. OBV values are calculated by adding volume on up days and subtracting volume on down days.
The strategy uses the Fisher Transform values to generate buy and sell signals when all four Fisher Transform values change color. It also uses the WMA to determine if the trend is bullish or bearish, the OBV to confirm the trend, and the RSI to filter out false signals.
The red and green triangular arrows attempt to indicate that the trend is bullish or bearish and should not be traded against in the opposite direction. This helps with my FOMO :)
All comments welcome!
The script should not be relied upon alone, there are no stop loss or take profit filters. The best results have been back-tested using Tradingview on the 45m - 3 hour timeframes.

Price Level Stats (PLS)Hello traders! In today's post, we're going to delve into a powerful custom indicator called Price Level Stats (PLS). This indicator combines the functionalities of Arbitrary Price Point Probability (APPP) and Bar Movement Probability (BMP) to create an easy-to-use tool that displays price levels and their corresponding probabilities based on percentage steps away from the current price. Let's explore how PLS works and how you can effectively utilize it in your trading strategy.
Overview of Price Level Stats (PLS)
The PLS indicator combines the APPP and BMP indicators, leveraging both their strengths to create a more comprehensive and versatile tool. The indicator calculates the probabilities of different price levels being reached, based on historical price data, and displays them on your chart. This tool allows you to analyze various price points with different percentage steps away from the current price, providing valuable insights into potential market movements.
Key Components of PLS
EMA Calculation: The PLS indicator uses the Exponential Moving Average (EMA) to calculate the mean of the price data. This calculation is necessary for determining the probabilities associated with various price levels.
Price Movement Probability (T-Dist) Function: This function calculates the price movement probability using the Student's T-distribution. This statistical method is advantageous for small sample sizes and allows for more accurate probability estimations.
Step Size and Steps: The indicator allows you to define the step size (percentage away from the current price) and the number of steps to analyze. This customization enables you to explore various price levels and their associated probabilities.
Drawing Probability Labels: PLS displays the calculated probabilities as labels on your chart, providing you with an easy-to-understand visual representation of the likelihood of specific price levels being reached.
Using PLS in Your Trading Strategy
Setting the Source and Step Size: Start by configuring the source (typically set to open) and the step size. The step size determines the percentage distance between the price levels you want to analyze. For instance, a step size of 0.2 means you will analyze price levels at 0.2%, 0.4%, 0.6%, and so on, away from the current price.
Configuring the Steps: Next, set the number of steps you want the indicator to analyze. This setting determines how many price levels the indicator will evaluate on both the bullish and bearish sides.
Choosing the Style: The PLS indicator offers three different styles: Bar Estimate, Log Bar Estimate, and Student's T. Bar Estimate and Log Bar Estimate utilize the BMP method, while the Student's T style uses the T-distribution function for probability calculations. Choose the style that best suits your trading strategy and preferences.
Interpreting the Probability Labels: Once you have configured the indicator settings, PLS will display the calculated probabilities as labels on your chart. These labels represent the likelihood of the associated price levels being reached. Use these probabilities to make informed trading decisions and manage your trades more effectively.
Benefits of the PLS Indicator
Comprehensive Analysis: By combining the functionalities of APPP and BMP indicators, PLS provides a more comprehensive analysis of potential price movements, helping you to make better-informed trading decisions.
Customization and Flexibility: PLS offers a high level of customization, allowing you to analyze various price levels and choose from different styles to suit your trading strategy and preferences.
Easy-to-Understand Visual Representation: The PLS indicator displays the calculated probabilities as labels on your chart, providing you with an easy-to-understand visual representation of the likelihood of specific price levels being reached. This visual representation allows you to quickly assess the market situation and make more informed decisions.
Versatility: The PLS indicator is versatile and can be used in conjunction with other technical analysis tools or as a standalone tool for assessing the probabilities of price movements. This versatility makes it a valuable addition to any trader's toolbox.
Improved Risk Management: By providing insight into the probabilities of various price levels being reached, the PLS indicator helps traders improve their risk management strategies. You can use these probabilities to set more accurate stop-loss and take-profit levels or to better time your entries and exits.
Customizing the PLS Indicator: Controls and Their Effects
The PLS indicator offers several controls that allow you to customize the output to better suit your trading needs. Understanding how these controls affect the output is essential for making the most out of this powerful tool. Below, we will discuss the two main controls - Step and Step Size - and explain their impact on the PLS indicator's output.
Step: The 'Step' control determines the number of steps taken away from the current price when calculating price levels and their associated probabilities. By increasing or decreasing the number of steps, you can adjust the range of price levels considered by the PLS indicator. For example, if you set the step value to 5, the PLS indicator will calculate probabilities for five price levels above and five price levels below the current price. Adjusting the number of steps allows you to focus on price levels that are more relevant to your trading strategy, helping you make better-informed decisions.
Step Size: The 'Step Size' control dictates the percentage distance between each step, which directly impacts the price levels being analyzed. For instance, if you set the step size to 0.5%, each price level considered by the PLS indicator will be 0.5% away from the previous one. A larger step size will result in a broader range of price levels being assessed, while a smaller step size will provide a more granular view of the price levels surrounding the current price. Adjusting the step size enables you to fine-tune the PLS indicator according to your preferred level of detail, allowing you to better analyze the probabilities associated with specific price movements.
By customizing the 'Step' and 'Step Size' controls, you can tailor the PLS indicator to your specific trading needs and preferences. These controls enable you to analyze a wide range of price levels or focus on a narrow range, depending on your strategy and risk tolerance. Experimenting with different combinations of step and step size values will help you find the optimal settings for your trading style and goals.
Conclusion
The Price Level Stats (PLS) indicator is a powerful tool that combines the strengths of the Arbitrary Price Point Probability (APPP) and Bar Movement Probability (BMP) indicators to provide traders with an easy-to-use system for analyzing potential price movements. By offering comprehensive analysis, customization, and easy-to-understand visual representation, PLS is an invaluable tool for traders looking to improve their trading strategies and risk management. Be sure to incorporate this versatile indicator into your trading arsenal to gain valuable insights into the probabilities of price levels being reached and make more informed trading decisions.
DOTS [CHE]This indicator is a must-have for every trader as it provides a practical tool to quickly evaluate the current price of a security. Designed specifically for manual trading, this indicator is based on "The Forbidden RSI " indicator and provides an easy way to identify overbought and oversold conditions in the market. By using this indicator, traders can make informed decisions about when to enter or exit a trade, maximizing their potential profits and minimizing their risks. Its simple yet effective design makes it an ideal choice for traders of all experience levels. Whether you are a seasoned professional or just starting out, this indicator can help you take your trading to the next level.
Description:
This is a Pine Script code designed to create an indicator that identifies overbought and oversold conditions in a security. The code first defines a function named "func" that takes three arguments - "close", "length", and "tr". It then calculates a value "k" based on the "close" and "length" arguments using this function.
The code then checks if "k" is greater than a variable named "OverBought" and assigns the resulting Boolean value to "OverboughtCond". It also checks if "k" is less than a variable named "OverSold" and assigns the resulting Boolean value to "OversoldCond".
The code then plots a small circle above the bar if "OverboughtCond" is true and below the bar if "OversoldCond" is true. The circles are colored green for "Overbought" and red for "Oversold". The code also creates a label with the name "Overbought" above the bar and a label with the name "Oversold" below the bar if the respective conditions are met.
Finally, the code sets up alert conditions for both the "Overbought" and "Oversold" cases, with a custom message that includes the name of the security, the current price, and the indicator's name.
I've tested the script for weeks and I hope it brings you as much success as it did me
best regards
Chervolino

Educational Strategy : TRIPLE DRAG-ON SYSTEM V.1The Triple Dragon System is a technical trading strategy that uses a combination of three different indicators to identify potential buy and sell signals in the market. The three indicators used in this strategy are the Extended Price Volume Trend (EPVT), the Donchian Channels, and the Parabolic SAR. Each of these indicators provides different types of information about the market, and by combining them, we can create a more comprehensive trading system.
The EPVT is used to identify potential trend changes and measure the strength of a trend. The Donchian Channels are used to identify the direction of the trend, while the Parabolic SAR is used to provide additional confirmation of trend changes and help determine potential entry and exit points.
In this strategy, we first use the EPVT and Donchian Channels to identify the direction of the trend. When the EPVT is above its baseline and the price is above the upper Donchian Channel, it suggests an uptrend. Conversely, when the EPVT is below its baseline and the price is below the lower Donchian Channel, it suggests a downtrend.
Once we have identified the trend direction, we use the Parabolic SAR to help determine potential entry and exit points. When the Parabolic SAR is below the price and flips to above the price, it suggests a potential buy signal. Conversely, when the Parabolic SAR is above the price and flips to below the price, it suggests a potential sell signal.
To further refine our trading signals, we use multiple timeframes to confirm the trend direction and ensure that we are not entering the market during a period of high volatility. We also use multiple take-profit levels to lock in profits and manage risk.
Overall, the Triple Dragon System is a comprehensive technical trading strategy that combines multiple indicators to provide clear entry and exit signals. By using a combination of trend-following and momentum indicators, we can identify potential trading opportunities while minimizing risk. Please note that this strategy is for educational purposes only and should not be taken as financial advice.
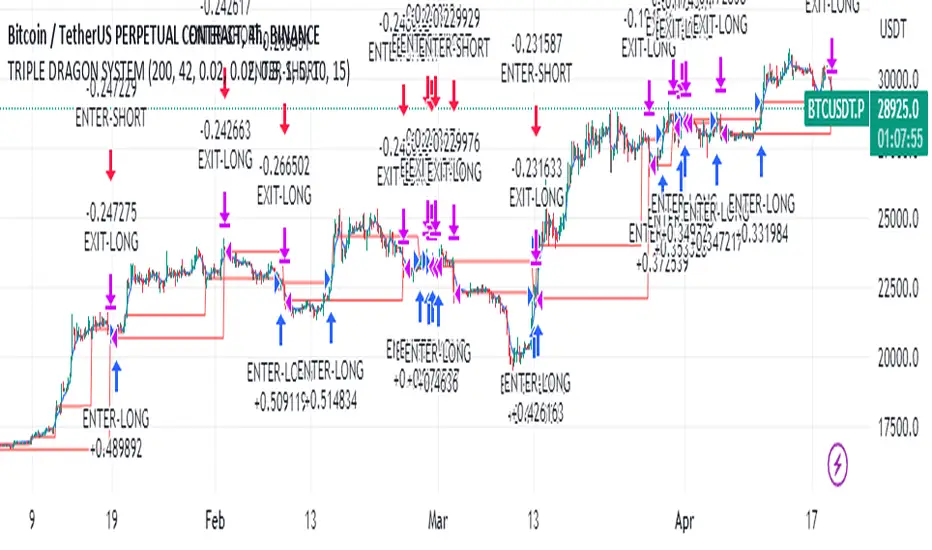
RiverFlow ADX ScreenerRiverFlow ADX Screener, Scans ADX and Donchian Trend values across various Timeframes. This screener provides support to the Riverflow indicator. Riverflow concept is based on Two indicators. Donchian Channel and ADX or DMI.
How to implement?
1.Donchian Channel with period 20
2. ADX / DMI 14,14 threshold 20
Entry / Exit:
1. Buy/Sell Signal from ADX Crossovers.
2. Trend Confirmation Donchian Channel.
3. Major Trend EMA 200
Buy/Sell:
After a buy/sell is generated by ADX Crossover, Check for Donchian Trend. it has to be in same direction as trend. for FTT trades take 2x limit. for Forex and Stocks take 1:1.5, SL must be placed below recent swing. One can use Riverflow indicator for better results.
ADX Indicator is plotted with
Plus: Green line
Minus: Red Line
ADX strength: plotted as Background area.
TREND: Trend is represented by Green and Red Area around Threshold line
Table:
red indicates down trend
green indicates up trend
grey indicates sideways
Weak ADX levels are treated sideways and a channel is plotted on ADX and PLUS and MINUS lines . NO TRADES are to be TAKEN on within the SIDEWAYS region.
Settings are not required as it purely works on Default settings. However Donchian Length can be changed from settings.
Timeframes below 1Day are screened. Riverflow strategy works on timeframe 5M and above timeframe. so option is not provided for lower timeframes.
Best suits for INTRADAY and LONG TERM Trading

3D Engine OverlayThe Overlay 3D Engine is an advanced and innovative indicator designed to render 3D objects on a trading chart using Pine Script language. This tool enables users to visualize complex geometric shapes and structures on their charts, providing a unique perspective on market trends and data. It is recommended to use this indicator with a time frame of 1 week or greater.
The code defines various data structures, such as vectors, faces, meshes, locations, objects, and cameras, to represent the 3D objects and their position in the 3D space. It also provides a set of functions to manipulate these structures, such as scaling, rotating, and translating the objects, as well as calculating their perspective transformation based on a given camera.
The main function, "render," takes a list of 3D objects (the scene) and a camera as input, processes the scene, and then generates the corresponding 2D lines to be drawn on the chart. The true range of the asset's price is calculated using an Exponential Moving Average (EMA), which helps adjust the rendering based on the asset's volatility.
The perspective transformation function "perspective_transform" takes a mesh, a camera, an object's vertical offset, and the true range as input and computes the 2D coordinates for each vertex in the mesh. These coordinates are then used to create a list of polygons that represent the visible faces of the objects in the scene.
The "process_scene" function takes a list of 3D objects and a camera as input and applies the perspective transformation to each object in the scene, generating a list of 2D polygons that represent the visible faces of the objects.
Finally, the "render" function iterates through the list of 2D polygons and draws the corresponding lines on the chart, effectively rendering the 3D objects in a 2D projection on the trading chart. The rendering is done using Pine Script's built-in "line" function, which allows for scalable and efficient visualization of the objects.
One of the challenges faced while developing the Overlay 3D Engine indicator was ensuring that the 3D objects rendered on the chart would automatically scale correctly for different time frames and trading pairs. Various assets and time frames exhibit different price ranges and volatilities, which can make it difficult to create a one-size-fits-all solution for rendering the 3D objects in a visually appealing and easily interpretable manner.
To overcome this challenge, I implemented a dynamic scaling mechanism that leverages the true range of the asset's price and a calculated ratio. The true range is calculated using an Exponential Moving Average (EMA) of the difference between the high and low prices of the asset. This measure provides a smooth estimate of the asset's volatility, which is then used to adjust the scaling of the 3D objects rendered on the chart.
The ratio is calculated by dividing the asset's opening price by the true range, which is then divided by a constant factor (32 in this case). This ratio effectively normalizes the scaling of the 3D objects based on the asset's price and volatility, ensuring that the rendered objects appear correctly sized and positioned on the chart, regardless of the time frame or trading pair being analyzed.
By incorporating the true range and the calculated ratio into the rendering process, the Overlay 3D Engine indicator is able to automatically adjust the scaling of the 3D objects on the chart, providing a consistent and visually appealing representation of the objects across various time frames and trading pairs. This dynamic scaling mechanism enhances the overall utility and versatility of the indicator, making it a valuable tool for traders and analysts seeking a unique perspective on market trends.
In addition to the dynamic scaling mechanism mentioned earlier, the Overlay 3D Engine indicator also employs a sophisticated perspective transformation to render the 3D objects on the chart. Perspective transformation is an essential aspect of 3D graphics, as it provides the necessary conversion from 3D coordinates to 2D coordinates, allowing the 3D objects to be displayed on a 2D chart.
The perspective transformation process in the Overlay 3D Engine indicator begins by taking the 3D mesh data of the objects and transforming their vertices based on the position, orientation, and field of view of a virtual camera. The camera's field of view (FOV) is adjusted using a tangent function, which ensures that the rendered objects appear with the correct perspective, regardless of the chart's aspect ratio.
Once the vertices of the 3D objects have been transformed, the perspective-transformed 2D coordinates are then used to create polygons that can be rendered on the chart. These polygons represent the visible faces of the 3D objects and are drawn using lines that connect the transformed vertices.
The incorporation of perspective transformation in the Overlay 3D Engine indicator ensures that the 3D objects are rendered with a realistic appearance, providing a visually engaging and informative representation of the market trends. This technique, combined with the dynamic scaling mechanism, makes the Overlay 3D Engine indicator a powerful and innovative tool for traders and analysts seeking to visualize and interpret market data in a unique and insightful manner.
In summary, the Overlay 3D Engine indicator offers a novel way to interpret and visualize market data, enhancing the overall trading experience by providing a unique perspective on market trends.

AUTOMATIC GRID BOT STRATEGY [ilovealgotrading]
OVERVIEW:
This Grid trading strategy can help you maximize your profit in a ranging sideways market with no clear direction.
INDICATOR:
We can get some money by taking advantage of the movement of the price between the range we have determined.
Short positions are opened while the price is rising, long positions are opened while the price is falling.
Therefore, there is no need to predict the trend direction.
What is different in this indicator:
I want to say thank you to © thequantscience. His GRID SPOT TRADING ALGORITHM - GRID BOT TRADING strategy helped me when I was writing my indicator.
I want to explain what I have improved:
1- Grid strategy is a type of strategy that can be traded in very short time frames and users can trade this strategy algorithmically by connecting this strategy to their own accounts with the help of API systems. For this reason, I have developed a software that can give us signals by dynamically changing the long and short messages when users are trading.
2- We can change the start and end dates of our grid bot as we want. It is necessary to use this setting when setting up automatic bots, so that previously opened transactions are not taken into account.
3 - Lot or quantity size should not be excessively small when users are taking automatic trades because exchanges have limitations, to avoid this problem, I have prevented this error by automatically rounding up to the nearest quantity size inside the software.
4 - Users can avoid excessive losses by using stop loss on this grid bot if they wish.
5 - When our price is over the range high or below the range low, our open positions are closed, if the stop button is active. We can also change which close price time frame we take as a basis from the settings.
6 -Users can set how many dollars they can enter per transaction while performing their transactions automatically.
IMPLEMENTATION DETAILS – SETTINGS:
This script allows the user to choose the highs and lows leves of our range. Our bot trades in the specified range.
1. This strategy allows us to set start and end backtest dates.
2. We can change range high and range low leves of our bot
3. IF people want to trade algorithmically with the help of this bot, there are 6 different input systems that will receive the Json codes as an alarm
4. IF the price closes above the upper line or below the lower line, all transactions will be closed. We can determine in which time frame our transactions will be stopped if the price closes outside these levels.We can adjust how our bot works by activating or turning off the Stop Loss button.
5. In this strategy, you can determine your dollar cost for per position.
6. The user can also divide the interval we have determined into 10 parts or 20 equal parts.
7. The grid is divided and colored at the interval we set. At the same time, if we don't want we can turn off colored channels.
Notes:
If you're going to connect this bot to an automatic Long and Short direction,
Don’t forget! you need to Webhook URL,
Don’t miss paste this code to your message window {{strategy.order.alert_message}}
ALSO:
Set your range below the support zones and above the resistance zones.
Don't be afraid to take a wide range, it doesn't matter if you make a little money, the important thing is that you don't lose money.
If you have any ideas what to add to my work to add more sources or make calculations cooler, suggest in DM .

Zero-lag TEMA Crosses [Loxx]Zero-lag TEMA Crosses is a spinoff of a the Zero-lag MA as described by David Stendahl in the April 2000 issue of the journal "Technical Analysis of Stocks and Commodities". This indicator uses TEMA calculation mode in order to make the lag lesser compared to the original Zero-lag MA, and that makes this version even faster than the Zero-lag DEMA too. This indicator is the difference between a Fast and Slow Zero-lag TEMA. This indicator is very useful for lower timeframe scalping.
What is the Zero-lag MA?
The Zero-lag MA (Zero-Lag Moving Average) is a technical indicator that was introduced in the April 2000 issue of the journal "Technical Analysis of Stocks and Commodities" by David Stendahl.
The Zero-lag MA is a type of moving average (MA) that is designed to reduce or eliminate the lag that is typically associated with traditional moving averages. Moving averages are a widely used technical analysis tool that helps traders to identify trends and potential trading opportunities. They work by calculating the average price of a security over a given period of time, and then plotting that average on a chart. The most commonly used moving averages are simple moving averages (SMAs) and exponential moving averages (EMAs).
The problem with traditional moving averages is that they can be slow to respond to changes in market conditions. This lag can cause traders to miss out on potential trading opportunities, or to enter or exit trades at the wrong time. The Zero-lag MA was developed as a solution to this problem.
The Zero-lag MA is calculated using a combination of two EMAs and a subtraction formula. The first step in calculating the Zero-lag MA is to calculate two exponential moving averages: a fast EMA and a slow EMA. The fast EMA is calculated over a shorter period of time than the slow EMA. The exact period lengths will depend on the trader's preferences and the security being analyzed.
Once the two EMAs have been calculated, the next step is to take the difference between them. This difference represents the current market trend, with a positive value indicating an uptrend and a negative value indicating a downtrend. However, this difference alone is not enough to create a useful indicator, as it can still suffer from lag.
To further reduce lag, the difference between the two EMAs is multiplied by a factor derived from a third, slower EMA. This slower EMA acts as a smoothing factor, helping to reduce noise and make the indicator more accurate. The exact period length of the slower EMA will depend on the trader's preferences and the security being analyzed.
The final step in calculating the Zero-lag MA is to add the result of the multiplication to the fast EMA. This produces a final value that represents the current market trend with reduced lag. The Zero-lag MA can be plotted on a chart like any other moving average, and can be used to identify trends, potential trading opportunities, and support and resistance levels.
Overall, the Zero-lag MA is designed to provide traders with a more accurate representation of current market conditions by reducing the lag time between price changes and the moving average. By doing so, it can help traders to make more informed trading decisions and improve their overall profitability.
What is the TEMA?
The triple exponential moving average (TEMA) is a technical analysis indicator that was developed to reduce the lag of traditional moving averages, such as the simple moving average (SMA) or the exponential moving average (EMA). The TEMA was first introduced by Patrick Mulloy in the January 1994 issue of the "Technical Analysis of Stocks and Commodities" magazine.
The TEMA is a type of moving average that is calculated by applying multiple exponential smoothing techniques to price data. Unlike traditional moving averages, which apply a single smoothing factor to price data, the TEMA applies three smoothing factors to produce a more responsive and accurate indicator.
To calculate the TEMA, the following steps are taken:
Calculate the single exponential moving average (SMA) of the price data over a given period.
Calculate the double exponential moving average (DEMA) of the SMA over the same period.
Calculate the triple exponential moving average (TEMA) of the DEMA over the same period.
The formula for calculating the TEMA is:
TEMA = 3 * EMA(SMA) - 3 * EMA(EMA(SMA)) + EMA(EMA(EMA(SMA)))
where EMA is the exponential moving average and SMA is the simple moving average.
The TEMA is designed to reduce the lag associated with traditional moving averages by applying multiple smoothing factors to the price data. This helps to filter out short-term price fluctuations and provide a smoother indicator of the underlying trend. The TEMA is also less susceptible to whipsaws, which occur when a security's price moves in one direction and then quickly reverses, causing false trading signals.
The TEMA can be used in a variety of ways in technical analysis. It can be used to identify trends, determine support and resistance levels, and generate trading signals. When the TEMA is rising, it is generally interpreted as a bullish signal, indicating that the price is trending higher. When the TEMA is falling, it is generally interpreted as a bearish signal, indicating that the price is trending lower.
In summary, the TEMA is a more responsive and accurate indicator than traditional moving averages, designed to reduce lag and provide a smoother representation of the underlying trend. It is a useful tool for technical analysts and traders looking to identify trends, support and resistance levels, and potential trading opportunities.
Extras
Alerts
Bar coloring
Signals
Loxx's Expanded Source Types, see here:
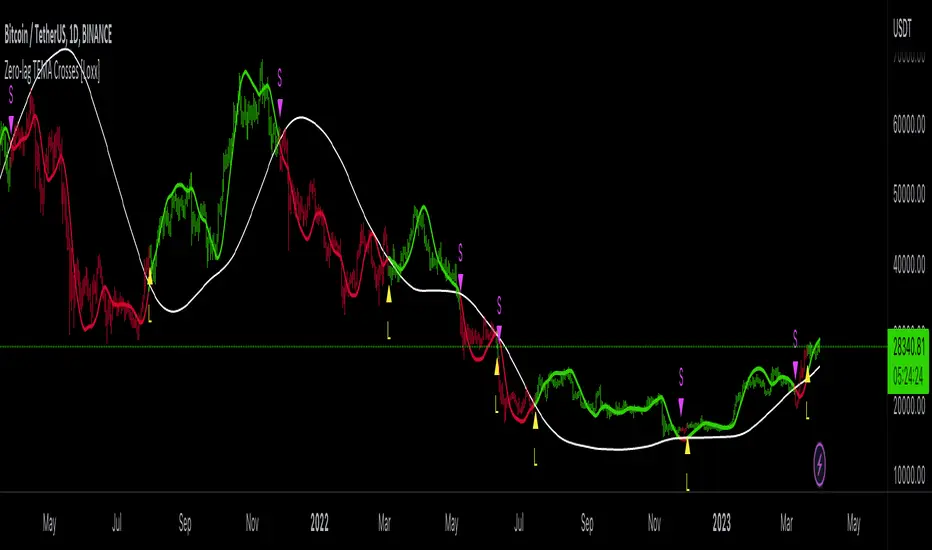
Wavemeter [theEccentricTrader]█ OVERVIEW
This indicator is a representation of my take on price action based wave cycle theory. The indicator counts the number of confirmed wave cycles, keeps a rolling tally of the average wave length, wave height and frequency, and displays the statistics in a table. The indicator also displays the current wave measurements as an optional feature.
█ CONCEPTS
Green and Red Candles
• A green candle is one that closes with a high price equal to or above the price it opened.
• A red candle is one that closes with a low price that is lower than the price it opened.
Swing Highs and Swing Lows
• A swing high is a green candle or series of consecutive green candles followed by a single red candle to complete the swing and form the peak.
• A swing low is a red candle or series of consecutive red candles followed by a single green candle to complete the swing and form the trough.
Peak and Trough Prices (Basic)
• The peak price of a complete swing high is the high price of either the red candle that completes the swing high or the high price of the preceding green candle, depending on which is higher.
• The trough price of a complete swing low is the low price of either the green candle that completes the swing low or the low price of the preceding red candle, depending on which is lower.
Historic Peaks and Troughs
The current, or most recent, peak and trough occurrences are referred to as occurrence zero. Previous peak and trough occurrences are referred to as historic and ordered numerically from right to left, with the most recent historic peak and trough occurrences being occurrence one.
Wave Cycles
A wave cycle is here defined as a complete two-part move between a swing high and a swing low, or a swing low and a swing high. As can be seen in the example above, the first swing high or swing low will set the course for the sequence of wave cycles that follow; a chart that begins with a swing low will form its first complete wave cycle upon the formation of the first complete swing high and vice versa.
Wave Length
Wave length is here measured in terms of bar distance between the start and end of a wave cycle. For example, if the current wave cycle ends on a swing low the wave length will be the difference in bars between the current swing low and current swing high. In such a case, if the current swing low completes on candle 100 and the current swing high completed on candle 95, we would simply subtract 95 from 100 to give us a wave length of 5 bars.
Average wave length is here measured in terms of total bars as a proportion as total waves. The average wavelength is calculated by dividing the total candles by the total wave cycles.
Wave Height
Wave height is here measured in terms of current range. For example, if the current peak price is 100 and the current trough price is 80, the wave height will be 20.
Amplitude
Amplitude is here measured in terms of current range divided by two. For example if the current peak price is 100 and the current trough price is 80, the amplitude would be calculated by subtracting 80 from 100 and dividing the answer by 2 to give us an amplitude of 10.
Frequency
Frequency is here measured in terms of wave cycles per second (Hertz). For example, if the total wave cycle count is 10 and the amount of time it has taken to complete these 10 cycles is 1-year (31,536,000 seconds), the frequency would be calculated by dividing 10 by 31,536,000 to give us a frequency of 0.00000032 Hz.
Range
The range is simply the difference between the current peak and current trough prices, generally expressed in terms of points or pips.
█ FEATURES
Inputs
Show Sample Period
Start Date
End Date
Position
Text Size
Show Current
Show Lines
Table
The table is colour coded, consists of two columns and, as many as, nine rows. Blue cells display the total wave cycle count and average wave measurements. Green cells display the current wave measurements. And the final row in column one, coloured black, displays the sample period. Both current wave measurements and sample period cells can be hidden at the user’s discretion.
Lines
For a visual aid to the wave cycles, I have added a blue line that traces out the waves on the chart. These lines can be hidden at the user’s discretion.
█ HOW TO USE
The indicator is intended for research purposes, strategy development and strategy optimisation. I hope it will be useful in helping to gain a better understanding of the underlying dynamics at play on any given market and timeframe.
For example, the indicator can be used to compare the current range and frequency with the average range and frequency, which can be useful for gauging current market conditions versus historic and getting a feel for how different markets and timeframes behave.
█ LIMITATIONS
Some higher timeframe candles on tickers with larger lookbacks such as the DXY , do not actually contain all the open, high, low and close (OHLC) data at the beginning of the chart. Instead, they use the close price for open, high and low prices. So, while we can determine whether the close price is higher or lower than the preceding close price, there is no way of knowing what actually happened intra-bar for these candles. And by default candles that close at the same price as the open price, will be counted as green. You can avoid this problem by utilising the sample period filter.
The green and red candle calculations are based solely on differences between open and close prices, as such I have made no attempt to account for green candles that gap lower and close below the close price of the preceding candle, or red candles that gap higher and close above the close price of the preceding candle. I can only recommend using 24-hour markets, if and where possible, as there are far fewer gaps and, generally, more data to work with. Alternatively, you can replace the scenarios with your own logic to account for the gap anomalies, if you are feeling up to the challenge.
It is also worth noting that the sample size will be limited to your Trading View subscription plan. Premium users get 20,000 candles worth of data, pro+ and pro users get 10,000, and basic users get 5,000. If upgrading is currently not an option, you can always keep a rolling tally of the statistics in an excel spreadsheet or something of the like.

MomentumIndicatorsLibrary "MomentumIndicators"
This is a library of 'Momentum Indicators', also denominated as oscillators.
The purpose of this library is to organize momentum indicators in just one place, making it easy to access.
In addition, it aims to allow customized versions, not being restricted to just the price value.
An example of this use case is the popular Stochastic RSI.
# Indicators:
1. Relative Strength Index (RSI):
Measures the relative strength of recent price gains to recent price losses of an asset.
2. Rate of Change (ROC):
Measures the percentage change in price of an asset over a specified time period.
3. Stochastic Oscillator (Stoch):
Compares the current price of an asset to its price range over a specified time period.
4. True Strength Index (TSI):
Measures the price change, calculating the ratio of the price change (positive or negative) in relation to the
absolute price change.
The values of both are smoothed twice to reduce noise, and the final result is normalized
in a range between 100 and -100.
5. Stochastic Momentum Index (SMI):
Combination of the True Strength Index with a signal line to help identify turning points in the market.
6. Williams Percent Range (Williams %R):
Compares the current price of an asset to its highest high and lowest low over a specified time period.
7. Commodity Channel Index (CCI):
Measures the relationship between an asset's current price and its moving average.
8. Ultimate Oscillator (UO):
Combines three different time periods to help identify possible reversal points.
9. Moving Average Convergence/Divergence (MACD):
Shows the difference between short-term and long-term exponential moving averages.
10. Fisher Transform (FT):
Normalize prices into a Gaussian normal distribution.
11. Inverse Fisher Transform (IFT):
Transform the values of the Fisher Transform into a smaller and more easily interpretable scale is through the
application of an inverse transformation to the hyperbolic tangent function.
This transformation takes the values of the FT, which range from -infinity to +infinity, to a scale limited
between -1 and +1, allowing them to be more easily visualized and compared.
12. Premier Stochastic Oscillator (PSO):
Normalizes the standard stochastic oscillator by applying a five-period double exponential smoothing average of
the %K value, resulting in a symmetric scale of 1 to -1
# Indicators of indicators:
## Stochastic:
1. Stochastic of RSI (Relative Strengh Index)
2. Stochastic of ROC (Rate of Change)
3. Stochastic of UO (Ultimate Oscillator)
4. Stochastic of TSI (True Strengh Index)
5. Stochastic of Williams R%
6. Stochastic of CCI (Commodity Channel Index).
7. Stochastic of MACD (Moving Average Convergence/Divergence)
8. Stochastic of FT (Fisher Transform)
9. Stochastic of Volume
10. Stochastic of MFI (Money Flow Index)
11. Stochastic of On OBV (Balance Volume)
12. Stochastic of PVI (Positive Volume Index)
13. Stochastic of NVI (Negative Volume Index)
14. Stochastic of PVT (Price-Volume Trend)
15. Stochastic of VO (Volume Oscillator)
16. Stochastic of VROC (Volume Rate of Change)
## Inverse Fisher Transform:
1.Inverse Fisher Transform on RSI (Relative Strengh Index)
2.Inverse Fisher Transform on ROC (Rate of Change)
3.Inverse Fisher Transform on UO (Ultimate Oscillator)
4.Inverse Fisher Transform on Stochastic
5.Inverse Fisher Transform on TSI (True Strength Index)
6.Inverse Fisher Transform on CCI (Commodity Channel Index)
7.Inverse Fisher Transform on Fisher Transform (FT)
8.Inverse Fisher Transform on MACD (Moving Average Convergence/Divergence)
9.Inverse Fisher Transfor on Williams R% (Williams Percent Range)
10.Inverse Fisher Transfor on CMF (Chaikin Money Flow)
11.Inverse Fisher Transform on VO (Volume Oscillator)
12.Inverse Fisher Transform on VROC (Volume Rate of Change)
## Stochastic Momentum Index:
1.Stochastic Momentum Index of RSI (Relative Strength Index)
2.Stochastic Momentum Index of ROC (Rate of Change)
3.Stochastic Momentum Index of VROC (Volume Rate of Change)
4.Stochastic Momentum Index of Williams R% (Williams Percent Range)
5.Stochastic Momentum Index of FT (Fisher Transform)
6.Stochastic Momentum Index of CCI (Commodity Channel Index)
7.Stochastic Momentum Index of UO (Ultimate Oscillator)
8.Stochastic Momentum Index of MACD (Moving Average Convergence/Divergence)
9.Stochastic Momentum Index of Volume
10.Stochastic Momentum Index of MFI (Money Flow Index)
11.Stochastic Momentum Index of CMF (Chaikin Money Flow)
12.Stochastic Momentum Index of On Balance Volume (OBV)
13.Stochastic Momentum Index of Price-Volume Trend (PVT)
14.Stochastic Momentum Index of Volume Oscillator (VO)
15.Stochastic Momentum Index of Positive Volume Index (PVI)
16.Stochastic Momentum Index of Negative Volume Index (NVI)
## Relative Strength Index:
1. RSI for Volume
2. RSI for Moving Average
rsi(source, length)
RSI (Relative Strengh Index). Measures the relative strength of recent price gains to recent price losses of an asset.
Parameters:
source : (float) Source of series (close, high, low, etc.)
length : (int) Period of loopback
Returns: (float) Series of RSI
roc(source, length)
ROC (Rate of Change). Measures the percentage change in price of an asset over a specified time period.
Parameters:
source : (float) Source of series (close, high, low, etc.)
length : (int) Period of loopback
Returns: (float) Series of ROC
stoch(kLength, kSmoothing, dSmoothing, maTypeK, maTypeD, almaOffsetKD, almaSigmaKD, lsmaOffSetKD)
Stochastic Oscillator. Compares the current price of an asset to its price range over a specified time period.
Parameters:
kLength
kSmoothing : (int) Period for smoothig stochastic
dSmoothing : (int) Period for signal (moving average of stochastic)
maTypeK : (int) Type of Moving Average for Stochastic Oscillator
maTypeD : (int) Type of Moving Average for Stochastic Oscillator Signal
almaOffsetKD : (float) Offset for Arnaud Legoux Moving Average for Oscillator and Signal
almaSigmaKD : (float) Sigma for Arnaud Legoux Moving Average for Oscillator and Signal
lsmaOffSetKD : (int) Offset for Least Squares Moving Average for Oscillator and Signal
Returns: A tuple of Stochastic Oscillator and Moving Average of Stochastic Oscillator
stoch(source, kLength, kSmoothing, dSmoothing, maTypeK, maTypeD, almaOffsetKD, almaSigmaKD, lsmaOffSetKD)
Stochastic Oscillator. Customized source. Compares the current price of an asset to its price range over a specified time period.
Parameters:
source : (float) Source of series (close, high, low, etc.)
kLength : (int) Period of loopback to calculate the stochastic
kSmoothing : (int) Period for smoothig stochastic
dSmoothing : (int) Period for signal (moving average of stochastic)
maTypeK : (int) Type of Moving Average for Stochastic Oscillator
maTypeD : (int) Type of Moving Average for Stochastic Oscillator Signal
almaOffsetKD : (float) Offset for Arnaud Legoux Moving Average for Stoch and Signal
almaSigmaKD : (float) Sigma for Arnaud Legoux Moving Average for Stoch and Signal
lsmaOffSetKD : (int) Offset for Least Squares Moving Average for Stoch and Signal
Returns: A tuple of Stochastic Oscillator and Moving Average of Stochastic Oscillator
tsi(source, shortLength, longLength, maType, almaOffset, almaSigma, lsmaOffSet)
TSI (True Strengh Index). Measures the price change, calculating the ratio of the price change (positive or negative) in relation to the absolute price change.
The values of both are smoothed twice to reduce noise, and the final result is normalized in a range between 100 and -100.
Parameters:
source : (float) Source of series (close, high, low, etc.)
shortLength : (int) Short length
longLength : (int) Long length
maType : (int) Type of Moving Average for TSI
almaOffset : (float) Offset for Arnaud Legoux Moving Average
almaSigma : (float) Sigma for Arnaud Legoux Moving Average
lsmaOffSet : (int) Offset for Least Squares Moving Average
Returns: (float) TSI
smi(sourceTSI, shortLengthTSI, longLengthTSI, maTypeTSI, almaOffsetTSI, almaSigmaTSI, lsmaOffSetTSI, maTypeSignal, smoothingLengthSignal, almaOffsetSignal, almaSigmaSignal, lsmaOffSetSignal)
SMI (Stochastic Momentum Index). A TSI (True Strengh Index) plus a signal line.
Parameters:
sourceTSI : (float) Source of series for TSI (close, high, low, etc.)
shortLengthTSI : (int) Short length for TSI
longLengthTSI : (int) Long length for TSI
maTypeTSI : (int) Type of Moving Average for Signal of TSI
almaOffsetTSI : (float) Offset for Arnaud Legoux Moving Average
almaSigmaTSI : (float) Sigma for Arnaud Legoux Moving Average
lsmaOffSetTSI : (int) Offset for Least Squares Moving Average
maTypeSignal
smoothingLengthSignal
almaOffsetSignal
almaSigmaSignal
lsmaOffSetSignal
Returns: A tuple with TSI, signal of TSI and histogram of difference
wpr(source, length)
Williams R% (Williams Percent Range). Compares the current price of an asset to its highest high and lowest low over a specified time period.
Parameters:
source : (float) Source of series (close, high, low, etc.)
length : (int) Period of loopback
Returns: (float) Series of Williams R%
cci(source, length, maType, almaOffset, almaSigma, lsmaOffSet)
CCI (Commodity Channel Index). Measures the relationship between an asset's current price and its moving average.
Parameters:
source : (float) Source of series (close, high, low, etc.)
length : (int) Period of loopback
maType : (int) Type of Moving Average
almaOffset : (float) Offset for Arnaud Legoux Moving Average
almaSigma : (float) Sigma for Arnaud Legoux Moving Average
lsmaOffSet : (int) Offset for Least Squares Moving Average
Returns: (float) Series of CCI
ultimateOscillator(fastLength, middleLength, slowLength)
UO (Ultimate Oscilator). Combines three different time periods to help identify possible reversal points.
Parameters:
fastLength : (int) Fast period of loopback
middleLength : (int) Middle period of loopback
slowLength : (int) Slow period of loopback
Returns: (float) Series of Ultimate Oscilator
ultimateOscillator(source, fastLength, middleLength, slowLength)
UO (Ultimate Oscilator). Customized source. Combines three different time periods to help identify possible reversal points.
Parameters:
source : (float) Source of series (close, high, low, etc.)
fastLength : (int) Fast period of loopback
middleLength : (int) Middle period of loopback
slowLength : (int) Slow period of loopback
Returns: (float) Series of Ultimate Oscilator
macd(source, fastLength, slowLength, signalLength, maTypeFast, maTypeSlow, maTypeMACD, almaOffset, almaSigma, lsmaOffSet)
MACD (Moving Average Convergence/Divergence). Shows the difference between short-term and long-term exponential moving averages.
Parameters:
source : (float) Source of series (close, high, low, etc.)
fastLength : (int) Period for fast moving average
slowLength : (int) Period for slow moving average
signalLength : (int) Signal length
maTypeFast : (int) Type of fast moving average
maTypeSlow : (int) Type of slow moving average
maTypeMACD : (int) Type of MACD moving average
almaOffset : (float) Offset for Arnaud Legoux Moving Average
almaSigma : (float) Sigma for Arnaud Legoux Moving Average
lsmaOffSet : (int) Offset for Least Squares Moving Average
Returns: A tuple with MACD, Signal, and Histgram
fisher(length)
Fisher Transform. Normalize prices into a Gaussian normal distribution.
Parameters:
length
Returns: A tuple with Fisher Transform and signal
fisher(source, length)
Fisher Transform. Customized source. Normalize prices into a Gaussian normal distribution.
Parameters:
source : (float) Source of series (close, high, low, etc.)
length
Returns: A tuple with Fisher Transform and signal
inverseFisher(source, length, subtrahend, denominator)
Inverse Fisher Transform.
Transform the values of the Fisher Transform into a smaller and more easily interpretable scale is
through the application of an inverse transformation to the hyperbolic tangent function.
This transformation takes the values of the FT, which range from -infinity to +infinity,
to a scale limited between -1 and +1, allowing them to be more easily visualized and compared.
Parameters:
source : (float) Source of series (close, high, low, etc.)
length : (int) Period for loopback
subtrahend : (int) Denominator. Useful in unbounded indicators. For example, in CCI.
denominator
Returns: (float) Series of Inverse Fisher Transform
premierStoch(length, smoothlen)
Premier Stochastic Oscillator (PSO).
Normalizes the standard stochastic oscillator by applying a five-period double exponential smoothing
average of the %K value, resulting in a symmetric scale of 1 to -1.
Parameters:
length : (int) Period for loopback
smoothlen : (int) Period for smoothing
Returns: (float) Series of PSO
premierStoch(source, smoothlen, subtrahend, denominator)
Premier Stochastic Oscillator (PSO) of custom source.
Normalizes the source by applying a five-period double exponential smoothing average.
Parameters:
source : (float) Source of series (close, high, low, etc.)
smoothlen : (int) Period for smoothing
subtrahend : (int) Denominator. Useful in unbounded indicators. For example, in CCI.
denominator
Returns: (float) Series of PSO
stochRsi(sourceRSI, lengthRSI, kLength, kSmoothing, dSmoothing, maTypeK, maTypeD, almaOffsetKD, almaSigmaKD, lsmaOffSetKD)
Parameters:
sourceRSI
lengthRSI
kLength
kSmoothing
dSmoothing
maTypeK
maTypeD
almaOffsetKD
almaSigmaKD
lsmaOffSetKD
stochRoc(sourceROC, lengthROC, kLength, kSmoothing, dSmoothing, maTypeK, maTypeD, almaOffsetKD, almaSigmaKD, lsmaOffSetKD)
Parameters:
sourceROC
lengthROC
kLength
kSmoothing
dSmoothing
maTypeK
maTypeD
almaOffsetKD
almaSigmaKD
lsmaOffSetKD
stochUO(fastLength, middleLength, slowLength, kLength, kSmoothing, dSmoothing, maTypeK, maTypeD, almaOffsetKD, almaSigmaKD, lsmaOffSetKD)
Parameters:
fastLength
middleLength
slowLength
kLength
kSmoothing
dSmoothing
maTypeK
maTypeD
almaOffsetKD
almaSigmaKD
lsmaOffSetKD
stochTSI(source, shortLength, longLength, maType, almaOffset, almaSigma, lsmaOffSet, kLength, kSmoothing, dSmoothing, maTypeK, maTypeD, almaOffsetKD, almaSigmaKD, lsmaOffSetKD)
Parameters:
source
shortLength
longLength
maType
almaOffset
almaSigma
lsmaOffSet
kLength
kSmoothing
dSmoothing
maTypeK
maTypeD
almaOffsetKD
almaSigmaKD
lsmaOffSetKD
stochWPR(source, length, kLength, kSmoothing, dSmoothing, maTypeK, maTypeD, almaOffsetKD, almaSigmaKD, lsmaOffSetKD)
Parameters:
source
length
kLength
kSmoothing
dSmoothing
maTypeK
maTypeD
almaOffsetKD
almaSigmaKD
lsmaOffSetKD
stochCCI(source, length, maType, almaOffset, almaSigma, lsmaOffSet, kLength, kSmoothing, dSmoothing, maTypeK, maTypeD, almaOffsetKD, almaSigmaKD, lsmaOffSetKD)
Parameters:
source
length
maType
almaOffset
almaSigma
lsmaOffSet
kLength
kSmoothing
dSmoothing
maTypeK
maTypeD
almaOffsetKD
almaSigmaKD
lsmaOffSetKD
stochMACD(source, fastLength, slowLength, signalLength, maTypeFast, maTypeSlow, maTypeMACD, almaOffset, almaSigma, lsmaOffSet, kLength, kSmoothing, dSmoothing, maTypeK, maTypeD, almaOffsetKD, almaSigmaKD, lsmaOffSetKD)
Parameters:
source
fastLength
slowLength
signalLength
maTypeFast
maTypeSlow
maTypeMACD
almaOffset
almaSigma
lsmaOffSet
kLength
kSmoothing
dSmoothing
maTypeK
maTypeD
almaOffsetKD
almaSigmaKD
lsmaOffSetKD
stochFT(length, kLength, kSmoothing, dSmoothing, maTypeK, maTypeD, almaOffsetKD, almaSigmaKD, lsmaOffSetKD)
Parameters:
length
kLength
kSmoothing
dSmoothing
maTypeK
maTypeD
almaOffsetKD
almaSigmaKD
lsmaOffSetKD
stochVolume(kLength, kSmoothing, dSmoothing, maTypeK, maTypeD, almaOffsetKD, almaSigmaKD, lsmaOffSetKD)
Parameters:
kLength
kSmoothing
dSmoothing
maTypeK
maTypeD
almaOffsetKD
almaSigmaKD
lsmaOffSetKD
stochMFI(source, length, kLength, kSmoothing, dSmoothing, maTypeK, maTypeD, almaOffsetKD, almaSigmaKD, lsmaOffSetKD)
Parameters:
source
length
kLength
kSmoothing
dSmoothing
maTypeK
maTypeD
almaOffsetKD
almaSigmaKD
lsmaOffSetKD
stochOBV(source, kLength, kSmoothing, dSmoothing, maTypeK, maTypeD, almaOffsetKD, almaSigmaKD, lsmaOffSetKD)
Parameters:
source
kLength
kSmoothing
dSmoothing
maTypeK
maTypeD
almaOffsetKD
almaSigmaKD
lsmaOffSetKD
stochPVI(source, kLength, kSmoothing, dSmoothing, maTypeK, maTypeD, almaOffsetKD, almaSigmaKD, lsmaOffSetKD)
Parameters:
source
kLength
kSmoothing
dSmoothing
maTypeK
maTypeD
almaOffsetKD
almaSigmaKD
lsmaOffSetKD
stochNVI(source, kLength, kSmoothing, dSmoothing, maTypeK, maTypeD, almaOffsetKD, almaSigmaKD, lsmaOffSetKD)
Parameters:
source
kLength
kSmoothing
dSmoothing
maTypeK
maTypeD
almaOffsetKD
almaSigmaKD
lsmaOffSetKD
stochPVT(source, kLength, kSmoothing, dSmoothing, maTypeK, maTypeD, almaOffsetKD, almaSigmaKD, lsmaOffSetKD)
Parameters:
source
kLength
kSmoothing
dSmoothing
maTypeK
maTypeD
almaOffsetKD
almaSigmaKD
lsmaOffSetKD
stochVO(shortLen, longLen, maType, almaOffset, almaSigma, lsmaOffSet, kLength, kSmoothing, dSmoothing, maTypeK, maTypeD, almaOffsetKD, almaSigmaKD, lsmaOffSetKD)
Parameters:
shortLen
longLen
maType
almaOffset
almaSigma
lsmaOffSet
kLength
kSmoothing
dSmoothing
maTypeK
maTypeD
almaOffsetKD
almaSigmaKD
lsmaOffSetKD
stochVROC(length, kLength, kSmoothing, dSmoothing, maTypeK, maTypeD, almaOffsetKD, almaSigmaKD, lsmaOffSetKD)
Parameters:
length
kLength
kSmoothing
dSmoothing
maTypeK
maTypeD
almaOffsetKD
almaSigmaKD
lsmaOffSetKD
iftRSI(sourceRSI, lengthRSI, lengthIFT)
Parameters:
sourceRSI
lengthRSI
lengthIFT
iftROC(sourceROC, lengthROC, lengthIFT)
Parameters:
sourceROC
lengthROC
lengthIFT
iftUO(fastLength, middleLength, slowLength, lengthIFT)
Parameters:
fastLength
middleLength
slowLength
lengthIFT
iftStoch(kLength, kSmoothing, dSmoothing, maTypeK, maTypeD, almaOffsetKD, almaSigmaKD, lsmaOffSetKD, lengthIFT)
Parameters:
kLength
kSmoothing
dSmoothing
maTypeK
maTypeD
almaOffsetKD
almaSigmaKD
lsmaOffSetKD
lengthIFT
iftTSI(source, shortLength, longLength, maType, almaOffset, almaSigma, lsmaOffSet, lengthIFT)
Parameters:
source
shortLength
longLength
maType
almaOffset
almaSigma
lsmaOffSet
lengthIFT
iftCCI(source, length, maType, almaOffset, almaSigma, lsmaOffSet, lengthIFT)
Parameters:
source
length
maType
almaOffset
almaSigma
lsmaOffSet
lengthIFT
iftFisher(length, lengthIFT)
Parameters:
length
lengthIFT
iftMACD(source, fastLength, slowLength, signalLength, maTypeFast, maTypeSlow, maTypeMACD, almaOffset, almaSigma, lsmaOffSet, lengthIFT)
Parameters:
source
fastLength
slowLength
signalLength
maTypeFast
maTypeSlow
maTypeMACD
almaOffset
almaSigma
lsmaOffSet
lengthIFT
iftWPR(source, length, lengthIFT)
Parameters:
source
length
lengthIFT
iftMFI(source, length, lengthIFT)
Parameters:
source
length
lengthIFT
iftCMF(length, lengthIFT)
Parameters:
length
lengthIFT
iftVO(shortLen, longLen, maType, almaOffset, almaSigma, lsmaOffSet, lengthIFT)
Parameters:
shortLen
longLen
maType
almaOffset
almaSigma
lsmaOffSet
lengthIFT
iftVROC(length, lengthIFT)
Parameters:
length
lengthIFT
smiRSI(source, length, shortLengthTSI, longLengthTSI, maTypeTSI, almaOffsetTSI, almaSigmaTSI, lsmaOffSetTSI, maTypeSignal, smoothingLengthSignal, almaOffsetSignal, almaSigmaSignal, lsmaOffSetSignal)
Parameters:
source
length
shortLengthTSI
longLengthTSI
maTypeTSI
almaOffsetTSI
almaSigmaTSI
lsmaOffSetTSI
maTypeSignal
smoothingLengthSignal
almaOffsetSignal
almaSigmaSignal
lsmaOffSetSignal
smiROC(source, length, shortLengthTSI, longLengthTSI, maTypeTSI, almaOffsetTSI, almaSigmaTSI, lsmaOffSetTSI, maTypeSignal, smoothingLengthSignal, almaOffsetSignal, almaSigmaSignal, lsmaOffSetSignal)
Parameters:
source
length
shortLengthTSI
longLengthTSI
maTypeTSI
almaOffsetTSI
almaSigmaTSI
lsmaOffSetTSI
maTypeSignal
smoothingLengthSignal
almaOffsetSignal
almaSigmaSignal
lsmaOffSetSignal
smiVROC(length, shortLengthTSI, longLengthTSI, maTypeTSI, almaOffsetTSI, almaSigmaTSI, lsmaOffSetTSI, maTypeSignal, smoothingLengthSignal, almaOffsetSignal, almaSigmaSignal, lsmaOffSetSignal)
Parameters:
length
shortLengthTSI
longLengthTSI
maTypeTSI
almaOffsetTSI
almaSigmaTSI
lsmaOffSetTSI
maTypeSignal
smoothingLengthSignal
almaOffsetSignal
almaSigmaSignal
lsmaOffSetSignal
smiWPR(source, length, shortLengthTSI, longLengthTSI, maTypeTSI, almaOffsetTSI, almaSigmaTSI, lsmaOffSetTSI, maTypeSignal, smoothingLengthSignal, almaOffsetSignal, almaSigmaSignal, lsmaOffSetSignal)
Parameters:
source
length
shortLengthTSI
longLengthTSI
maTypeTSI
almaOffsetTSI
almaSigmaTSI
lsmaOffSetTSI
maTypeSignal
smoothingLengthSignal
almaOffsetSignal
almaSigmaSignal
lsmaOffSetSignal
smiFT(length, shortLengthTSI, longLengthTSI, maTypeTSI, almaOffsetTSI, almaSigmaTSI, lsmaOffSetTSI, maTypeSignal, smoothingLengthSignal, almaOffsetSignal, almaSigmaSignal, lsmaOffSetSignal)
Parameters:
length
shortLengthTSI
longLengthTSI
maTypeTSI
almaOffsetTSI
almaSigmaTSI
lsmaOffSetTSI
maTypeSignal
smoothingLengthSignal
almaOffsetSignal
almaSigmaSignal
lsmaOffSetSignal
smiFT(source, length, shortLengthTSI, longLengthTSI, maTypeTSI, almaOffsetTSI, almaSigmaTSI, lsmaOffSetTSI, maTypeSignal, smoothingLengthSignal, almaOffsetSignal, almaSigmaSignal, lsmaOffSetSignal)
Parameters:
source
length
shortLengthTSI
longLengthTSI
maTypeTSI
almaOffsetTSI
almaSigmaTSI
lsmaOffSetTSI
maTypeSignal
smoothingLengthSignal
almaOffsetSignal
almaSigmaSignal
lsmaOffSetSignal
smiCCI(source, length, maTypeCCI, almaOffsetCCI, almaSigmaCCI, lsmaOffSetCCI, shortLengthTSI, longLengthTSI, maTypeTSI, almaOffsetTSI, almaSigmaTSI, lsmaOffSetTSI, maTypeSignal, smoothingLengthSignal, almaOffsetSignal, almaSigmaSignal, lsmaOffSetSignal)
Parameters:
source
length
maTypeCCI
almaOffsetCCI
almaSigmaCCI
lsmaOffSetCCI
shortLengthTSI
longLengthTSI
maTypeTSI
almaOffsetTSI
almaSigmaTSI
lsmaOffSetTSI
maTypeSignal
smoothingLengthSignal
almaOffsetSignal
almaSigmaSignal
lsmaOffSetSignal
smiUO(fastLength, middleLength, slowLength, shortLengthTSI, longLengthTSI, maTypeTSI, almaOffsetTSI, almaSigmaTSI, lsmaOffSetTSI, maTypeSignal, smoothingLengthSignal, almaOffsetSignal, almaSigmaSignal, lsmaOffSetSignal)
Parameters:
fastLength
middleLength
slowLength
shortLengthTSI
longLengthTSI
maTypeTSI
almaOffsetTSI
almaSigmaTSI
lsmaOffSetTSI
maTypeSignal
smoothingLengthSignal
almaOffsetSignal
almaSigmaSignal
lsmaOffSetSignal
smiMACD(source, fastLength, slowLength, signalLength, maTypeFast, maTypeSlow, maTypeMACD, almaOffset, almaSigma, lsmaOffSet, shortLengthTSI, longLengthTSI, maTypeTSI, almaOffsetTSI, almaSigmaTSI, lsmaOffSetTSI, maTypeSignal, smoothingLengthSignal, almaOffsetSignal, almaSigmaSignal, lsmaOffSetSignal)
Parameters:
source
fastLength
slowLength
signalLength
maTypeFast
maTypeSlow
maTypeMACD
almaOffset
almaSigma
lsmaOffSet
shortLengthTSI
longLengthTSI
maTypeTSI
almaOffsetTSI
almaSigmaTSI
lsmaOffSetTSI
maTypeSignal
smoothingLengthSignal
almaOffsetSignal
almaSigmaSignal
lsmaOffSetSignal
smiVol(shortLengthTSI, longLengthTSI, maTypeTSI, almaOffsetTSI, almaSigmaTSI, lsmaOffSetTSI, maTypeSignal, smoothingLengthSignal, almaOffsetSignal, almaSigmaSignal, lsmaOffSetSignal)
Parameters:
shortLengthTSI
longLengthTSI
maTypeTSI
almaOffsetTSI
almaSigmaTSI
lsmaOffSetTSI
maTypeSignal
smoothingLengthSignal
almaOffsetSignal
almaSigmaSignal
lsmaOffSetSignal
smiMFI(source, length, shortLengthTSI, longLengthTSI, maTypeTSI, almaOffsetTSI, almaSigmaTSI, lsmaOffSetTSI, maTypeSignal, smoothingLengthSignal, almaOffsetSignal, almaSigmaSignal, lsmaOffSetSignal)
Parameters:
source
length
shortLengthTSI
longLengthTSI
maTypeTSI
almaOffsetTSI
almaSigmaTSI
lsmaOffSetTSI
maTypeSignal
smoothingLengthSignal
almaOffsetSignal
almaSigmaSignal
lsmaOffSetSignal
smiCMF(length, shortLengthTSI, longLengthTSI, maTypeTSI, almaOffsetTSI, almaSigmaTSI, lsmaOffSetTSI, maTypeSignal, smoothingLengthSignal, almaOffsetSignal, almaSigmaSignal, lsmaOffSetSignal)
Parameters:
length
shortLengthTSI
longLengthTSI
maTypeTSI
almaOffsetTSI
almaSigmaTSI
lsmaOffSetTSI
maTypeSignal
smoothingLengthSignal
almaOffsetSignal
almaSigmaSignal
lsmaOffSetSignal
smiOBV(source, shortLengthTSI, longLengthTSI, maTypeTSI, almaOffsetTSI, almaSigmaTSI, lsmaOffSetTSI, maTypeSignal, smoothingLengthSignal, almaOffsetSignal, almaSigmaSignal, lsmaOffSetSignal)
Parameters:
source
shortLengthTSI
longLengthTSI
maTypeTSI
almaOffsetTSI
almaSigmaTSI
lsmaOffSetTSI
maTypeSignal
smoothingLengthSignal
almaOffsetSignal
almaSigmaSignal
lsmaOffSetSignal
smiPVT(source, shortLengthTSI, longLengthTSI, maTypeTSI, almaOffsetTSI, almaSigmaTSI, lsmaOffSetTSI, maTypeSignal, smoothingLengthSignal, almaOffsetSignal, almaSigmaSignal, lsmaOffSetSignal)
Parameters:
source
shortLengthTSI
longLengthTSI
maTypeTSI
almaOffsetTSI
almaSigmaTSI
lsmaOffSetTSI
maTypeSignal
smoothingLengthSignal
almaOffsetSignal
almaSigmaSignal
lsmaOffSetSignal
smiVO(shortLen, longLen, maType, almaOffset, almaSigma, lsmaOffSet, shortLengthTSI, longLengthTSI, maTypeTSI, almaOffsetTSI, almaSigmaTSI, lsmaOffSetTSI, maTypeSignal, smoothingLengthSignal, almaOffsetSignal, almaSigmaSignal, lsmaOffSetSignal)
Parameters:
shortLen
longLen
maType
almaOffset
almaSigma
lsmaOffSet
shortLengthTSI
longLengthTSI
maTypeTSI
almaOffsetTSI
almaSigmaTSI
lsmaOffSetTSI
maTypeSignal
smoothingLengthSignal
almaOffsetSignal
almaSigmaSignal
lsmaOffSetSignal
smiPVI(source, shortLengthTSI, longLengthTSI, maTypeTSI, almaOffsetTSI, almaSigmaTSI, lsmaOffSetTSI, maTypeSignal, smoothingLengthSignal, almaOffsetSignal, almaSigmaSignal, lsmaOffSetSignal)
Parameters:
source
shortLengthTSI
longLengthTSI
maTypeTSI
almaOffsetTSI
almaSigmaTSI
lsmaOffSetTSI
maTypeSignal
smoothingLengthSignal
almaOffsetSignal
almaSigmaSignal
lsmaOffSetSignal
smiNVI(source, shortLengthTSI, longLengthTSI, maTypeTSI, almaOffsetTSI, almaSigmaTSI, lsmaOffSetTSI, maTypeSignal, smoothingLengthSignal, almaOffsetSignal, almaSigmaSignal, lsmaOffSetSignal)
Parameters:
source
shortLengthTSI
longLengthTSI
maTypeTSI
almaOffsetTSI
almaSigmaTSI
lsmaOffSetTSI
maTypeSignal
smoothingLengthSignal
almaOffsetSignal
almaSigmaSignal
lsmaOffSetSignal
rsiVolume(length)
Parameters:
length
rsiMA(sourceMA, lengthMA, maType, almaOffset, almaSigma, lsmaOffSet, lengthRSI)
Parameters:
sourceMA
lengthMA
maType
almaOffset
almaSigma
lsmaOffSet
lengthRSI

ATR-Stepped, Another New Adaptive Moving Average [Loxx]ATR-Filtered, Another New Adaptive Moving Average is a modification of @cheatcountry's "Another New Adaptive Moving Average " shown below
I've added AT- stepped filtering. This is a standard ATR filter that works by requiring movement by XX multiple of ATR before registering a trend flip. I've also included Loxx's Expanded Source Types. You can read about those here:
From @cheatcountry on A New Adaptive Moving Average
The New Adaptive Moving Average was created by Scott Cong (Stocks and Commodities Mar 2023) and this is a companion indicator to my previous script
This indicator still works off of the same concept as before with effort vs results but this indicator takes a slightly different approach and instead defines results as the absolute difference between the closing price and a closing price x bars ago. As you can see in my chart example, this indicator works great to stay with the current trend and provides either a stop loss or take profit target depending on which direction you are going in. As always, I use darker colors to show stronger signals and lighter colors to show normal signals. Buy when the line turns green and sell when it turns red.
Included
Alerts
Signals
Loxx's Expanded Source Types
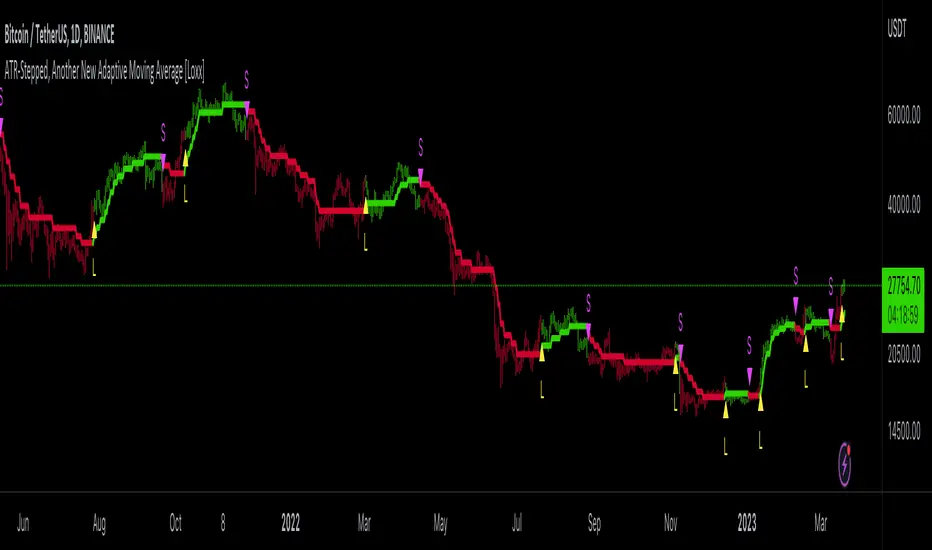
Hikkake Hunter 2.0This script serves as a successor to a previous script I wrote for identifying Hikkakes nearly two years ago.
The old version has been preserved here:
█ OVERVIEW
This script is a rework of an old script that identified the Hikkake candlestick pattern. While this pattern is not usually considered a part of the standard candlestick patterns set, I found a lot of value when finding a solution to identifying it. A Hikkake pattern is a 3-candle pattern where a middle candle is nested in between the range of the prior candle, and a candle that follows has a higher high and a higher low (bearish setup) or a lower high and a lower low (bullish setup). What makes this pattern unique is the "confirmation" status of the pattern; within 3 candles of this pattern's appearance, there must be a candle that closes above the high (bullish setup) or below the low (bearish setup) of the second candle. Additional flexibility has been added which allows the user to specify the number of candles (up to 5) that the pattern may have to confirm after its appearance.
█ CONCEPTS
This script will cover concepts mainly focusing on candlestick analysis, price analysis (with higher timeframes), and statistical analysis. I believe there is also educational value presented with the use of user-defined-types (UDTs) in accomplishing these concepts that I hope others will find useful.
Candlestick Analysis - Identification and confirmation of the patterns in the deprecated script were clunky and inefficient. While the previous script required the use of 6 candles to perform the confirmations of patterns (restricted solely to identifying patterns that confirmed in 3 candles or less), this script only requires 3 candles to identify and process patterns by utilizing a UDT representing a 'pattern object'. An object representing a pattern will be created when it has been identified, and fields within that object will be set for processing by the functions it is passed to. Pattern objects are held by a var array (values within the array persist between bars) and will be removed from this array once they have been confirmed or non-confirmed.
This is a significant deviation from the previous script's methods, as it prevents unnecessary re-evaluations of the confirmation status of patterns (i.e. Hikkakes confirmed on the first candle will no longer need to be checked for confirmations on the second or third; a pitfall of the deprecated version which required multiple booleans tracking prior confirmation statuses). This deviation is also what provides the flexibility in changing the number of candles that can pass before a pattern is deemed non-confirmed.
As multiple patterns can be confirmed simultaneously, this script uses another UDT representing a linked-list reduction of the pattern object used to process it. This liked-list object will then be used for Price Analysis.
Price Analysis - This script employs the use of a UDT which contains all the returns of confirmed patterns. The user specifies how many candles ahead of the confirmed pattern to calculate its return, as well as where this calculation begins. There are two settings: FROM APPEARANCE and FROM CONFIRMATION (default). Price differences are calculated from the open of the candle immediately following the candle which had confirmed the pattern to the close of the candle X candles ahead (default 10). ( SEE FEATURES )
Because of how Pine functions, this calculation necessitates a lookback on prior candles to identify when a pattern had been confirmed. This is accomplished with the following pseudo-code:
if not na(confirmed linked-list )
for all confirmed in list
GET MATRIX PLACEMENT
offset = FROM CONFIRMATION ? 0 : # of candles to confirm
openAtFind = open
percent return = ((close - openAtFind) / openAtFind) * 100
ADD percent return TO UDT IN MATRIX
All return UDTs are held in a matrix which breaks up these patterns into specific groups covered in the next section.
Higher Timeframes - This script makes a request.security call to a higher timeframe in order to identify a price range which breaks up these patterns into groups based on the 'partition' they had appeared in. The default values for this partitioning will break up the chart into three sections: upper, middle, and lower. The upper section represents the highest 20% of the yearly trading range that an asset has experienced. The lower section represents the trading range within a third (33%) of the yearly low. And the middle section represents the yearly high-low range between these two partitions.
The matrix containing all return UDTs will have these returns split up based on the number of candles required to confirm the pattern as well as the partition the pattern had appeared in. The underlying rationale is that patterns may perform better or worse at different parts of an asset's trading range.
Statistical Analysis - Once a pattern has been confirmed, the matrix containing all return UDTs will be queried to check if a 'returnArray' object has been created for that specific pattern. If not, one will be initialized and a confirmed linked-list object will be created that contains information pertinent to the matrix position of this object.
This matrix contains the returns of both the Bullish and Bearish Hikkake patterns, separated by the number of candles needed to confirm them, and by the partitions they had appeared in. For the standard 3 candles to confirm, this means the matrix will contain 18 elements (dependent on the number of candles allowed for confirmations; its size will range from 12 to 30).
When the required number of candles for Price Analysis passes, a percent return is calculated and added to the returnArray contained in the matrix at the location derived from the confirmed linked-list object's values. The return is added, and all values in the returnArray are updated using Pine's built in array.___ functions. This returnArray object contains the array of all returns, its size, its average, the median, the standard deviation of returns, and a separate 3-integer array which holds values that correspond to the types of returns experienced by this pattern (negative, neutral, and positive)*.
After a pattern has been confirmed, this script will place the partition and all of the aforementioned stats values (plus a 95% confidence interval of expected returns) related to that pattern onto the tooltip of the label that identifies it. This allows users to scroll over the label of a confirmed pattern to gauge its prior performance under specific conditions. The percent return of the specific pattern identified will later be placed onto the label tooltip as well. ( SEE LIMITATIONS )
The stats portion of this script also plays a significant role in how patterns are presented when using the Adaptive Coloring mode described in FEATURES .
*These values are incremented based on user-input related to what constitutes a 'negative' or 'positive' return. Default values would place any return by a pattern between -3% and 3% in the 'neutral' category, and values exceeding either end will be placed in the 'negative' or 'positive' categories.
█ FEATURES
This script contains numerous inputs for modifying its behavior and how patterns are presented/processed, separated into 5 groups.
Confirmation Setting - The most important input for this script's functioning. This input is a 'confirm=true' input and must be set by the user before the script is applied to the chart. It sets the number of candles that a pattern has to confirm once it has been identified.
Alert Settings - This group of booleans sets which types of alerts will fire during the scripts execution on the chart. If enabled, the four alerts will trigger when: a pattern has been identified, a pattern has been confirmed, a pattern has been non-confirmed, and show the return for that confirmed pattern in an alert. Because this script uses the 'alert' function and not 'alertcondition', these must be enabled before 'any alert() function call' is set in TradingView's 'alerts' settings.
Partition Settings - This group of inputs are responsible for creating (and viewing) the partitions that breaks the returns of the patterns identified up into their respective groups. The user may set the resolution to grab the range from, the length back of this resolution the partitions get their values from, the thresholds which breaks the partitions up into their groups, and modify the visibility (if they're shown, the colors, opacity) of these partitions.
Stats Settings - These inputs will drastically alter how patterns are presented and the resulting information derived from them after their appearance. Because of this section's importance, some of these inputs will be described in more detail.
P/L Sample Length - Defines the number of candles after the starting point to grab values from in the % return calculation for that pattern.
P/L Starting Point - Defines the starting point where the P/L calculation will take place. 'FROM APPEARANCE' will set the starting point at the candle immediately following the pattern's appearance. 'FROM CONFIRMATION' will place the starting point immediately following the candle which had confirmed the pattern. ( SEE LIMITATIONS )
Min Returns Needed - Sets how many times a specific pattern must appear (both by number of candles needed to confirm and by partition) before the statistics for that pattern are displayed onto the tooltip (and for gradient coloration in Adaptive Coloring mode).
Enable Adaptive Coloring - Changes the coloration of the patterns based on the bullish/bearishness of the specified Gradient Reference value of that pattern compared to the Return Tolerance values OR the minimum and maximum values of that specified Gradient Reference value contained in the matrix of all returns. This creates a color from a gradient using the user-specified colors and alters how many of the patterns may appear if prior performance is taken into account.
Gradient Reference - Defines which stats measure of returns will be used in the gradient color generation. The two settings are 'AVG' and 'MEDIAN'.
Hard Limit - This boolean sets whether the Return Tolerance values will not be replaced by values that exceed them from the matrix of returns in color gradient generation. This changes the scale of the gradient where any Gradient Reference values of patterns that exceed these tolerances will be colored the full bullish or bearish gradient colors, and anything in between them will be given a color from the gradient.
Visibility Settings - This last section includes all settings associated with the overall visibility of patterns found with this script. This includes the position of the labels and their colors (+ pattern colors without Adaptive Coloring being enabled), and showing patterns that were non-confirmed.
Most of these inputs in the script have these kinds of descriptions to what they do provided by their tooltips.
█ HOW TO USE
I attempted to make this script much easier to use in terms of analyzing the patterns and displaying the information to the user. The previous script would have the user go to the 'data window' side bar on TradingView to view the returns of a pattern after they had specified which pattern to analyze through the settings, needlessly convoluted. This aim at simplicity was achieved through the use of UDTs and specific code-design.
To use, simply apply the indicator to a chart, set the number of candles (between 2 and 5) for confirming this specific pattern and adjust the many settings described above at your leisure.
█ LIMITATIONS
Disclaimer - This is a tool created with the hopes of helping identify a specific pattern and provide an informative view about the performance of that pattern. Previous performance is not indicative of future results. None of this constitutes any form of financial advice, *use at your own risk*.
Statistical Analysis - This script assumes that all patterns will yield a NORMAL DISTRIBUTION regarding their returns which may not be reflective of reality. I personally have limited experience within the field of statistics apart from a few high school/college courses and make no guarantees that the calculation of the 95% confidence interval is correct. Please review the source code to verify for yourself that this interval calculation is correct (Function Name: f_DisplayStatsOnLabel).
P/L Starting Point - Because of when the object related to the confirmation status of a pattern is created (specifically the linked-list object) setting the 'P/L Starting Point' to 'FROM APPEARANCE' will yield the results of that P/L calculation at the same time as 'FROM CONFIRMATION'.
█ EXAMPLES
Default Settings:
Partition Background (default):
Partition Background (Resolution D : Length 30):
Adaptive Coloration:
Show Non-Confirmed:

Extended Price Volume Trend Strategy : EducationalThe Extended Price Volume Trend (EPVT) is a technical indicator that is used to identify potential trend changes and measure the strength of a trend. In this strategy, we combine the EPVT with other indicators to create a trading system that aims to capture trend reversals and momentum shifts.
The EPVT indicator is calculated by taking the cumulative volume and multiplying it by the percentage change in price. We then find the highest and lowest values of this indicator over a certain period of time to determine the baseline. The difference between the EPVT and the baseline is then plotted on a chart to create the EPVT line.
To use this indicator for trading, we look for crossovers of the EPVT line with zero. When the EPVT crosses above zero, it indicates that buying pressure is increasing, and we may consider taking a long position. Conversely, when the EPVT crosses below zero, it indicates that selling pressure is increasing, and we may consider taking a short position.
To further refine our trading signals, we use three take-profit levels, which we set as a percentage of the current EPVT value. We also use a simple moving average to provide additional confirmation of trend changes.
In summary, the EPVT trading strategy is a technical analysis-based approach to trading that aims to identify potential trend reversals and momentum shifts. By combining the EPVT indicator with other technical tools, we can create a comprehensive trading system that provides clear entry and exit signals for both long and short positions. Please note that this strategy is for educational purposes only and should not be taken as financial advice.

Trend Line Trendlines are easily recognizable lines that traders draw on charts to connect a series of prices together or show some data's best fit. The resulting line is then used to give the trader a good idea of the direction in which an investment's value might move.
A trendline is a line drawn over pivot highs or under pivot lows to show the prevailing direction of price. Trendlines are a visual representation of support and resistance in any time frame. They show direction and speed of price, and also describe patterns during periods of price contraction.
Key Takeaways
Trendlines indicate the best fit of some data using a single line.
A single trendline can be applied to a chart to give a clearer picture of the trend.
The time period being analyzed and the exact points used to create a trendline vary from trader to trader.
The trendline is among the most important tools used by technical analysts. Instead of looking at past business performance or other fundamentals, technical analysts look for trends in price action. A trendline helps technical analysts determine the current direction in market prices. Technical analysts believe the trend is your friend, and identifying this trend is the first step in the process of making a good trade.
To create a trendline, an analyst must have at least two points on a price chart. Some analysts like to use different time frames such as one minute or five minutes. Others look at daily charts or weekly charts. Some analysts put aside time altogether, choosing to view trends based on tick intervals rather than intervals of time. What makes trendlines so universal in usage and appeal is they can be used to help identify trends regardless of the time period, time frame or interval used.

Previous Levels With Custom TimeZoneThe Previous Levels With Custom TimeZone indicator shows to users specifics price area which can be liquidity to take.
Users can determine the desired time zone to retrieve the correct daily, weekly and monthly values.
Several price area are shown with with indicator which are :
Daily Open Price
Daily Low Price
Daily High Price
Previous Daily Low Price
Previous Daily High Price
Previous Weekly Low Price
Previous Weekly High Price
Previous Monthly Low Price
Previous Monthly High Price
All price area are configurable to let user have specific color or line style for each area.
Here's some example :
Daily Open / High / Low
Previous Daily High / Low
Previous Weekly High / Low
Previous Monthly High / Low
[JL] Fractals ATR BlockI decided to combine Fractal ROC , ATR Break, and Order Blocks to an Indicator
The Fractal ROC , ATR Break, and Order Blocks indicator combines three concepts to help traders identify potential trade opportunities and manage risk. By using a combination of Fractal ROC , ATR Break, and Order Blocks, traders can gain a deeper understanding of market dynamics and make more informed trading decisions.
Fractal ROC is a momentum-based indicator that calculates the rate of change of the price between fractals, which are turning points in the market. It is calculated by taking the difference between the closing price and the lowest price in the previous n+1 periods, and dividing it by the difference between the open price 2n periods ago and the lowest price in the previous n+1 periods. This calculation is done for both up and down fractals. When the Fractal ROC value is greater than the ROC Break Level (as determined by the input variable roclevel), it indicates a potential momentum shift in the market. This can be used to identify potential trade entries or exits, depending on your trading strategy.
ATR Break is an indicator that helps traders identify significant price movements in the market. It measures the distance between the price and the Average True Range (ATR), which is a measure of the volatility of the market. ATR Break is calculated by taking the difference between the close and high/low, and dividing it by the previous ATR value. This calculation is done for both up and down movements. When the ATR Break value is greater than the ATR Break Level (as determined by the input variable atrlevel), it indicates a significant move in the market. This can be used to identify potential breakouts or breakdowns, and can be used to set stop-loss and take-profit levels.
An Order Block is a price level where significant buying or selling activity has taken place. The order blocks made by ATR Break and Fractal ROC are drawn using boxes on the chart. When the ATR or Fractal ROC level is breached, a box is drawn with the high and low of the candle that breached the level as the top and bottom of the box, respectively. The box is then extended to the right until the end of the chart or until another ATR or Fractal ROC level is breached, at which point a new box is drawn. This allows traders to easily identify significant price movements and potential support and resistance levels on the chart. When an Order Block is identified, it can be used as a potential support or resistance level . If price approaches an Order Block from below, it is likely to bounce off this level and continue in an upward direction. Similarly, if price approaches an Order Block from above, it is likely to bounce off this level and continue in a downward direction. Traders can use these levels to identify potential trade entries or exits, as well as to set stop-loss and take-profit levels.
Overall, the Fractal ROC , ATR Break, and Order Blocks indicator is a powerful tool for traders who want to identify potential trade opportunities and manage risk. By combining these three concepts, traders can gain a deeper understanding of market dynamics and make more informed trading decisions. As with any indicator, it is important to use it in conjunction with other analysis tools and to have a clear trading plan in place.

Futures All List Candle Analysis - FALCAIn this command; There is an alphabetical list of USDS-M coins with the USDT PERP extension on the Binance Futures side.
There are 13 lists in total. Each list contains 39 data. Due to data limitation, 13 lists are formed. There are 13 coins in the first 11 of the lists. The 12th list contains 3 coins. The last list (FAVORITE LIST) is CRYPTOCAP:TOTAL, BINANCE:BTCUSDTPERP, BINANCE:BTCDOMUSDTPERP as standard. You must add 10 coins to the final list.
The lists show data for the time period you selected.
Explanation of the (C/H) header: Close /High takes a maximum value of 1. As long as this value is 1, a price increase is observed.
Explanation of the (C/O) header:
Close /Open can be greater than ,1. In this case, a price increase is observed.
Close /Open can be less than 1. In this case, a price decrease is observed.
The value Close /Open can be equal to 1. In this case, price stability is observed.
Explanation of the (C/L) header: Close /Low takes a minimum value of 1. As long as this value is 1, a price decrease is observed.
Coins with a price decrease are shown in red.
Coins with a price increase will turn green.
***NOTE: For this command to work, you must first add 10 favorite coins to the "FAVORITE LIST".
Another New Adaptive Moving Average [CC]The New Adaptive Moving Average was created by Scott Cong (Stocks and Commodities Mar 2023) and this is a companion indicator to my previous script . This indicator still works off of the same concept as before with effort vs results but this indicator takes a slightly different approach and instead defines results as the absolute difference between the closing price and a closing price x bars ago. As you can see in my chart example, this indicator works great to stay with the current trend and provides either a stop loss or take profit target depending on which direction you are going in. As always, I use darker colors to show stronger signals and lighter colors to show normal signals. Buy when the line turns green and sell when it turns red.
Let me know if there are any other indicator scripts you would like to see me publish!
