Antares_messages_publicLibrary "Antares_messages_public"
This library add messages for yours strategy for use in Antares trading system for binance and bybit exchanges.
Данная библиотека позволяет формировать сообщения в алертах стратегий для Antares в более упрощенном для пользователя режиме, включая всплывающие подсказки и т.д.
set_leverage(token, market, ticker_id, leverage)
Set leverage for ticker on specified market.
Parameters:
token (string) : (integer or 0) token for trade in system, if = 0 then token part mess is empty. Токен, При значениb = 0 не включается в формирование строки алерта.
market (string) : (string) Spot 'binance' , 'bybit' . Futures ('binancefru','binancefro','bybitfu', 'bybitfi'). Строковая переменная названия биржи.
ticker_id (string) : (string) ticker in market ('btcusdt', 'ethusdt' etc...). Строковая переменная названия тикера (пары).
leverage (float) : (float) leverage level. Устанавливаемое плечо.
Returns: 'Set leverage message'.
pause(time_pause)
Set pause in message. '::' -left and '::' -right included.
Parameters:
time_pause (int)
LongLimit(token, market, ticker_id, type_qty, quantity, price, orderId, leverageforqty)
Buy order with limit price and quantity.
Лимитный ордер на покупку(в лонг).
Parameters:
token (string) : (integer or 0) token for trade in system, if = 0 then token part mess is empty. Токен, При значениb = 0 не включается в формирование строки алерта.
market (string) : (string) Spot 'binance' , 'bybit' . Futures ('binancefru','binancefro','bybitfu', 'bybitfi'). Строковая переменная названия биржи.
ticker_id (string) : (string) ticker in market ('btcusdt', 'ethusdt' etc...). Строковая переменная названия тикера (пары).
type_qty (string) : (string) type of quantity: 1. 'qty' or '' or na - standart (in coins), 2. 'quqty'- in assets (usdt,btc,etc..), 3.open% - open position(futures) or buy (spot) in % of base 4. close% - close in % of position (futures) or sell (spot) coins in % for current quantity
quantity (float) : (float) orders size, see at 'type_qty'. Размер ордера, базы или % в соответствии с 'type_qty'
price (float) : (float) price for limit order. Цена по которой должен быть установлен лимитный ордер.
orderId (string) : (string) if use order id you may change or cancel your order after or set it ''. Используйте OrderId если хотите изменить или отменить ордер в будущем.
leverageforqty (bool) : (bool) use leverage in qty. Использовать плечо при расчете количества или нет.
Returns: 'Limit Buy order'. Лимитный ордер на покупку (лонг).
LongMarket(token, market, ticker_id, type_qty, quantity, leverageforqty)
Market Buy order with quantity.
Рыночный ордер на покупку (в лонг).
Parameters:
token (string) : (integer or 0) token for trade in system, if = 0 then token part mess is empty. Токен, При значениb = 0 не включается в формирование строки алерта.
market (string) : (string) Spot 'binance' , 'bybit' . Futures ('binancefru','binancefro','bybitfu', 'bybitfi'). Строковая переменная названия биржи.
ticker_id (string) : (string) ticker in market ('btcusdt', 'ethusdt' etc...). Строковая переменная названия тикера (пары).
type_qty (string) : (string) type of quantity: 1. 'qty' or '' or na - standart (in coins), 2. 'quqty'- in assets (usdt,btc,etc..), 3.open% - open position(futures) or buy (spot) in % of base 4. close% - close in % of position (futures) or sell (spot) coins in % for current quantity
quantity (float) : (float) orders size, see at 'type_qty'. Размер ордера, базы или % в соответствии с 'type_qty'
leverageforqty (int) : (bool) use leverage in qty. Использовать плечо при расчете количества или нет.
Returns: 'Market Buy order'. Маркетный ордер на покупку (лонг).
ShortLimit(token, market, ticker_id, type_qty, quantity, price, leverageforqty, orderId)
Sell order with limit price and quantity.
Лимитный ордер на продажу(в шорт).
Parameters:
token (string) : (integer or 0) token for trade in system, if = 0 then token part mess is empty. Токен, При значениb = 0 не включается в формирование строки алерта.
market (string) : (string) Spot 'binance' , 'bybit' . Futures ('binancefru','binancefro','bybitfu', 'bybitfi'). Строковая переменная названия биржи.
ticker_id (string) : (string) ticker in market ('btcusdt', 'ethusdt' etc...). Строковая переменная названия тикера (пары).
type_qty (string) : (string) type of quantity: 1. 'qty' or '' or na - standart (in coins), 2. 'quqty'- in assets (usdt,btc,etc..), 3.open% - open position(futures) or buy (spot) in % of base 4. close% - close in % of position (futures) or sell (spot) coins in % for current quantity
quantity (float) : (float) orders size, see at 'type_qty'. Размер ордера, базы или % в соответствии с 'type_qty'
price (float) : (float) price for limit order. Цена по которой должен быть установлен лимитный ордер.
leverageforqty (bool) : (bool) use leverage in qty. Использовать плечо при расчете количества или нет.
orderId (string) : (string) if use order id you may change or cancel your order after or set it ''. Используйте OrderId если хотите изменить или отменить ордер в будущем.
Returns: 'Limit Sell order'. Лимитный ордер на продажу (шорт).
ShortMarket(token, market, ticker_id, type_qty, quantity, leverageforqty)
Sell by market price and quantity.
Рыночный ордер на продажу(в шорт).
Parameters:
token (string) : (integer or 0) token for trade in system, if = 0 then token part mess is empty. Токен, При значениb = 0 не включается в формирование строки алерта.
market (string) : (string) Spot 'binance' , 'bybit' . Futures ('binancefru','binancefro','bybitfu', 'bybitfi'). Строковая переменная названия биржи.
ticker_id (string) : (string) ticker in market ('btcusdt', 'ethusdt' etc...). Строковая переменная названия тикера (пары).
type_qty (string) : (string) type of quantity: 1. 'qty' or '' or na - standart (in coins), 2. 'quqty'- in assets (usdt,btc,etc..), 3.open% - open position(futures) or buy (spot) in % of base 4. close% - close in % of position (futures) or sell (spot) coins in % for current quantity
quantity (float) : (float) orders size, see at 'type_qty'. Размер ордера, базы или % в соответствии с 'type_qty'
leverageforqty (int) : (bool) use leverage in qty. Использовать плечо при расчете количества или нет.
Returns: 'Market Sell order'. Маркетный ордер на продажу (шорт).
Cancel_by_ticker(token, market, ticker_id)
Cancel all orders for market and ticker in setups. Отменяет все ордера на заданной бирже и заданном токене(паре).
Parameters:
token (string)
market (string) : (string) Spot 'binance' , 'bybit' . Futures ('binancefru','binancefro','bybitfu', 'bybitfi'). Строковая переменная названия биржи.
ticker_id (string) : (string) ticker in market ('btcusdt', 'ethusdt' etc...). Строковая переменная названия тикера (пары).
Returns: 'Cancel all orders'. Отмена всех ордеров на заданной бирже и заданном токене(паре).
Cancel_by_id(token, market, ticker_id, orderId)
Cancel order by Id for market and ticker in setups. Отменяет ордер по Id на заданной бирже и заданном токене(паре).
Parameters:
token (string)
market (string) : (string) Spot 'binance' , 'bybit' . Futures ('binancefru','binancefro','bybitfu', 'bybitfi'). Строковая переменная названия биржи.
ticker_id (string) : (string) ticker in market ('btcusdt', 'ethusdt' etc...). Строковая переменная названия тикера (пары).
orderId (string)
Returns: 'Cancel order'. Отмена ордера по Id на заданной бирже и заданном токене(паре).
Close_positions(token, market, ticker_id)
Close all positions for market and ticker in setups. Закрывает все позиции на заданной бирже и заданном токене(паре).
Parameters:
token (string)
market (string) : (string) Spot 'binance' , 'bybit' . Futures ('binancefru','binancefro','bybitfu', 'bybitfi'). Строковая переменная названия биржи.
ticker_id (string) : (string) ticker in market ('btcusdt', 'ethusdt' etc...). Строковая переменная названия тикера (пары).
Returns: 'Close positions'
CloseLongLimit(token, market, ticker_id, type_qty, quantity, price, orderId, leverageforqty)
Close limit order for long position. (futures)
Лимитный ордер на продажу(в шорт) для закрытия лонговой позиции(reduceonly).
Parameters:
token (string) : (integer or 0) token for trade in system, if = 0 then token part mess is empty. Токен, При значениb = 0 не включается в формирование строки алерта.
market (string) : (string) Spot 'binance' , 'bybit' . Futures ('binancefru','binancefro','bybitfu', 'bybitfi'). Строковая переменная названия биржи.
ticker_id (string) : (string) ticker in market ('btcusdt', 'ethusdt' etc...). Строковая переменная названия тикера (пары).
type_qty (string) : (string) type of quantity: 1. 'qty' or '' or na - standart (in coins), 2. 'quqty'- in assets (usdt,btc,etc..), 3.open% - open position(futures) or buy (spot) in % of base 4. close% - close in % of position (futures) or sell (spot) coins in % for current quantity
quantity (float) : (float) orders size, see at 'type_qty'. Размер ордера, базы или % в соответствии с 'type_qty'
price (float) : (float) price for limit order. Цена по которой должен быть установлен лимитный ордер.
orderId (string) : (string) if use order id you may change or cancel your order after or set it ''. Используйте OrderId если хотите изменить или отменить ордер в будущем.
leverageforqty (bool) : (bool) use leverage in qty. Использовать плечо при расчете количества или нет.
Returns: 'Limit Sell order reduce only (close long position)'. Лимитный ордер на продажу для снижения текущего лонга(в шорт не входит).
CloseLongMarket(token, market, ticker_id, type_qty, quantity, leverageforqty)
Close market order for long position.
Рыночный ордер на продажу(в шорт) для закрытия лонговой позиции(reduceonly).
Parameters:
token (string) : (integer or 0) token for trade in system, if = 0 then token part mess is empty. Токен, При значениb = 0 не включается в формирование строки алерта.
market (string) : (string) Spot 'binance' , 'bybit' . Futures ('binancefru','binancefro','bybitfu', 'bybitfi'). Строковая переменная названия биржи.
ticker_id (string) : (string) ticker in market ('btcusdt', 'ethusdt' etc...). Строковая переменная названия тикера (пары).
type_qty (string) : (string) type of quantity: 1. 'qty' or '' or na - standart (in coins), 2. 'quqty'- in assets (usdt,btc,etc..), 3.open% - open position(futures) or buy (spot) in % of base 4. close% - close in % of position (futures) or sell (spot) coins in % for current quantity
quantity (float) : (float) orders size, see at 'type_qty'. Размер ордера, базы или % в соответствии с 'type_qty'
leverageforqty (bool) : (bool) use leverage in qty. Использовать плечо при расчете количества или нет.
Returns: 'Market Sell order reduce only (close long position)'. Ордер на снижение/закрытие текущего лонга(в шорт не входит) по рыночной цене.
CloseShortLimit(token, market, ticker_id, type_qty, quantity, price, orderId, leverageforqty)
Close limit order for short position.
Лимитный ордер на покупку(в лонг) для закрытия шортовой позиции(reduceonly).
Parameters:
token (string) : (integer or 0) token for trade in system, if = 0 then token part mess is empty. Токен, При значениb = 0 не включается в формирование строки алерта.
market (string) : (string) Spot 'binance' , 'bybit' . Futures ('binancefru','binancefro','bybitfu', 'bybitfi'). Строковая переменная названия биржи.
ticker_id (string) : (string) ticker in market ('btcusdt', 'ethusdt' etc...). Строковая переменная названия тикера (пары).
type_qty (string) : (string) type of quantity: 1. 'qty' or '' or na - standart (in coins), 2. 'quqty'- in assets (usdt,btc,etc..), 3.open% - open position(futures) or buy (spot) in % of base 4. close% - close in % of position (futures) or sell (spot) coins in % for current quantity
quantity (float) : (float) orders size, see at 'type_qty'. Размер ордера, базы или % в соответствии с 'type_qty'
price (float) : (float) price for limit order. Цена по которой должен быть установлен лимитный ордер.
orderId (string) : (string) if use order id you may change or cancel your order after or set it ''. Используйте OrderId если хотите изменить или отменить ордер в будущем.
leverageforqty (bool) : (bool) use leverage in qty. Использовать плечо при расчете количества или нет.
Returns: 'Limit Buy order reduce only (close short position)' . Лимитный ордер на покупку (лонг) для сокращения/закрытия текущего шорта.
CloseShortMarket(token, market, ticker_id, type_qty, quantity, leverageforqty)
Set Close limit order for long position.
Рыночный ордер на покупку(в лонг) для сокращения/закрытия шортовой позиции(reduceonly).
Parameters:
token (string) : (integer or 0) token for trade in system, if = 0 then token part mess is empty. Токен, При значениb = 0 не включается в формирование строки алерта.
market (string) : (string) Spot 'binance' , 'bybit' . Futures ('binancefru','binancefro','bybitfu', 'bybitfi'). Строковая переменная названия биржи.
ticker_id (string) : (string) ticker in market ('btcusdt', 'ethusdt' etc...). Строковая переменная названия тикера (пары).
type_qty (string) : (string) type of quantity: 1. 'qty' or '' or na - standart (in coins), 2. 'quqty'- in assets (usdt,btc,etc..), 3.open% - open position(futures) or buy (spot) in % of base 4. close% - close in % of position (futures) or sell (spot) coins in % for current quantity
quantity (float) : (float) orders size, see at 'type_qty'. Размер ордера, базы или % в соответствии с 'type_qty'
leverageforqty (bool) : (bool) use leverage in qty. Использовать плечо при расчете количества или нет.
Returns: 'Market Buy order reduce only (close short position)'. Маркетного ордера на покупку (лонг) для сокращения/закрытия текущего шорта.
cancel_all_close(token, market, ticker_id)
Parameters:
token (string)
market (string)
ticker_id (string)
limit_tpsl_bybitfu(token, ticker_id, order_id, side, type_qty, quantity, price, tp_price, sl_price, leverageforqty)
Set multi order for Bybit : limit + takeprofit + stoploss
Выставление тройного ордера на Bybit лимитка со стоплоссом и тейкпрофитом
Parameters:
token (string) : (integer or 0) token for trade in system, if = 0 then token part mess is empty. Токен, При значениb = 0 не включается в формирование строки алерта.
ticker_id (string) : (string) ticker in market ('btcusdt', 'ethusdt' etc...). Строковая переменная названия тикера (пары).
order_id (string)
side (bool) : (bool) "buy side" if true or "sell side" if false. true для лонга, false для шорта.
type_qty (string) : (string) type of quantity: 1. 'qty' or '' or na - standart (in coins), 2. 'quqty'- in assets (usdt,btc,etc..), 3.open% - open position(futures) or buy (spot) in % of base 4. close% - close in % of position (futures) or sell (spot) coins in % for current quantity
quantity (float) : (float) orders size, see at 'type_qty'. Размер ордера, базы или % в соответствии с 'type_qty'
price (float) : (float) price for limit order by 'side'. Цена лимитного ордера
tp_price (float) : (float) price for take profit order.
sl_price (float) : (float) price for stoploss order
leverageforqty (bool) : (bool) use leverage in qty. Использовать плечо при расчете количества или нет.
Returns: Set multi order for Bybit : limit + takeprofit + stoploss.
replace_limit_tpsl_bybitfu(token, ticker_id, order_id, side, type_qty, quantity, price, tp_price, sl_price, leverageforqty)
Change multi order for Bybit : limit + takeprofit + stoploss
Изменение тройного ордера на Bybit лимитка со стоплоссом и тейкпрофитом
Parameters:
token (string) : (integer or 0) token for trade in system, if = 0 then token part mess is empty. Токен, При значениb = 0 не включается в формирование строки алерта.
ticker_id (string) : (string) ticker in market ('btcusdt', 'ethusdt' etc...). Строковая переменная названия тикера (пары).
order_id (string)
side (bool) : (bool) "buy side" if true or "sell side" if false. true для лонга, false для шорта.
type_qty (string) : (string) type of quantity: 1. 'qty' or '' or na - standart (in coins), 2. 'quqty'- in assets (usdt,btc,etc..), 3.open% - open position(futures) or buy (spot) in % of base 4. close% - close in % of position (futures) or sell (spot) coins in % for current quantity
quantity (float) : (float) orders size, see at 'type_qty'. Размер ордера, базы или % в соответствии с 'type_qty'
price (float) : (float) price for limit order by 'side'. Цена лимитного ордера
tp_price (float) : (float) price for take profit order.
sl_price (float) : (float) price for stoploss order
leverageforqty (bool) : (bool) use leverage in qty. Использовать плечо при расчете количества или нет.
Returns: Set multi order for Bybit : limit + takeprofit + stoploss.
long_stop(token, market, ticker_id, type_qty, quantity, l_stop, leverageforqty)
Stop market order for long position
Рыночный стоп-ордер на продажу для закрытия лонговой позиции.
Parameters:
token (string)
market (string) : (string) 'binance' , 'binancefru' etc.. Строковая переменная названия биржи.
ticker_id (string) : (string) ticker in market ('btcusdt', 'ethusdt' etc...). Строковая переменная названия тикера (пары).
type_qty (string) : (string) type of quantity: 1. 'qty' or '' or na - standart (in coins), 2. 'quqty'- in assets (usdt,btc,etc..), 3.open% - open position(futures) or buy (spot) in % of base 4. close% - close in % of position (futures) or sell (spot) coins in % for current quantity
quantity (float) : (float) orders size. Размер ордера.
l_stop (float) : (float) price for activation stop order. Цена активации стоп-ордера.
leverageforqty (bool) : (bool) use leverage in qty. Использовать плечо при расчете количества или нет.
Returns: 'Stop Market Sell order (close long position)'. Маркетный стоп-ордер на снижения/закрытия текущего лонга.
short_stop(token, market, ticker_id, type_qty, quantity, s_stop, leverageforqty)
Stop market order for short position
Рыночный стоп-ордер на покупку(в лонг) для закрытия шорт позиции.
Parameters:
token (string)
market (string) : (string) 'binance' , 'binancefru' etc.. Строковая переменная названия биржи.
ticker_id (string) : (string) ticker in market ('btcusdt', 'ethusdt' etc...). Строковая переменная названия тикера (пары).
type_qty (string) : (string) type of quantity: 1. 'qty' or '' or na - standart (in coins), 2. 'quqty'- in assets (usdt,btc,etc..), 3.open% - open position(futures) or buy (spot) in % of base 4. close% - close in % of position (futures) or sell (spot) coins in % for current quantity
quantity (float) : (float) orders size. Размер ордера.
s_stop (float) : (float) price for activation stop order. Цена активации стоп-ордера.
leverageforqty (bool) : (bool) use leverage in qty. Использовать плечо при расчете количества или нет.
Returns: 'Stop Market Buy order (close short position)'. Маркетный стоп-ордер на снижения/закрытия текущего шорта.
change_stop_l(token, market, ticker_id, type_qty, quantity, l_stop, leverageforqty)
Change Stop market order for long position
Изменяем стоп-ордер на продажу(в шорт) для закрытия лонг позиции.
Parameters:
token (string)
market (string) : (string) 'binance' , 'binancefru' etc.. Строковая переменная названия биржи.
ticker_id (string) : (string) ticker in market ('btcusdt', 'ethusdt' etc...). Строковая переменная названия тикера (пары).
type_qty (string) : (string) type of quantity: 1. 'qty' or '' or na - standart (in coins), 2. 'quqty'- in assets (usdt,btc,etc..), 3.open% - open position(futures) or buy (spot) in % of base 4. close% - close in % of position (futures) or sell (spot) coins in % for current quantity
quantity (float) : (float) orders size. Размер ордера.
l_stop (float) : (float) price for activation stop order. Цена активации стоп-ордера.
leverageforqty (bool) : (bool) use leverage in qty. Использовать плечо при расчете количества или нет.
Returns: 'Change Stop Market Buy order (close long position)'. Смещает цену активации Маркетного стоп-ордер на снижения/закрытия текущего лонга.
change_stop_s(token, market, ticker_id, type_qty, quantity, s_stop, leverageforqty)
Change Stop market order for short position
Смещает цену активации Рыночного стоп-ордера на покупку(в лонг) для закрытия шорт позиции.
Parameters:
token (string)
market (string) : (string) 'binance' , 'binancefru' etc.. Строковая переменная названия биржи.
ticker_id (string) : (string) ticker in market ('btcusdt', 'ethusdt' etc...). Строковая переменная названия тикера (пары).
type_qty (string)
quantity (float) : (float) orders size. Размер ордера.
s_stop (float) : (float) price for activation stop order. Цена активации стоп-ордера.
leverageforqty (bool) : (bool) use leverage in qty. Использовать плечо при расчете количества или нет.
Returns: 'Change Stop Market Buy order (close short position)'. Смещает цену активации Маркетного стоп-ордер на снижения/закрытия текущего шорта.
open_long_position(token, market, ticker_id, type_qty, quantity, l_stop, leverageforqty)
Cancel and close all orders and positions by ticker , then open Long position by market price with stop order
Отменяет все лимитки и закрывает все позы по тикеру, затем открывает лонг по маркету с выставлением стопа (переворот позиции, при необходимости).
Parameters:
token (string)
market (string) : (string) 'binance' , 'binancefru' etc.. Строковая переменная названия биржи.
ticker_id (string) : (string) ticker in market ('btcusdt', 'ethusdt' etc...). Строковая переменная названия тикера (пары).
type_qty (string) : (string) type of quantity: 1. 'qty' or '' or na - standart (in coins), 2. 'quqty'- in assets (usdt,btc,etc..), 3.open% - open position(futures) or buy (spot) in % of base 4. close% - close in % of position (futures) or sell (spot) coins in % for current quantity
quantity (float) : (float) orders size. Размер ордера.
l_stop (float) : (float). Price for activation stop loss. Цена активации стоп-лосса.
leverageforqty (int) : (bool) use leverage in qty. Использовать плечо при расчете количества или нет.
Returns: 'command_all_close + LongMarket + long_stop.
open_short_position(token, market, ticker_id, type_qty, quantity, s_stop, leverageforqty)
Cancel and close all orders and positions , then open Short position by market price with stop order
Отменяет все лимитки и закрывает все позы по тикеру, затем открывает шорт по маркету с выставлением стопа(переворот позиции, при необходимости).
Parameters:
token (string)
market (string) : (string) 'binance' , 'binancefru' etc.. Строковая переменная названия биржи.
ticker_id (string) : (string) ticker in market ('btcusdt', 'ethusdt' etc...). Строковая переменная названия тикера (пары).
type_qty (string) : (string) type of quantity: 1. 'qty' or '' or na - standart (in coins), 2. 'quqty'- in assets (usdt,btc,etc..), 3.open% - open position(futures) or buy (spot) in % of base 4. close% - close in % of position (futures) or sell (spot) coins in % for current quantity
quantity (float) : (float) orders size. Размер ордера.
s_stop (float) : (float). Price for activation stop loss. Цена активации стоп-лосса.
leverageforqty (int) : (bool) use leverage in qty. Использовать плечо при расчете количества или нет.
Returns: 'command_all_close + ShortMarket + short_stop'.
open_long_trade(token, market, ticker_id, type_qty, quantity, l_stop, qty_ex1, price_ex1, qty_ex2, price_ex2, qty_ex3, price_ex3, leverageforqty)
Cancell and close all orders and positions , then open Long position by market price with stop order and take 1 ,take 2, take 3
Отменяет все лимитки и закрывает все позы по тикеру, затем открывает лонг по маркету с выставлением стопа и 3 тейками (переворот позиции, при необходимости).
Parameters:
token (string)
market (string) : (string) 'binance' , 'binancefru' etc.. Строковая переменная названия биржи.
ticker_id (string) : (string) ticker in market ('btcusdt', 'ethusdt' etc...). Строковая переменная названия тикера (пары).
type_qty (string) : (string) type of quantity: 1. 'qty' or '' or na - standart (in coins), 2. 'quqty'- in assets (usdt,btc,etc..), 3.open% - open position(futures) or buy (spot) in % of base 4. close% - close in % of position (futures) or sell (spot) coins in % for current quantity
quantity (float) : (float) enter order size, see at type_qty. Размер ордера входа, согласно type_qty.
l_stop (float) : (float). Price for activation stop loss. Цена активации стоп-лосса.
qty_ex1 (float) : (float). Quantity for 1th take see at type_qty, if = 0 string for order dont set. Размер лимитного ордера для 1го тейка, согласно type_qty.. Если 0, то строка для этого тейка не формируется
price_ex1 (float) : (float). Price for 1th take , if = 0 string for order dont set. Цена лимитного ордера для 1го тейка. Если 0, то строка для этого тейка не формируется
qty_ex2 (float) : (float). Quantity for 2th take see at type_qty, if = 0 string for order dont set. Размер лимитного ордера для 2го тейка, согласно type_qty..Если 0, то строка для этого тейка не формируется
price_ex2 (float) : (float). Price for 2th take, if = 0 string for order dont set. Цена лимитного ордера для 2го тейка. Если 0, то строка для этого тейка не формируется
qty_ex3 (float) : (float). Quantity for 3th take see at type_qty, if = 0 string for order dont set. Размер лимитного ордера для 2го тейка, согласно type_qty..Если 0, то строка для этого тейка не формируется
price_ex3 (float) : (float). Price for 3th take, if = 0 string for order dont set. Цена лимитного ордера для 3го тейка. Если 0, то строка для этого тейка не формируется
leverageforqty (int)
Returns: 'cancel_all_close + LongMarket + long_stop + CloseLongLimit1 + CloseLongLimit2+CloseLongLimit3'.
open_short_trade(token, market, ticker_id, type_qty, quantity, s_stop, qty_ex1, price_ex1, qty_ex2, price_ex2, qty_ex3, price_ex3, leverageforqty)
Cancell and close all orders and positions , then open Short position by market price with stop order and take 1 and take 2
Отменяет все лимитки и закрывает все позы по тикеру, затем открывает шорт по маркету с выставлением стопа и 3 тейками (переворот позиции, при необходимости).
Parameters:
token (string)
market (string) : (string) 'binance' , 'binancefru' etc.. Строковая переменная названия биржи.
ticker_id (string) : (string) ticker in market ('btcusdt', 'ethusdt' etc...). Строковая переменная названия тикера (пары).
type_qty (string)
quantity (float)
s_stop (float) : (float). Price for activation stop loss. Цена активации стоп-лосса.
qty_ex1 (float) : (float). Quantity for 1th take see at type_qty, if = 0 string for order dont set. Размер лимитного ордера для 1го тейка, согласно type_qty.. Если 0, то строка для этого тейка не формируется
price_ex1 (float) : (float). Price for 1th take , if = 0 string for order dont set. Цена лимитного ордера для 1го тейка. Если 0, то строка для этого тейка не формируется
qty_ex2 (float) : (float). Quantity for 2th take see at type_qty, if = 0 string for order dont set. Размер лимитного ордера для 2го тейка, согласно type_qty..Если 0, то строка для этого тейка не формируется
price_ex2 (float) : (float). Price for 2th take, if = 0 string for order dont set. Цена лимитного ордера для 2го тейка. Если 0, то строка для этого тейка не формируется
qty_ex3 (float) : (float). Quantity for 3th take see at type_qty, if = 0 string for order dont set. Размер лимитного ордера для 2го тейка, согласно type_qty..Если 0, то строка для этого тейка не формируется
price_ex3 (float) : (float). Price for 3th take, if = 0 string for order dont set. Цена лимитного ордера для 3го тейка. Если 0, то строка для этого тейка не формируется
leverageforqty (int)
Returns: 'command_all_close + ShortMarket + short_stop + CloseShortLimit + CloseShortLimit(2)'.
Multi_LongLimit(token, market, ticker_id, type_qty, qty1, price1, qty2, price2, qty3, price3, qty4, price4, qty5, price5, qty6, price6, qty7, price7, qty8, price8, leverageforqty)
8 or less Buy orders with limit price and quantity.
До 8 Лимитных ордеров на покупку(в лонг).
Parameters:
token (string) : (integer or 0) token for trade in system, if = 0 then token part mess is empty. Токен, При значениb = 0 не включается в формирование строки алерта.
market (string) : (string) Spot 'binance' , 'bybit' . Futures ('binancefru','binancefro','bybitfu', 'bybitfi'). Строковая переменная названия биржи.
ticker_id (string) : (string) ticker in market ('btcusdt', 'ethusdt' etc...). Строковая переменная названия тикера (пары).
type_qty (string) : (string) type of quantity: 1. 'qty' or '' or na - standart (in coins), 2. 'quqty'- in assets (usdt,btc,etc..), 3.open% - open position(futures) or buy (spot) in % of base 4. close% - close in % of position (futures) or sell (spot) coins in % for current quantity
qty1 (float)
price1 (float)
qty2 (float)
price2 (float)
qty3 (float)
price3 (float)
qty4 (float)
price4 (float)
qty5 (float)
price5 (float)
qty6 (float)
price6 (float)
qty7 (float)
price7 (float)
qty8 (float)
price8 (float)
leverageforqty (bool) : (bool) use leverage in qty. Использовать плечо при расчете количества или нет.
Returns: 'Limit Buy order'. Лимитный ордер на покупку (лонг).
Search in scripts for "TAKE"
3Commas Bot DCA Backtester & Signals FREEThis is a DCA Strategy backtester + signals, built to emulate the 3Commas DCA bots. It uses your choice of 4 different buy signals, 2 of which can be adjusted in the settings. Everything is customizable so you can backtest specific settings with different buy signals and find the best performing strategy for your risk tolerance and capital. It can be used to backtest strategies on stocks as well, but just make sure your base order is larger than the share price for the entire backtesting range or it will not calculate properly.
You can use this template to code your own buy signals and then backtest them as a DCA strategy if you know some basic pine script.
The indicator shows all of your backtesting orders on the chart. The red line is your take profit level, the blue line is your average price level, the white line is your first order and the green lines are your average down orders. If you enable a stop loss in the settings your stop loss will be shown as an orange line once all of your average down orders have been hit, it will not be set until price has dipped below your covered trading range.
These levels update when things change during backtesting so you can visualize your strategy and how it would perform as well as see if your percentage deviation is large enough to cover dips. When backtesting trades are taken, the chart will show where they were taken(in backtesting) along with info on those trades such as the number each order is, the size of that order and the percentage deviation that order is from the initial buy.
SENDING SIGNALS TO 3COMMAS
Tradingview cannot sync this backtester to 3Commas and with the way alerts are setup for strategies on Tradingview, the best option for you to give signals to your bot would be to use this backtester to figure out what trigger you want to use and then setup that indicator separately to send alerts to your bot. All of the indicators used for signals in this backtester are available for free and can be configured to match this backtester and send alerts to 3Commas for you. Just make sure you set your alerts to once per bar close and don’t use less than a 15 second timeframe because then you could trigger the Tradingview threshold for alerts and get your alerts shut off.
You can also use this backtester with your own buy triggers if you know a little pine script. Just make copy of the script and code in your own buy signals and see how it backtests.
INFO PANEL FOR ANALYZING YOUR STRATEGY
The right hand side of the screen will show an info panel that shows a lot of different information so you can quickly see your bot settings and how it performed right on the screen.
In the top right corner you will see in purple your bot settings. These include your stoploss % if turned on, take profit %, average down order %, average down order % multiplier, volume multiplier, max number of orders allowed and size of your base order.
The top section of the first column “Current Trade” shows these stats: the open trade’s average price, the open trade’s take profit price, the open trade’s PNL, how far price is from your open tarde’s take profit level in percentage, your open position size and number of open orders.
The bottom section of the first column “Overall Performance” shows these stats: total number of trades taken during backtesting range, the largest amount of trades that were open at one time during backtesting, the max drawdown, the average number of bars per trade, gross profit, net profit, percent profit from your initial capital, current portfolio value and your initial capital.
CUSTOMIZABLE OPTIONS TO FIND THE PERFECT STRATEGY
Stoploss On/Off
This will turn your stoploss on or off. By default it is set to off and will not affect anything unless turned on.
Stoploss Percentage
This is the percentage below your final average down order price that will be set as a stoploss to keep your account from going too far in the red on big dips.
Take Profit Percentage - This is the percentage of profit you want the trade to hit before taking profit on your entire DCA trade. This level updates everytime you average down.
Average Down Percentage - This is the percentage that price has to drop from your initial order to initiate your first safety order. If the Average Down Percent Multiplier is set to 1 then this percentage will be the same for every average down order.
Average Down Percentage Multiplier - This multiplies your Average Down Percentage so each safety order needs a larger percentage deviation than the previous one. This keeps your buys closer together at the beginning and further apart when you hit more orders so you can extend your trading range but still be aggressive when price is going sideways.
Volume Multiplier Per New Order - This multiplies the size of each trade based on your base order. If you set it to a 2x multiplier then each average down order will be 2 times the size of the last one. So for example, a $100 base order with a 2x multiplier would have these values for the first 3 average down orders: 200, 400, 800.
Size Of Base Order - This is the size of your first position entry and will be used as a starting point for the volume multiplier. If your base order is $100 then it will buy $100 worth of whatever crypto you are backtesting this on. If you are looking at stock charts, you need to make sure your base order is higher than the share price across the entire backtesting range or it will not perform correctly.
Max Number Of Orders - This is the maximum number of orders the bot can take, including your base order. Adjust this to suit the amount of capital you are willing to allocate to your bot based on how much money it will require to run according to your bot settings.
TIPS ON HOW TO USE FOR BEST RESULTS
If you don’t have a lot of capital to work with, then use longer timeframes with a reasonable take profit percentage so that you don’t need a lot of average down orders. You can also try keeping the volume multiplier close to 1.
You can use the 3Commas dca bot settings page to see how much capital you will need for your strategy if you match it to the settings you have on this indicator. You can also check to see how much of a percentage deviation your bot is covering to make sure you have a reasonable range to trade in and orders to cover big dips. You can also check your coverage by seeing how far down the chart the green lines cover, which are your average down orders.
Make sure the initial capital in the properties tab of the settings has enough to cover all of your orders otherwise you will get unrealistic backtesting results. Also, make sure you leave the order size in the properties tab on contracts so it calculates your trades correctly. The only settings you need to touch in the properties tab is the initial capital. Unless you are trading somewhere that has lower commission fees, then you can change that to match, but leave all the other settings as is for it to function properly.
Increasing the volume multiplier will make your average price and take profit target follow the price action a lot closer as price falls, but it can also lead to having very large orders very quickly once you get into the 1.5-3x multiple range. Try using a high volume multiplier with less safety orders and you will get better results, however you need to have money on the sidelines to add on major dips to keep your bot turning a profit. Be very careful with this as greed and impatience will hurt your overall performance. This bot is meant to make money with lots of small wins so don’t get greedy and make sure you have enough money to cover large dips. If you are being aggressive with your bot, then I recommend only using 25% or less of your portfolio to trade aggressively and then use the smart trade feature on 3commas to add chunks of funds to your trades when price dips below your last safety order. Or if you want it to run without any supervision, then use lower volume multipliers and have lots of safety orders that can cover entire bear markets and still keep buying lower.
It’s a good idea to have some capital on the sidelines that you can add in when price dips quickly. This will help lower your average price and allow your bot to get out in profit quicker. 3Commas bot has a smart trade feature that will allow you to track your average price when adding extra funds and it will automatically update your other orders which is very convenient. Look at the longer timeframes when price dips and only add chunks at major areas where price is very likely to bounce. Or you can be aggressive when trading and add to your position when price dips and is at a likely bounce zone to maximize profits.
Only trade coins that have a good amount of liquidity as the larger your orders get, the harder it will be to sell if there isn’t much liquidity. Also, beware of how large your first order is as it will usually be a market order and can move the market if there is not much liquidity.
Since this bot takes a lot of trades and performs best when taking small profits consistently, you will need to factor in exchange fees. The bot is set to .5% commission(you can change this) on the buy and sell orders as most exchanges charge that amount. Some exchanges offer no fee trading on certain coins so be sure to look around for those so you can keep the commissions and maximize profits.
I strongly encourage you to try out a lot of different setting combinations across multiple different coins and do it across a few months to see how it would have performed under various market conditions. This will help you get a better idea of how much of a percentage deviation you’ll need to be able to cover to keep your bot running and making constant profits. You can also use the deep backtesting feature of the strategy panel to see how it would have done, but just beware that the info panel of the indicator will not reflect deep backtesting results, only the normal backtesting range.
MARKETS
This backtester can be used on any market including crypto, stocks, forex & futures. You just need to make sure your base order is larger than the share price when using this on things besides crypto.
TIMEFRAMES
This backtester can be used on all timeframes.

Position Tool█ OVERVIEW
This script is an interactive measurement tool that can be used to evaluate or keep track of trades. Like the long and short position drawing tools, it calculates a risk reward ratio and a risk-adjusted position size from the entry, stop and take profit levels, but it also does much more:
• It can be used to configure long or short trades.
• All monetary values can be expressed in any number of currencies.
• The value of tick/pip movement (which varies with the position's size) is displayed in the currency you have selected.
• The CAGR ( Compound Annual Growth Rate ) for the trade can be displayed.
• It does live tracking of the position.
• You can configure alerts on entries and exits.
█ HOW TO USE IT
Load the indicator on an active chart (see here if you don't know how).
When you first load this script on a chart, you will enter an interactive selection mode where the script asks you to pick three points in price and time on your chart by clicking on the chart. Directions will appear in a blue box at the bottom of the screen with each click of the mouse. The first selection is the entry point for the trade you are considering, which takes into account both the time and level you choose, the next are the take profit and stop levels. Once you have selected all three points, the script will draw trade zones and labels containing the trade metrics. The script determines if the trade is a long or short from the position of the take profit and stop loss levels in relation to the entry price. If the take profit level is above the entry price, the stop must be below and vice versa, otherwise an error occurs.
You can change levels by dragging the handles that appear when you select the indicator, or by entering new values in the script's settings. The only way to re-enter interactive mode is to re-add the indicator to your chart.
Once you place the position tool on a chart, it will appear at the same levels on all symbols you use. If your scale is not set to "Scale price chart only", the position tool's levels will be taken into account when scaling the chart, which can cause the symbol's bars to be compressed. If your scale is set to "Scale price chart only", the position tool will still be there, but it will not impact the scale of the chart's bars, so you won't see it if it sits outside the symbol's price scale.
If you select the position tool on your chart and delete it, this will also delete the indicator from the chart. You will need to re-add it if you want to draw another position tool. You can add multiple instances of the indicator if you need a position tool on more than one of your charts.
█ FEATURES
Display
The position tool displays the following information for entries:
• The entry's price level with an '@' sign before it.
• Open or Closed P&L : For an open trade, the "Open P&L" displays the difference in money value between the entry level and the chart's current price.
For a closed trade, the "Closed P&L" displays the realized P&L on the trade.
• Quantity : The trade size, which takes into account the risk tolerance you set in the script's settings.
• RR : The reward to risk ratio expresses the relationship of the distance between the entry and the take profit level vs the entry and the stop level.
Example: A $100 stop with a $100 target will have a ratio of 1:1, whereas a $200 target with the same stop will have a 2:1 ratio.
• Per tick/pip : Represents the money value of a tick or pip movement.
• CAGR : The Compound Annual Growth Rate will be displayed on the main order label on trades that exceed one day in duration.
This value is calculated the same way as in our CAGR Custom Range indicator.
If the trade duration is less than one day, the metric will not be present in the display.
The stop and take profit levels display:
• Their price level with an '@' sign before it.
• Their distance from the entry in money value, percentage and ticks/pips.
• The projected end money value of the position if the level is reached. These values are calculated based on the trade size and the currency.
Currency adjustments
This indicator modifies the trade label's colors and values based on the final Profit and Loss (P&L), which considers the dynamic exchange rate between base and conversion currencies in its calculations when the conversion currency is a specified value other than the default. Depending on the cross rate between the base and account currencies, this process can yield a negative P&L on an otherwise successful simulated trade.
For instance, if your account is in currency XYZ, you might buy 10 Apple shares at $150 each, with the XYZ to USD exchange rate being 2:1. This purchase would cost you 3000 units of XYZ. Suppose that later on, the shares appreciate to $170 each, and you decide to sell. One might expect this trade to result in profit. However, if the exchange rate has now equalized to 1:1, the return on selling the shares, calculated in XYZ, would only be 1700 units, resulting in a loss of 1300 units XYZ.
The indicator will mark the P&L and the target labels in red in such cases, regardless of whether the market price reached the profit target, as the trade produced a net loss due to reduced funds after currency conversion. Conversely, an otherwise unsuccessful position can result in a net profit in the account currency due to conversion rate fluctuations. The final losses or gains appear in the label metrics, and the corresponding color coding reflects the trade's success or failure.
Settings
The settings in the "Trade sizing" section are used to calculate the position size and the monetary value of trades. Two types of risk can be chosen from the menu; a percentage based risk calculation, or a fixed money value. The risk is used to calculate the quantity of units to purchase to achieve that level of risk exposure. Example: An account size of $1000 and 10% risk will have a projected end amount of $900 if the stop loss is hit. The quantity is a product of this relationship; a projected number of units to allow for the equivalent of $100 of risk exposure over the change in price from the entry to the stop value.
The "Trade levels" allow you to manually set the entry, take profit and stop levels of an existing position tool on your chart.
You can control the appearance of the tool and the values it displays in the settings following these first two sections.
Alerts
Three alerts that will trigger when you configure an alert on this indicator. The first will send an alert when the entry price is breached by price action if that price has not already been breached in the previous price history. This is dependant on the entry location you select when placing the indicator on the chart. The other two alerts will trigger when either the stop loss or the take profit level is breached to signal that a trade exit has occurred.
█ NOTES FOR Pine Script™ CODERS
• Interactive inputs are implemented for input.time() and input.price() . These specialized input functions allow users to interact with a script.
You can create one interactive input for both time and price values by using the same `inline` argument in a pair of input.time() and input.price() function calls.
• We use the `cagr()` function from our ta library.
• The script uses the runtime.error() function to throw an error if the stop and limit prices are not placed on opposing sides of the entry price.
• We use the `currency` parameter in a request.security() call to convert currencies.
Look first. Then leap.

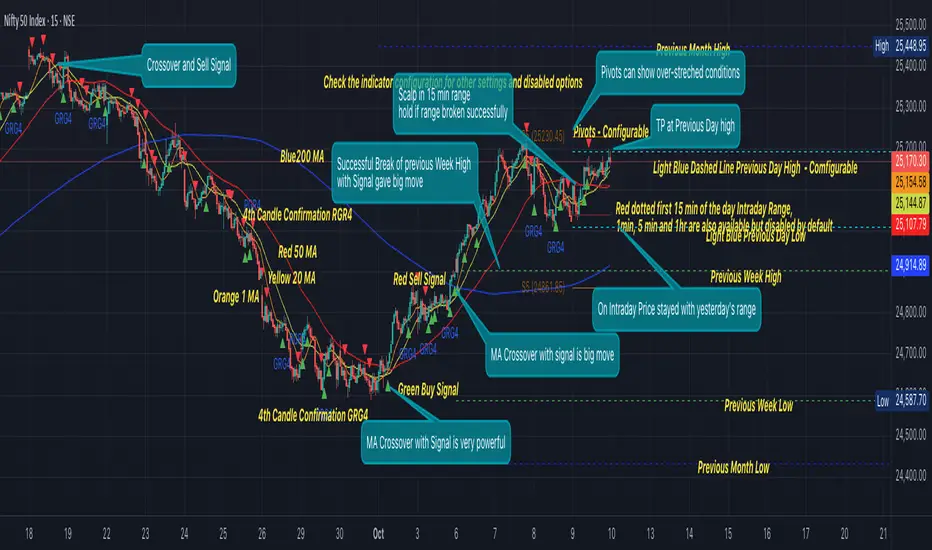
GRG/RGR Signal, MA, Ranges and PivotsThis indicator is a combination of several indicators.
It is a combination of two of my indicators which I solely use for trading
1. EMA 10-20-50-200, Pivots and Previous Day/Week/Month range
2. 3/4-Bar GRG / RGR Pattern (Conditional 4th Candle)
You can use them individually if you already have some of them or just use this one. Belive me when I say, this is all you need, along with market structure knowlege and even if you don’t have that, this indicator has been doing wonders for me. This is all I use. I do not use anything else.
**Note - Do checkout the indicators individually as I have added valuable information in the comment section.
It contains the following,
1. 10 EMA/SMA - configurable
2. 20 EMA/SMA - configurable
3. 50 EMA/SMA - configurable
4. 200 EMA/SMA - configurable
5. Previous Day's Range - configurable
6. Previous Week's Range - configurable
7. Previous Month's Range - configurable
8. Pivots - configurable
9. Buy Sell Signal - configurable
The Moving Averages
It is a very important combination and using it correctly with price action will strengthen your entries and exits.
The ema's or sma's added are the most powerful ones and they do definitely act as support and resistance.
The Daily/Weekly/Monthly Ranges
The Daily/Weekly/Monthly ranges are extremely important for any trader and should be used for targets and reversals.
Pivots
Pivots can provide support and resistance level. R5 and S5 can be used to check for over stretched conditions. You can customise them however you like. It is a full pivot indicator.
It is defaulted to show R5 and S5 only to reduce noise in the chart but it can be customised.
The 3/4 RGR or GRG Signal Generator
Combined with a 3/4 RGR or GRG setup can be all a trader needs.
You don't need complex strategies and SMC concepts to trade. Simple EMAs, ranges and RGR/GRG setup is the most winning combination.
This indicator can be used to identify the Green-Red-Green or Red-Green-Red pattern.
It is a price action indicator where a price action which identifies the defeat of buyers and sellers.
If the buyers comprehensively defeat the sellers then the price moves up and if the sellers defeat the buyers then the price moves down.
In my trading experience this is what defines the price movement.
It is a 3 or 4 candle pattern, beyond that i.e, 5 or more candles could mean a very sideways market and unnecessary signal generation.
How does it work?
Upside/Green signal
1. Say candle 1 is Green, which means buyers stepped in, then candle 2 is Red or a Doji, that means sellers brought the price down. Then if candle 3 is forming to be Green and breaks the closing of the 1st candle and opening of the 2nd candle, then a green arrow will appear and that is the place where you want to take your trade.
2. Here the buyers defeated the sellers.
3. Sometimes candle 3 falls short but candle 4 breaks candle 1's closing and candle 2's opening price. We can enter on candle 4.
4. Important - We need to enter the trade as soon as the price moves above the candle 1 and 2's body and should not wait for the 3rd or 4th candle to close. Ignore wicks.
5. But for a more optimised entry I have added an option to use candle’s highs and lows instead of open and close. This reduces lot of noise and provides us with more precise entry. This setting is turned on by default.
6. I have restricted it to 4 candles and that is all that is needed. More than that is a longer sideways market.
7. I call it the +-+ or GRG pattern or Green-Red-Green or Buyer-Seller-Buyer or Seller defeated or just Buyer pattern.
8. Stop loss can be candle 2's mid for safe traders (that includes me) or candle 2's body low for risky traders.
9. Back testing suggests that body low will be useless and result in more points in loss because for the bigger move this point will not be touched, so why not get out faster.
Downside/Red signal
1. Say candle 1 is Red, which means sellers stepped in, then candle 2 is Green or a Doji, that means buyers took the price up. Then if candle 3 is forming to be Red and breaks the closing of the 1st candle and opening of the 2nd candle then a Red arrow will appear and that is the place where you want to take your trade.
2. Sometimes candle 3 falls short but candle 4 breaks candle 1's closing and candle 2's opening price. We can enter on candle 4.
3. We need to enter the trade as soon as the price moves below the candle 1 and 2's body and should not wait for the 3rd or 4th candle to close.
4. But for a more optimised entry I have added an option to use candle’s highs and lows instead of open and close. This reduces lot of noise and provides us with more precise entry. This setting is turned on by default.
5. I have restricted it to 4 candles and that is all that is needed. More than that is a longer sideways market.
6. I call it the -+- or RGR pattern or Red-Green-Red or Seller-Buyer-Seller or Buyer defeated or just Seller pattern.
7. Stop loss can be candle 2's mid for safe traders ( that includes me) or candle 2's body high for risky traders.
8. Back testing suggests that body high will be useless and result in more points in loss because for the bigger move this point will not be touched, so why not get out faster.
Combining Indicators and Signal
Combining these indicators with GRG/RGR signal can be very powerful and can provide big moves.
1. MA crossover and Signal - This is very powerful and provides a very big move. Trades can be held for longer. If after taking the trade we notice that the MA crossover has happened then trades can be held for higher targets.
2. Pivots and Signal - Pivots and add a support or resistance point. Take profits on these points. R5/S5 are over streched conditions so we can start looking for reversal signals and ignore other signals
3. Intraday Range - first 1, 5, 15 min of the day - Sideways days is when price will stay in these ranges. You can take profits at these ranges or if the range is broken and we get a signal, then it can mean that the direction will be sustained.
4. Previous Day/Week/Month Ranges - These can be used as Take Profit points if the price is moving towards them after getting the signal. If the range is broken and we get a signal then it can be a strong signal. They can also be used as reversal points if a strong signal is generated.
Important Settings
1. Include 4th Candle Confirmation - You can enable or disable the 4th candle signal to avoid the noise, but at times I have noticed that the 4th candle gives a very strong signal or I can say that the strong signal falls on the 4th candle. This is mostly a coincidence.
2. Bars to check (default 10) - You can also configure how many previous bars should the signal be generated for. 10 to 30 is good enough. To backtest increase it to 2000 or 5000 for example.
3. Use Candle High/Low for confirmation instead of Candle Open/Close - More optimized entry and noise reduction. This option is now defaulted to false.
4. Show Green-Red-Green (bull) signals - Show only bull entries. Useful when I have a predefined view i.e, I know market is going to go up today.
5. Show Red-Green-Red (bear) signals - Show only bear entries. Useful when I have a predefined view i.e, I know market is going to go down today.
6. 3rd candle should be a Strong candle before considering 4th candle - This will enforce additional logic in 4 candle setup that the 3rd candle is the candle in our direction of breakout. This means something like GRGG is mandatory, which is still the default behaviour. If disabled, the 3rd candle can be any candle and 4th candle will act as our breakout candle. This behaviour has led to breakouts and breakdowns as times, hence I added this as a separate feature. Vice-versa for a RGGR.
For a 4 candle setup till now we were expecting GRGG or RGRR but we can let the system ignore the 3rd candle completely if needed.
This will result in additional signals.
7. Three intraday ranges added for index and stock traders - 1 min, 5 min and 15 min ranges will be displayed. These are disabled by default except 15 min. These are very important ranges and in sideways days the price will usually move within the 15 min. A breakout of this range and a positive signal can be a very powerful setup.
Safe traders can avoid taking a trade in this range as it can lead to fakeouts.
The line style, width, color and opacity are configurable.
Pointers/Golden Rules
1. If after taking the trade, the next candle moves in your direction and closes strong bullish or bearish, then move SL to break even and after that you can trail it.
2. If a upside trade hits SL and immediately a down side trade signal is generated on the next candle then take it. Vice versa is true.
3. Trades need to be taken on previous 2 candle's body high or low combined and not the wicks.
4. The most losses a trader takes is on a sideways day and because in our strategy the stop loss is so small that even on a sideways day we'll get out with a little profit or worst break even.
5. Hold trades for longer targets and don't panic.
6. If last 3-4 days have been sideways then there is a good probability that today will be trending so we can hold our trade for longer targets. Inverse is true when the market has been trending for 2-3 days then volatility followed by sideways is coming (DOW theory). Target to hold the trade for whole day and not exit till the day closes.
7. In general avoid trading in the middle of the day for index and stocks. Divide the day into 3 parts and avoid the middle.
8. Use Support/Resistance, 10, 20, 50, 200 EMA/SMA, Gaps, Whole/Round numbers(very imp) for identifying targets.
9. Trail your SL.
10. For indexes I would use 5 min and 15 min timeframe and at times 10 mins.
11. For commodities and crypto we can use higher timeframe as well. Look for signals during volatile time durations and avoid trading the whole day. Signal usually gives good targets on those times.
12. If a GRG or RGR pattern appears on a daily timeframe then this is our time to go big.
13. Minimum Risk to Reward should be 1:2 and for longer targets can be 1:4 to 1:10.
14. Trade with small lot size. Money management will happen automatically.
15. With small lot size and correct Risk-Reward we can be very profitable. Don't trade with big lot size.
16. Stay in the market for longer and collect points not money.
17. Very imp - Watch market and learn to generate a market view.
18. Very imp - Only 3 type of candles are needed in trading -
Strong Bullish (Big Green candle), Strong Bearish (Big Red candle),
Hammer (it is Strong Bullish), Inverse Hammer (it is Strong Bearish)
and Doji (indecision or confusion).
If on daily timeframe I see Strong Bullish candle previous day then I am biased to the upside the next day, if I see Strong Bearish candle the previous day then I am biased to the downside the next day, if I see Doji on the previous day then I am cautious the next day, if there are back to back Dojis forming in daily or weekly then I am preparing for big move so time to go big once I get the signal.
19. Most Important Candlestick pattern - Bullish and Bearish Engulfing
20. The only Chart patterns I need -
a) Falling Wedge/Channel Bullish Pattern Uptrend or Bull Flag - Buying - Forming over a couple days for intraday and forming over a couple of weeks for swing
b) Falling Wedge/Channel Bullish Pattern Downtrend or Falling Channel - Buying
c) Rising Wedge Bearish Pattern Uptrend or Rising Channel - Selling
d) Rising Wedge Bearish Pattern Downtrend or Bear flag - Selling
e) Head and Shoulder - Over a longer period not for intraday. In 15 min takes few days and for swing 1hr or 4h or daily can take few days
f) M and W pattern - Reversal Patterns - They form within the above 4 patterns, usually resulting in the break of trend line
21. How Gaps work -
a) Small Gap up in Uptrend - Market can fill the gap and reverse. The perception is that people are buying. If previous day candle was Strong Bullish then market view is up.
b) Big Gap up in Uptrend - Not news driven - Profit booking will come but may not fill the entire gap
c) Big Gap up in Uptrend - News driven, war related, tax, interest rate - Market can keep going up without stopping.
c) Flat opening in Uptrend - Big chance of market going up. If previous day candle was Strong Bullish then view is upwards, if it was Doji then still upwards.
d) Gap down in Uptrend - Market is surprised. After going down initially it can go up
e) Small Gap down in Downtrend - Market can fill the gap and keep moving down. If previous day candle was Strong Bearish then view is still down.
f) Flat opening in Downtrend - View is down, short today.
g) Big Gap down in Downtrend - Profit booking and foolish buying will come but market view is still down.
h) Gap down with News - Volatility, sideways then down.
i) Gap Up in Downtrend - Can move up - Price can move up during 2/3rd of the day and End of the day revert and close in red.
22. Go big on bearish days for option traders. Puts are better bought and Calls are better sold.
23. Cluster of green signals can lead to bigger move on the upside and vice versa for red signals.
24. Most of this is what I learned from successful traders (from the top 2%) only the indicator is mine.
Trend Fib Zone Bounce (TFZB) [KedArc Quant]Description:
Trend Fib Zone Bounce (TFZB) trades with the latest confirmed Supply/Demand zone using a single, configurable Fib pullback (0.3/0.5/0.6). Trade only in the direction of the most recent zone and use a single, configurable fib level for pullback entries.
• Detects market structure via confirmed swing highs/lows using a rolling window.
• Draws Supply/Demand zones (bearish/bullish rectangles) from the latest MSS (CHOCH or BOS) event.
• Computes intra zone Fib guide rails and keeps them extended in real time.
• Triggers BUY only inside bullish zones and SELL only inside bearish zones when price touches the selected fib and closes back beyond it (bounce confirmation).
• Optional labels print BULL/BEAR + fib next to the triangle markers.
What it does
Finds structure using confirmed swing highs/lows (you choose the confirmation length).
Builds the latest zone (bullish = demand, bearish = supply) after a CHOCH/BOS event.
Draws intra-zone “guide rails” (Fib lines) and extends them live.
Signals only with the trend of that zone:
BUY inside a bullish zone when price tags the selected Fib and closes back above it.
SELL inside a bearish zone when price tags the selected Fib and closes back below it.
Optional labels print BULL/BEAR + Fib next to triangles for quick context
Why this is different
Most “zone + fib + signal” tools bolt together several indicators, or fire counter-trend signals because they don’t fully respect structure. TFZB is intentionally minimal:
Single bias source: the latest confirmed zone defines direction; nothing else overrides it.
Single entry rule: one Fib bounce (0.3/0.5/0.6 selectable) inside that zone—no counter-trend trades by design.
Clean visuals: you can show only the most recent zone, clamp overlap, and keep just the rails that matter.
Deterministic & transparent: every plot/label comes from the code you see—no external series or hidden smoothing
How it helps traders
Cuts decision noise: you always know the bias and the only entry that matters right now.
Forces discipline: if price isn’t inside the active zone, you don’t trade.
Adapts to volatility: pick 0.3 in strong trends, 0.5 as the default, 0.6 in chop.
Non-repainting zones: swings are confirmed after Structure Length bars, then used to build zones that extend forward (they don’t “teleport” later)
How it works (details)
*Structure confirmation
A swing high/low is only confirmed after Structure Length bars have elapsed; the dot is plotted back on the original bar using offset. Expect a confirmation delay of about Structure Length × timeframe.
*Zone creation
After a CHOCH/BOS (momentum shift / break of prior swing), TFZB draws the new Supply/Demand zone from the swing anchors and sets it active.
*Fib guide rails
Inside the active zone TFZB projects up to five Fib lines (defaults: 0.3 / 0.5 / 0.7) and extends them as time passes.
*Entry logic (with-trend only)
BUY: bar’s low ≤ fib and close > fib inside a bullish zone.
SELL: bar’s high ≥ fib and close < fib inside a bearish zone.
*Optionally restrict to one signal per zone to avoid over-trading.
(Optional) Aggressive confirm-bar entry
When do the swing dots print?
* The code confirms a swing only after `structureLen` bars have elapsed since that candidate high/low.
* On a 5-min chart with `structureLen = 10`, that’s about 50 minutes later.
* When the swing confirms, the script plots the dot back on the original bar (via `offset = -structureLen`). So you *see* the dot on the old bar, but it only appears on the chart once the confirming bar arrives.
> Practical takeaway: expect swing markers to appear roughly `structureLen × timeframe` later. Zones and signals are built from those confirmed swings.
Best timeframe for this Indicator
Use the timeframe that matches your holding period and the noise level of the instrument:
* Intraday :
* 5m or 15m are the sweet spots.
* Suggested `structureLen`:
* 5m: 10–14 (confirmation delay \~50–70 min)
* 15m: 8–10 (confirmation delay \~2–2.5 hours)
* Keep Entry Fib at 0.5 to start; try 0.3 in strong trends, 0.6 in chop.
* Tip: avoid the first 10–15 minutes after the open; let the initial volatility set the early structure.
* Swing/overnight:
* 1h or 4h.
* `structureLen`:
* 1h: 6–10 (6–10 hours confirmation)
* 4h: 5–8 (20–32 hours confirmation)
* 1m scalping: not recommended here—the confirmation lag relative to the noise makes zones less reliable.
Inputs (all groups)
Structure
• Show Swing Points (structureTog)
o Plots small dots on the bar where a swing point is confirmed (offset back by Structure Length).
• Structure Length (structureLen)
o Lookback used to confirm swing highs/lows and determine local structure. Higher = fewer, stronger swings; lower = more reactive.
Zones
• Show Last (zoneDispNum)
o Maximum number of zones kept on the chart when Display All Zones is off.
• Display All Zones (dispAll)
o If on, ignores Show Last and keeps all zones/levels.
• Zone Display (zoneFilter): Bullish Only / Bearish Only / Both
o Filters which zone types are drawn and eligible for signals.
• Clean Up Level Overlap (noOverlap)
o Prevents fib lines from overlapping when a new zone starts near the previous one (clamps line start/end times for readability).
Fib Levels
Each row controls whether a fib is drawn and how it looks:
• Toggle (f1Tog…f5Tog): Show/hide a given fib line.
• Level (f1Lvl…f5Lvl): Numeric ratio in . Defaults active: 0.3, 0.5, 0.7 (0 and 1 off by default).
• Line Style (f1Style…f5Style): Solid / Dashed / Dotted.
• Bull/Bear Colors (f#BullColor, f#BearColor): Per-fib color in bullish vs bearish zones.
Style
• Structure Color: Dot color for confirmed swing points.
• Bullish Zone Color / Bearish Zone Color: Rectangle fills (transparent by default).
Signals
• Entry Fib for Signals (entryFibSel): Choose 0.3, 0.5 (default), or 0.6 as the trigger line.
• Show Buy/Sell Signals (showSignals): Toggles triangle markers on/off.
• One Signal Per Zone (oneSignalPerZone): If on, suppresses additional entries within the same zone after the first trigger.
• Show Signal Text Labels (Bull/Bear + Fib) (showSignalLabels): Adds a small label next to each triangle showing zone bias and the fib used (e.g., BULL 0.5 or BEAR 0.3).
How TFZB decides signals
With trend only:
• BUY
1. Latest active zone is bullish.
2. Current bar’s close is inside the zone (between top and bottom).
3. The bar’s low ≤ selected fib and it closes > selected fib (bounce).
• SELL
1. Latest active zone is bearish.
2. Current bar’s close is inside the zone.
3. The bar’s high ≥ selected fib and it closes < selected fib.
Markers & labels
• BUY: triangle up below the bar; optional label “BULL 0.x” above it.
• SELL: triangle down above the bar; optional label “BEAR 0.x” below it.
Right-Panel Swing Log (Table)
What it is
A compact, auto-updating log of the most recent Swing High/Low events, printed in the top-right of the chart.
It helps you see when a pivot formed, when it was confirmed, and at what price—so you know the earliest bar a zone-based signal could have appeared.
Columns
Type – Swing High or Swing Low.
Date – Calendar date of the swing bar (follows the chart’s timezone).
Swing @ – Time of the original swing bar (where the dot is drawn).
Confirm @ – Time of the bar that confirmed that swing (≈ Structure Length × timeframe after the swing). This is also the earliest moment a new zone/entry can be considered.
Price – The swing price (high for SH, low for SL).
Why it’s useful
Clarity on repaint/confirmation: shows the natural delay between a swing forming and being usable—no guessing.
Planning & journaling: quick reference of today’s pivots and prices for notes/backtesting.
Scanning intraday: glance to see if you already have a confirmed zone (and therefore valid fib-bounce entries), or if you’re still waiting.
Context for signals: if a fib-bounce triangle appears before the time listed in Confirm @, it’s not a valid trade (you were too early).
Settings (Inputs → Logging)
Log swing times / Show table – turn the table on/off.
Rows to keep – how many recent entries to display.
Show labels on swing bar – optional tags on the chart (“Swing High 11:45”, “Confirm SH 14:15”) that match the table.
Recommended defaults
• Structure Length: 10–20 for intraday; 20–40 for swing.
• Entry Fib for Signals: 0.5 to start; try 0.3 in stronger trends and 0.6 in choppier markets.
• One Signal Per Zone: ON (prevents over trading).
• Zone Display: Both.
• Fib Lines: Keep 0.3/0.5/0.7 on; turn on 0 and 1 only if you need anchors.
Alerts
Two alert conditions are available:
• BUY signal – fires when a with trend bullish bounce at the selected fib occurs inside a bullish zone.
• SELL signal – fires when a with trend bearish bounce at the selected fib occurs inside a bearish zone.
Create alerts from the chart’s Alerts panel and select the desired condition. Use Once Per Bar Close to avoid intrabar flicker.
Notes & tips
• Swing dots are confirmed only after Structure Length bars, so they plot back in time; zones built from these confirmed swings do not repaint (though they extend as new bars form).
• If you don’t see a BUY where you expect one, check: (1) Is the active zone bullish? (2) Did the candle’s low actually pierce the selected fib and close above it? (3) Is One Signal Per Zone suppressing a second entry?
• You can hide visual clutter by reducing Show Last to 1–3 while keeping Display All Zones off.
Glossary
• CHOCH (Change of Character): A shift where price breaks beyond the last opposite swing while local momentum flips.
• BOS (Break of Structure): A cleaner break beyond the prior swing level in the current momentum direction.
• MSS: Either CHOCH or BOS – any event that spawns a new zone.
Extension ideas (optional)
• Add fib extensions (1.272 / 1.618) for target lines.
• Zone quality score using ATR normalization to filter weak impulses.
• HTF filter to only accept zones aligned with a higher timeframe trend.
⚠️ Disclaimer This script is provided for educational purposes only.
Past performance does not guarantee future results.
Trading involves risk, and users should exercise caution and use proper risk management when applying this strategy.

Persistence# Persistence
## What it does
Measures **price change persistence**, defined as the percentage of bars within a lookback window that closed higher than the prior close. A high value means the instrument has been closing up frequently, which can indicate durable momentum. This mirrors Stockbee’s idea: *select stocks with high price change persistence*, and then combine **momentum plus persistence**.
## Can be used for scanning in PineScreener
## Calculation
* `isUp` is true when `close > close `.
* `countUp` counts true instances over the last `len` bars.
* `pctUp = 100 * countUp / len`, bounded between 0 and 100.
* A 50% level is a natural baseline. Above 50% suggests more up closes than down closes in the window.
## Inputs
* **Lookback bars (`len`)**: default 252 for roughly one trading year on a daily chart. On weekly charts use something like 52, on monthly charts use 12.
## How to use
1. **Screen for persistence**
Sort a watchlist by the plotted value, higher is better. Many momentum traders start looking above 58 to 65 percent, then layer a trend filter.
2. **Combine with momentum**
Examples, pick tickers with:
* `pctUp > 60`, and price above a rising EMA50 or EMA100.
* `pctUp rising` and weekly ROC positive.
3. **Switch timeframe to change the horizon**
* Daily chart with `len = 252` approximates one year.
* Weekly chart with `len = 52` approximates one year.
* Monthly chart with `len = 12` approximates one year.
## TC2000 equivalence
Stockbee’s TC2000 expression:
```
CountTrue(c > c1, 252)
```
## Interpretation guide
* **70 to 90**: very strong persistence; often trend leaders, check for extensions and risk controls.
* **60 to 70**: constructive persistence; good hunting ground for swing setups that also pass momentum filters.
* **50**: neutral baseline; around random up vs down frequency.
* **Below 50**: persistent weakness; consider only for mean reversion or short strategies.
## Practical tips
* **Event effects**: ex-dividend gaps can reduce persistence on high yield names. Earnings gaps can swing the value sharply.
* **Survivorship bias**: when backtesting on curated lists, persistence can look cleaner than in live scans.
* **Liquidity**: thin names may show noisy persistence due to erratic prints.
## Reference to Stockbee
* “One way to select stocks for swing trading is to find those with high price change persistence.”
* “Persistence can be calculated on a daily, monthly, or weekly timeframe.”
* TC2000 function: `CountTrue(c > c1, 252)`
* Example noted in the tweet: CVNA had very high one-year price persistence at the time of that post.
* Takeaway: **look for momentum plus persistence**, not persistence alone.

Bollinger Bands % | QuantEdgeB📊 Introducing Bollinger Bands % (BB%) by QuantEdgeB
🛠️ Overview
BB% | QuantEdgeB is a volatility-aware momentum tool that maps price within a Bollinger envelope onto a normalized scale. By letting you choose the base moving average (SMA, EMA, DEMA, TEMA, HMA, ALMA, EHMA, THMA, RMA, WMA, VWMA, T3, LSMA) and even Heikin-Ashi sources, it adapts to your style while keeping readings consistent across symbols and timeframes. Clear thresholds and color-coded visuals make it easy to spot emerging strength, fading moves, and potential mean-reversions.
✨ Key Features
• 🔹 Flexible Baseline
Pick from 12 MA types (plus Heikin-Ashi source option) to tailor responsiveness and smoothness.
• 🔹 Normalized Positioning
Price is expressed as a percentage of the band range, yielding an intuitive 0–100 style read (can exceed in extreme trends).
• 🔹 Actionable Thresholds
Default Long 55 / Short 45 levels provide simple, objective triggers.
• 🔹 Visual Clarity
Color-coded candles, shaded OB/OS zones, and adaptive color themes speed up decision-making.
• 🔹 Ready-to-Alert
Built-in alerts for long/short transitions.
📐 How It Works
1️⃣ Band Construction
A moving average (your choice) defines the midline; volatility (standard deviation) builds upper/lower bands.
2️⃣ Normalization
The indicator measures where price sits between the lower and upper band, scaling that into a bounded oscillator (BB%).
3️⃣ Signal Logic
• ✅ Long when BB% rises above 55 (strength toward the top of the envelope).
• ❌ Short when BB% falls below 45 (weakness toward the bottom).
4️⃣ OB/OS Context
Shaded regions above/below typical ranges highlight exhaustion and potential snap-backs.
⚙️ Custom Settings
• Base MA Type: SMA, EMA, DEMA, TEMA, HMA, ALMA, EHMA, THMA, RMA, WMA, VWMA, T3, LSMA
• Source Mode: Classic price or Heikin-Ashi (close/open/high/hlc3)
• Base Length: default 40
• Band Width: standard deviation-based (2× SD by default)
• Long / Short Thresholds: defaults 55 / 45
• Color Mode: Alpha, MultiEdge, TradingSuite, Premium, Fundamental, Classic, Warm, Cold, Strategy
• Candles & Labels: optional candle coloring and signal markers
👥 Ideal For
✅ Trend Followers — Ride strength as price compresses near the upper band.
✅ Swing/Mean-Reversion Traders — Fade extremes when BB% stretches into OB/OS zones.
✅ Multi-Timeframe Analysts — Compare band position consistently across periods.
✅ System Builders — Use BB% as a normalized feature for strategies and filters.
📌 Conclusion
BB% | QuantEdgeB delivers a clean, normalized read of price versus its volatility envelope—adaptable via rich MA/source options and easy to automate with thresholds and alerts.
🔹 Key Takeaways:
1️⃣ Normalized view of price inside the volatility bands
2️⃣ Flexible baseline (12+ MA choices) and Heikin-Ashi support
3️⃣ Straightforward 55/45 triggers with clear visual context
📌 Disclaimer: Past performance is not indicative of future results. No strategy guarantees success.
📌 Strategic Advice: Always backtest, tune parameters, and align with your risk profile before live trading.
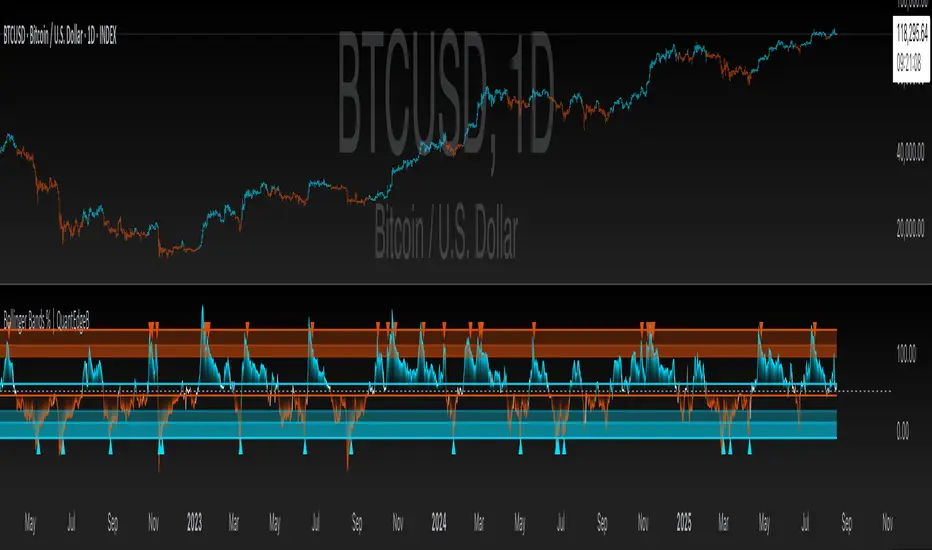
Volume FlaresVolume Flares – Spotting Abnormal Volume by Time of Day
Most volume tools compare current volume to a moving average of the last X bars. That’s fine for seeing short-term changes, but it ignores how volume naturally ebbs and flows throughout the day.
Volume at 9:35 is not the same as volume at 1:15.
A standard MA will treat them the same.
What Volume Flares does differently:
Breaks the day into exact time slots (based on your chosen timeframe).
Calculates the historical average volume for each slot across past sessions.
Compares the current bar’s volume only to its own slot’s historical average.
Marks when current volume is significantly higher than normal for that exact time of day.
Visuals:
Colored columns = historical average volume for each slot (dark = quiet, bright = busy).
Green stepline = today’s actual current volume.
Dark red background = current volume > 130% of that slot’s historical average.
Volume Behavior table = live % comparison and raw values for quick reference.
How I use it:
Red and green arrows on the price chart are manually drawn where the background turns red in the volume panel.
These often align with liquidity grabs, institutional entries, or areas where the market is “louder” than it should be for that moment in the day.
Helps filter out false urgency — high volume at the open isn’t the same as high volume in the lunch lull.
Key takeaway:
This is not a buy/sell signal.
It’s context.
It’s about spotting when the market is behaving out of character for that specific moment, and using that to read intent behind the move.
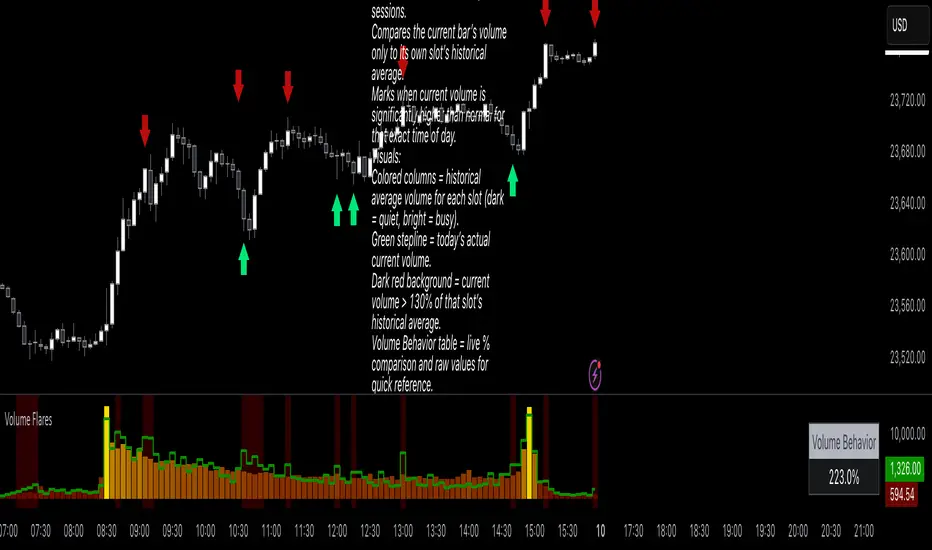
9:45am NIFTY TRADINGTime Frame: 15 Minutes | Reference Candle Time: 9:45 AM IST | Valid Trading Window: 3 Hours
📌 Introduction
This document outlines a structured trading strategy for NIFTY & BANKNIFTY Options based on a 15-minute timeframe with a 9:45 AM IST reference candle. The strategy incorporates technical indicators, probability analysis, and strict trading rules to optimize entries and exits.
📊 Core Features
1. Reference Time Trading System
9:45 AM IST Candle acts as the reference for the day.
All signals (Buy/Sell/Reversal) are generated based on price action relative to this candle.
The valid trading window is 3 hours after the reference candle.
2. Signal Generation Logic
Signal Condition
Buy (B) Price breaks above reference candle high with confirmation
Sell (S) Price breaks below reference candle low with confirmation
Reversal (R) Early trend reversal signal (requires strict confirmation)
3. Probability Analysis System
The strategy calculates Win Probability (%) using 4 components:
Component Weight Calculation
Body Win Probability 30% Based on candle body strength (body % of total range)
Volume Win Probability 30% Current volume vs. average volume strength
Trend Win Probability 40% EMA crossover + RSI momentum alignment
Composite Probability - Weighted average of all 3 components
Probability Color Coding:
🟢 Green (High Probability): ≥70%
🟠 Orange (Medium Probability): 50-69%
🔴 Red (Low Probability): <50%
4. Timeframe Enforcement
Strictly 15-minute charts only (no other timeframes allowed).
System auto-disables signals if the wrong timeframe is selected.
📈 Technical Analysis Components
1. EMA System (Trend Analysis)
Short EMA (9) – Fast trend indicator
Middle EMA (20) – Intermediate trend
Long EMA (50) – Long-term trend confirmation
Rules:
Buy Signal: Price > 9 EMA > 20 EMA > 50 EMA (Bullish trend)
Sell Signal: Price < 9 EMA < 20 EMA < 50 EMA (Bearish trend)
2. Multi-Timeframe RSI (Momentum)
5M, 15M, 1H, 4H, Daily RSI values are compared for divergence/confluence.
Overbought (≥70) / Oversold (≤30) conditions help in reversal signals.
3. Volume Analysis
Volume Strength (%) = (Current Volume / Avg. Volume) × 100
Strong Volume (>120% Avg.) confirms breakout/breakdown.
4. Body Percentage (Candle Strength)
Body % = (Close - Open) / (High - Low) × 100
Strong Bullish Candle: Body > 60%
Strong Bearish Candle: Body < 40%
📊 Visual Elements
1. Information Tables
Reference Data Table (9:45 AM Candle High/Low/Close)
RSI Values Table (5M, 15M, 1H, 4H, Daily)
Signal Legend (Buy/Sell/Reversal indicators)
2. Chart Overlays
Reference Lines (9:45 AM High & Low)
EMA Lines (9, 20, 50)
Signal Labels (B, S, R)
3. Color Coding
High Probability (Green)
Medium Probability (Orange)
Low Probability (Red)
⚠️ Important Usage Guidelines
✅ Best Practices:
Trade only within the 3-hour window (9:45 AM - 12:45 PM IST).
Wait for confirmation (closing above/below reference candle).
Use probability score to filter high-confidence trades.
❌ Avoid:
Trading outside the 15-minute timeframe.
Ignoring volume & RSI divergence.
Overtrading – Stick to 1-2 high-probability setups per day.
🎯 Conclusion
This NIFTY Trading Strategy is optimized for 15-minute charts with a 9:45 AM IST reference candle. It combines EMA trends, RSI momentum, volume analysis, and probability scoring to generate high-confidence signals.
🚀 Key Takeaways:
✔ Reference candle defines the day’s bias.
✔ Probability system filters best trades.
✔ Strict 15M timeframe ensures consistency.
Happy Trading! 📈💰

Z SMMA | QuantEdgeB📈 Introducing Z-Score SMMA (Z SMMA) by QuantEdgeB
🛠️ Overview
Z SMMA is a momentum-driven oscillator designed to track the standardized deviation of a Smoothed Moving Average (SMMA). By applying Z-score normalization, this tool dynamically adapts to price volatility, enabling traders to detect meaningful directional shifts and trend changes with enhanced clarity.
It serves both as a trend-following and mean-reversion system, identifying opportunities through standardized thresholds while remaining robust across volatile and calm market conditions.
✨ Key Features
🔹 Z-Score Normalization Engine
Applies Z-score to a custom SMMA baseline, allowing traders to compare price action relative to its recent volatility-adjusted mean.
🔹 Dynamic Trend Detection
Generates actionable long/short signals based on customizable Z-thresholds, making it adaptable across different asset classes and timeframes.
🔹 Overbought/Oversold Zones
Highlight reversion and profit-taking zones (default OB: +2 to +4, OS: -2 to -4), great for counter-trend or mean-reversion strategies.
🔹 Visual Reinforcement Tools
Includes candle coloring, gradient fills, and optional ALMA/EMA band overlays to visualize trend regime transitions.
🔍 How It Works
1️⃣ Z-Score SMMA Calculation
The core is a custom Smoothed Moving Average (SMMA) that is normalized by its standard deviation over a lookback period.
Final Formula:
Z = (SMMA - Mean) / StdDev
2️⃣ Signal Generation
• ✅ Long Bias: Z-Score > Long Threshold (default: 0)
• ❌ Short Bias: Z-Score < Short Threshold (default: 0)
3️⃣ Visual Aids
• Candle Color → Shows trend bias
• Band Fills → Highlight trend strength
• Overlays → Optional ALMA/EMA bands for structure analysis
⚙️ Custom Settings
• SMMA Length → Default: 12
• Z-Score Lookback → Default: 30
• Long Threshold → Default: 0
• Short Threshold → Default: 0
• Color Themes → Choose from 6 visual modes
• Extra Plots → Toggle advanced overlays (ALMA, EMA, bands)
• Label Display → Show/hide “𝓛𝓸𝓷𝓰” & “𝓢𝓱𝓸𝓻𝓽” markers
👥 Who Should Use It?
✅ Trend Traders → For early entries with confirmation from Z-score expansion
✅ Quantitative Analysts → Standardized deviation enables comparison across assets
✅ Mean-Reversion Traders → Use OB/OS zones to fade parabolic spikes
✅ Swing & Systematic Traders → Identify momentum shifts with optional ALMA/EMA overlays
📌 Conclusion
Z SMMA offers a smart, adaptive framework for tracking deviation from equilibrium in a quant-friendly format. Whether you're looking to follow trends or catch exhaustion points, Z SMMA provides a clear, standardized view of momentum and price extremes.
🔹 Key Takeaways:
1️⃣ Z-Score standardization ensures dynamic range awareness
2️⃣ SMMA base filters out noise, offering smoother signals
3️⃣ Color-coded visuals support faster reaction and cleaner charts
📌 Disclaimer: Past performance is not indicative of future results. No trading strategy can guarantee success in financial markets.
📌 Strategic Advice: Always backtest, optimize, and align parameters with your trading objectives and risk tolerance before
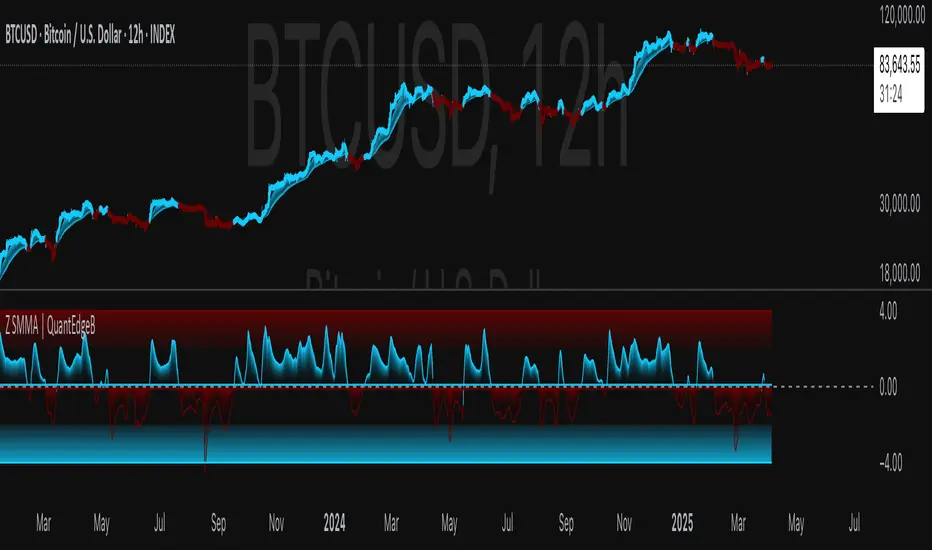
Kernel Weighted DMI | QuantEdgeB📊 Introducing Kernel Weighted DMI (K-DMI) by QuantEdgeB
🛠️ Overview
K-DMI is a next-gen momentum indicator that combines the traditional Directional Movement Index (DMI) with advanced kernel smoothing techniques to produce a highly adaptive, noise-resistant trend signal.
Unlike standard DMI that can be overly reactive or choppy in consolidation phases, K-DMI applies kernel-weighted filtering (Linear, Exponential, or Gaussian) to stabilize directional movement readings and extract a more reliable momentum signal.
✨ Key Features
🔹 Kernel Smoothing Engine
Smooths DMI using your choice of kernel (Linear, Exponential, Gaussian) for flexible noise reduction and clarity.
🔹 Dynamic Trend Signal
Generates real-time long/short trend bias based on signal crossing upper or lower thresholds (defaults: ±1).
🔹 Visual Encoding
Includes directional gradient fills, candle coloring, and momentum-based overlays for instant signal comprehension.
🔹 Multi-Mode Plotting
Optional moving average overlays visualize structure and compression/expansion within price action.
📐 How It Works
1️⃣ Directional Movement Index (DMI)
Calculates the traditional +DI and -DI differential to derive directional bias.
2️⃣ Kernel-Based Smoothing
Applies a custom-weighted average across historical DMI values using one of three smoothing methods:
• Linear → Simple tapering weights
• Exponential → Decay curve for recent emphasis
• Gaussian → Bell-shaped weight for centered precision
3️⃣ Signal Generation
• ✅ Long → Signal > Long Threshold (default: +1)
• ❌ Short → Signal < Short Threshold (default: -1)
Additional overlays signal potential compression zones or trend resumption using gradient and line fills.
⚙️ Custom Settings
• DMI Length: Default = 7
• Kernel Type: Options → Linear, Exponential, Gaussian (Def:Linear)
• Kernel Length: Default = 25
• Long Threshold: Default = 1
• Short Threshold: Default = -1
• Color Mode: Strategy, Solar, Warm, Cool, Classic, Magic
• Show Labels: Optional entry signal labels (Long/Short)
• Enable Extra Plots: Toggle MA overlays and dynamic bands
👥 Who Is It For?
✅ Trend Traders → Identify sustained directional bias with smoother signal lines
✅ Quant Analysts → Leverage advanced smoothing models to enhance data clarity
✅ Discretionary Swing Traders → Visualize clean breakouts or fades within choppy zones
✅ MA Compression Traders → Use overlay MAs to detect expansion opportunities
📌 Conclusion
Kernel Weighted DMI is the evolution of classic momentum tracking—merging traditional DMI logic with adaptable kernel filters. It provides a refined lens for trend detection, while optional visual overlays support price structure analysis.
🔹 Key Takeaways:
1️⃣ Smoothed and stabilized DMI for reliable trend signal generation
2️⃣ Optional Gaussian/exponential weighting for adaptive responsiveness
3️⃣ Custom gradient fills, dynamic MAs, and candle coloring to support visual clarity
📌 Disclaimer: Past performance is not indicative of future results. No trading strategy can guarantee success in financial markets.
📌 Strategic Advice: Always backtest, optimize, and align parameters with your trading objectives and risk tolerance before live trading.

Normalized DEMA Oscillator SD| QuantEdgeB📊 Introducing Normalized DEMA Oscillator SD (NDOSD) by QuantEdgeB
🛠️ Overview
Normalized DEMA Oscillator SD (NDOSD) is a powerful trend and momentum indicator that blends DEMA-based smoothing with a standard deviation-based normalization engine. The result is an oscillator that adapts to volatility, filters noise, and highlights both trend continuations and reversal zones with exceptional clarity.
It normalizes price momentum within an adaptive SD envelope, allowing comparisons across assets and market conditions. Whether you're a trend trader or mean-reverter, NDOSD provides the insight needed for smarter decision-making.
✨ Key Features
🔹 DEMA-Powered Momentum Core
Utilizes a Double EMA (DEMA) for smoother trend detection with reduced lag.
🔹 Normalized SD Bands
Price momentum is standardized using a dynamic 2× standard deviation range—enabling consistent interpretation across assets and timeframes.
🔹 Overbought/Oversold Detection
Includes clear OB/OS zones with shaded thresholds to identify potential reversals or trend exhaustion areas.
🔹 Visual Trend Feedback
Color-coded oscillator zones, candle coloring, and optional signal labels help traders immediately see trend direction and strength.
📐 How It Works
1️⃣ DEMA Calculation
The core of NDOSD is a smoothed price line using a Double EMA, designed to reduce false signals in choppy markets.
2️⃣ Normalization with SD
The DEMA is normalized within a volatility range using a 2x SD calculation, producing a bounded oscillator from 0–100. This transforms the raw signal into a structured format, allowing for OB/OS detection and trend entry clarity.
3️⃣ Signal Generation
• ✅ Long Signal → Oscillator crosses above the long threshold (default: 55) and price holds above the lower SD boundary.
• ❌ Short Signal → Oscillator drops below short threshold (default: 45), often within upper SD boundary context.
4️⃣ OB/OS Thresholds
• Overbought Zone: Above 100 → Caution / Consider profit-taking.
• Oversold Zone: Below 0 → Watch for accumulation setups.
⚙️ Custom Settings
• Calculation Source: Default = close
• DEMA Period: Default = 30
• Base SMA Period: Default = 20
• Long Threshold: Default = 55
• Short Threshold: Default = 45
• Color Mode: Choose from Strategy, Solar, Warm, Cool, Classic, or Magic
• Signal Labels Toggle: Show/hide Long/Short markers on chart
👥 Ideal For
✅ Trend Followers – Identify breakout continuation zones using oscillator thrust and SD structure
✅ Swing Traders – Catch mid-trend entries or mean reversion setups at OB/OS extremes
✅ Quant/Systemic Traders – Normalize signals for algorithmic integration across assets
✅ Multi-Timeframe Analysts – Easily compare trend health using standardized oscillator ranges
📌 Conclusion
Normalized DEMA Oscillator SD is a sleek and adaptive momentum toolkit that helps traders distinguish true momentum from false noise. With its fusion of DEMA smoothing and SD normalization, it works equally well in trending and range-bound conditions.
🔹 Key Takeaways:
1️⃣ Smoother momentum tracking using DEMA
2️⃣ Cross-asset consistency via SD-based normalization
3️⃣ Versatile for both trend confirmation and reversal identification
📌 Disclaimer: Past performance is not indicative of future results. No trading strategy can guarantee success in financial markets.
📌 Strategic Advice: Always backtest, optimize, and align parameters with your trading objectives and risk tolerance before live trading.
Let me know if you want a strategy script or publish-ready layout for TradingView next!
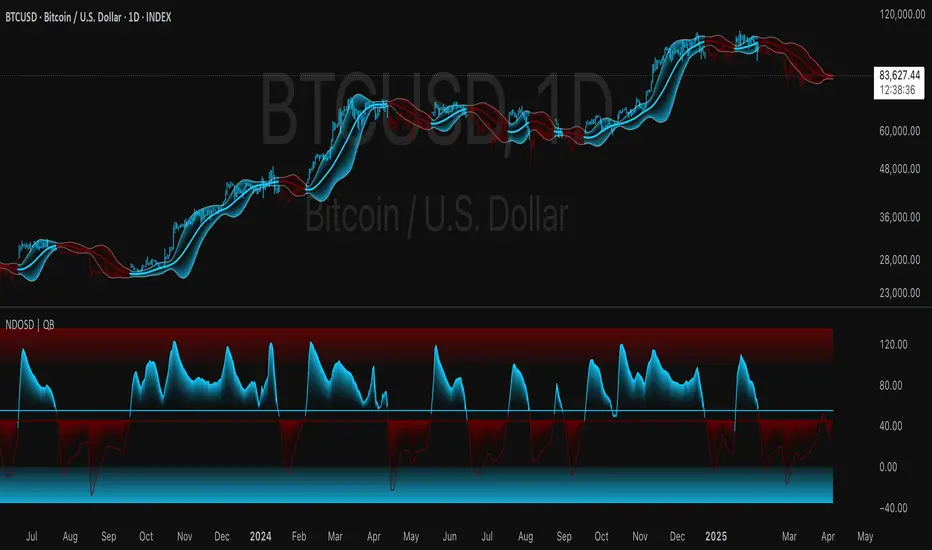
Median RSI SD| QuantEdgeB📈 Introducing Median RSI SD by QuantEdgeB
🛠️ Overview
Median RSI SD is a hybrid momentum tool that fuses two powerful techniques: Median Price Filtering and RSI-based Momentum. The result? A cleaner, more responsive oscillator designed to reduce noise and increase clarity in trend detection and potential reversals.
By applying the RSI not to raw price but to the percentile-based median, the indicator adapts better to real structural shifts in the market while filtering out temporary price spikes.
✨ Key Features
🔹 Smoothed RSI Momentum
Utilizes a percentile-based median as input to RSI, reducing volatility and enhancing signal reliability.
🔹 Volatility-Weighted SD Zones
Automatically detects overbought/oversold extremes using ±1 standard deviation bands on the median, adapting to current market volatility.
🔹 Trend Signal Overlay
A directional trend signal (Long / Short / Neutral) is derived from the RSI crossing custom thresholds, combined with position relative to SD bands.
🔹 Visual Labeling System
Optional in-chart labels for Long / Short signals and fully color-customizable theme modes.
📊 How It Works
1️⃣ Median RSI Calculation
Instead of using the close price directly, the script first computes a smoothed median via percentile ranking. RSI is then applied to this filtered stream, improving reactivity without overfitting to short-term noise.
2️⃣ Standard Deviation Filtering
Upper and lower SD bands are calculated around the median to identify extreme conditions. A position near the upper SD while RSI is below the short threshold triggers bearish bias. The reverse applies for longs.
3️⃣ Signal Generation
• ✅ Long Signal → RSI crosses above the Long Threshold (default: 65) and price holds above lower SD.
• ❌ Short Signal → RSI crosses below the Short Threshold (default: 45), typically within upper SD range.
4️⃣ Contextual Highlighting
Zone fills on the chart and RSI subgraph indicate Overbought (>75) and Oversold (<25) conditions for added clarity.
⚙️ Custom Settings
• RSI Length → Default: 21
• Median Length → Default: 10
• Long Threshold → Default: 65
• Short Threshold → Default: 45
• Color Mode → Choose from Strategy, Solar, Warm, Cool, Classic, Magic
• Signal Labels Toggle → Optional in-chart long/short labels
👥 Who Should Use It?
✅ Swing & Momentum Traders → Filter entries based on confirmed directional RSI setups.
✅ Range-Bound Traders → Use SD thresholds to spot fakeouts or exhaustion zones.
✅ Intraday Strategists → Enhanced signal clarity makes it usable even on lower timeframes.
✅ System Builders → Combine this signal with price action or confluence layers for smarter rules.
📌 Conclusion
Median RSI SD by QuantEdgeB is more than just a modified oscillator—it's a robust momentum confirmation framework designed for modern volatility. By replacing noisy price feeds with a statistically stable input and layering RSI + SD logic, this tool provides high-clarity signals without sacrificing responsiveness.
🔹 Key Takeaways:
1️⃣ Median-filtered RSI eliminates noise without lag
2️⃣ Standard deviation bands identify exhaustion zones
3️⃣ Reliable for both trend continuation and mean-reversion strategies
📌 Disclaimer: Past performance is not indicative of future results. No trading strategy can guarantee success in financial markets.
📌 Strategic Advice: Always backtest, optimize, and align parameters with your trading objectives and risk tolerance before live trading.

Linear % ST | QuantEdgeB🚀 Introducing Linear Percentile SuperTrend (Linear % ST) by QuantEdgeB
🛠️ Overview
Linear % SuperTrend (Linear % ST) by QuantEdgeB is a hybrid trend-following indicator that combines Linear Regression, Percentile Filters, and Volatility-Based SuperTrend Logic into one dynamic tool. This system is designed to identify trend shifts early while filtering out noise during choppy market conditions.
By utilizing percentile-based median smoothing and customized ATR multipliers, this tool captures both breakout momentum and pullback opportunities with precision.
✨ Key Features
🔹 Percentile-Based Median Filtering
Removes outliers and normalizes price movement for cleaner trend detection using the 50th percentile (median) of recent price action.
🔹 Linear Regression Smoothing
A smoothed baseline is computed with Linear Regression to detect the underlying trend while minimizing lag.
🔹 SuperTrend Structure with Adaptive Bands
The indicator implements an enhanced SuperTrend engine with custom ATR bands that adapt to trend direction. Bands tighten or loosen based on volatility and trend strength.
🔹 Dynamic Long/Short Conditions
Long and short signals are derived from the relationship between price and the SuperTrend threshold zones, clearly showing trend direction with optional "Long"/"Short" labels on the chart.
🔹 Multiple Visual Themes
Select from 6 built-in color palettes including Strategy, Solar, Warm, Cool, Classic, and Magic to match your personal style or strategy layout.
📊 How It Works
1️⃣ Percentile Filtering
The source price (default: close) is filtered using a nearest-rank 50th percentile over a custom lookback. This normalizes data to reflect the central tendency and removes noisy extremes.
2️⃣ Linear Regression Trend Base
A Linear Regression Moving Average (LSMA) is applied to the filtered median, forming the core trend line. This dynamic trendline provides a low-lag yet smooth view of market direction.
3️⃣ SuperTrend Engine
ATR is applied with custom multipliers (different for long and short) to create dynamic bands. The bands react to price movement and only shift direction after confirmation, preventing false flips.
4️⃣ Trend Signal Logic
• When price stays above the dynamic lower band → Bullish trend
• When price breaks below the upper band → Bearish trend
• Trend direction remains stable until violated by price.
⚙️ Custom Settings
• Percentile Length → Lookback for percentile smoothing (default: 35)
• LSMA Length → Determines the base trend via linear regression (default: 24)
• ATR Length → ATR period used in dynamic bands (default: 14)
• Long Multiplier → ATR multiplier for bullish thresholds (default: 0.8)
• Short Multiplier → ATR multiplier for bearish thresholds (default: 1.9)
✅ How to Use
1️⃣ Trend-Following Strategy
✔️ Go Long when price breaks above the lower ATR band, initiating an upward trend
✔️ Go Short when price falls below the upper ATR band, confirming bearish conditions
✔️ Remain in trend direction until the SuperTrend flips
2️⃣ Visual Confirmation
✔️ Use bar coloring and the dynamic bands to stay aligned with trend direction
✔️ Optional Long/Short labels highlight key signal flips
👥 Who Should Use Linear % ST?
✅ Swing & Position Traders → To ride trends confidently
✅ Trend Followers → As a primary directional filter
✅ Breakout Traders → For clean signal generation post-range break
✅ Quant/Systematic Traders → Integrate clean trend logic into algorithmic setups
📌 Conclusion
Linear % ST by QuantEdgeB blends percentile smoothing with linear regression and volatility bands to deliver a powerful, adaptive trend-following engine. Whether you're a discretionary trader seeking cleaner entries or a systems-based trader building logic for automation, Linear % ST offers clarity, adaptability, and precision in trend detection.
🔹 Key Takeaways:
1️⃣ Percentile + Regression = Noise-Reduced Core Trend
2️⃣ ATR-Based SuperTrend = Reliable Breakout Confirmation
3️⃣ Flexible Parameters + Color Modes = Custom Fit for Any Strategy
📈 Use it to spot emerging trends, filter false signals, and stay confidently aligned with market momentum.
📌 Disclaimer: Past performance is not indicative of future results. No trading strategy can guarantee success in financial markets.
📌 Strategic Advice: Always backtest, optimize, and align parameters with your trading objectives and risk tolerance before live trading.

HILO Interpolation | QuantEdgeB🚀 Introducing HILO Interpolation by QuantEdgeB
🛠️ Overview
HILO Interpolation is a dynamic price-action based signal engine crafted to adapt across trending and ranging conditions. By leveraging percentile-based price band interpolation, it identifies high-confidence breakout and breakdown zones. This indicator is designed to serve both as a momentum trigger in trend phases and as a price-reactive entry system during range-bound consolidation.
By intelligently switching between percentile thresholds and interpolated logic, HILO minimizes noise and whipsaws commonly seen in traditional crossover systems.
✨ Key Features
🔹 Percentile Interpolation Engine
Tracks price breakouts using percentile thresholds, making it adaptable to volatility and asset-specific structure.
🔹 Price-Based Signal Confirmation
Signals are only triggered when price meaningfully crosses through key percentile thresholds (based on historical high/low logic).
🔹 Visual Trend Encoding
Color-coded candles, dynamic interpolation bands, and optional long/cash labels give clear visual cues for trend and trade direction.
🔹 Dynamic Threshold Switching
Interpolated threshold flips based on where price sits relative to percentile bands—providing adaptive long/short logic.
📊 How It Works
1️⃣ Percentile Zone Definition
HILO defines two key percentiles from the historical high and low:
• Upper Threshold: 75th Percentile of Highs
• Lower Threshold: 50th Percentile of Lows
These are calculated using linear interpolation to ensure smoother transitions across lookback periods.
2️⃣ Adaptive Signal Line
Instead of using static crossovers, HILO dynamically flips its signal based on whether price exceeds the upper threshold or falls below the lower one.
📌 If price > upper → Signal = Short threshold
📌 If price < lower → Signal = Long threshold
📌 If price remains between thresholds → no flip (trend continuation)
3️⃣ Signal Logic
✅ Long Signal → Price exceeds upper bound while lower bound acts as ceiling
❌ Short Signal → Price breaks below lower percentile while upper bound flips
This simple yet powerful mechanism creates early entries while maintaining high signal confidence.
👁 Visual & Custom Features
• 🎨 Multiple Color Modes: Strategy, Solar, Warm, Cool, Classic, Magic
• 🔄 Dynamic Candle & Band Coloring
• 🏷️ Signal Labels: Optional “𝓛𝓸𝓷𝓰” and “𝓢𝓱𝓸𝓻𝓽” tags when trend flips
• 💬 Alerts Ready: Long/Short crossover conditions can trigger alerts instantly
👥 Who Should Use HILO?
✅ Breakout Traders – Catch early trend starts using percentile filters
✅ Swing Traders – Identify directional bias shifts in advance
✅ Range Strategists – Use band confluence zones to play reversions
✅ Quant & Rule-Based Traders – Incorporate percentile logic into broader systems
⚙️ Customization & Default Settings
Percentile Length:(Default 35) Lookback for calculating percentile thresholds
Lookback Period:(Default 4) Lag factor for interpolation responsiveness
Upper % Threshold: (Default 75) Defines breakout zone from historical highs
Lower % Threshold: (Default 50) Defines retest/accumulation zone from historical lows
📌 How to Use HILO in Trading
1️⃣ Trend-Following Strategy
✔ Enter long when price flips above the adaptive support line
✔ Exit or go short when price breaks below the interpolated resistance
✔ Continue position as long as trend color persists
2️⃣ Range-Reversion Strategy
✔ Buy when price tests the lower threshold and no short signal is triggered
✔ Sell or reduce when price hits the upper range boundary
🧠 Why It Works
HILO operates on the principle that historical price structure creates natural probabilistic thresholds. By interpolating between these using percentile logic, the system maintains adaptability to changing market conditions—without the lag of moving averages or the noise of fixed bands.
🔹 Conclusion
HILO Interpolation is a minimalist yet powerful signal engine built for adaptive breakout and reversion detection. Its percentile-based logic offers a novel way to identify structure shifts, giving traders an edge in both trend and range markets.
🔹 Key Takeaways:
1️⃣ Breakout Entry Logic – Uses percentile interpolation instead of static bands
2️⃣ Color-Driven Clarity – Visual clarity via gradient zone overlays
3️⃣ Trend Integrity – Avoids overfitting and responds only to significant price movements
📌 Disclaimer: Past performance is not indicative of future results. No trading strategy can guarantee success in financial markets.
📌 Strategic Advice: Always backtest, optimize, and align parameters with your trading objectives and risk tolerance before live trading.

Indicator BMS V5 [Traderhood]Introducing BMS (Base Market Strategy)
Overview
Base Market Strategy (BMS) is a trend-following and oscillator indicator designed to detect market trends with high accuracy while providing clear entry signals. BMS utilizes four Exponential Moving Averages (EMA) to filter trends across multiple timeframes and Bollinger Bands (BB) to identify overbought and oversold zones. This approach makes BMS highly suitable for scalping strategies in lower timeframes with a high win rate potential.
Key Features
📈 Multi-EMA Trend Filtering
Uses 4 EMAs to confirm the dominant trend.
Separates trend detection between lower timeframes and H1 for additional validation.
🎯 Dynamic Overbought & Oversold Detection
Sell signal occurs when the price touches the Bollinger Bands Upper.
Buy signal occurs when the price touches the Bollinger Bands Lower.
🔥 High Win Rate Scalping Strategy
Designed to capture quick price movements in trending markets.
Ideal for traders looking for fast executions with controlled risk.
🎨 Customizable Visual Enhancements
Users can adjust indicator colors to match their personal preferences.
How It Works
1️⃣ EMA-Based Trend Identification
The indicator applies 4 EMAs to determine short-term and medium-term trends.
If the price is above all EMAs → Bullish trend.
If the price is below all EMAs → Bearish trend.
2️⃣ Bollinger Bands Signal Generation
Sell Entry: When the price touches Bollinger Bands Upper, indicating an overbought area.
Buy Entry: When the price touches Bollinger Bands Lower, indicating an oversold area.
3️⃣ Scalping Execution
Entries are executed only on lower timeframes with trend confirmation from H1 EMA.
Profit targets are adjusted based on volatility, while stop loss is placed outside the Bollinger Bands.
4️⃣ Visual Customization
Indicator colors can be modified for better visibility.
Practical Applications
✅ Scalping Strategy – Uses Bollinger Bands and EMA filtering for fast trades.
✅ Trend Confirmation – Multi-timeframe EMA validation ensures precise entries.
✅ Dynamic Support & Resistance – Bollinger Bands help identify potential reversals.
✅ Noise Reduction – EMA filtering removes minor price fluctuations for clearer signals.
🛠 Settings
EMA Periods: 4 EMAs for trend filtering.
Bollinger Bands Length: 20 (default), adjustable.
Bollinger Bands Deviation: 2 (default).
Color Customization: Users can personalize indicator colors as needed.
📌 Conclusion
Base Market Strategy (BMS) is a high win-rate scalping indicator, combining trend-following EMA filtering with momentum reversal detection from Bollinger Bands. With a dynamic and adaptive approach, this indicator provides precise entry signals while reducing noise from insignificant price movements.
Key Takeaways:
✔ High Accuracy – A combination of EMA and Bollinger Bands provides clear signals.
✔ Scalping Optimization – Works best on lower timeframes with H1 validation.
✔ Visual Customization – Users can adjust the indicator colors to their preference.
✔ Simple Yet Powerful – Easy to use but highly effective in capturing market opportunities.
🔹 Disclaimer: Trading carries high risks. Always backtest and optimize settings to align with your risk tolerance before live trading.
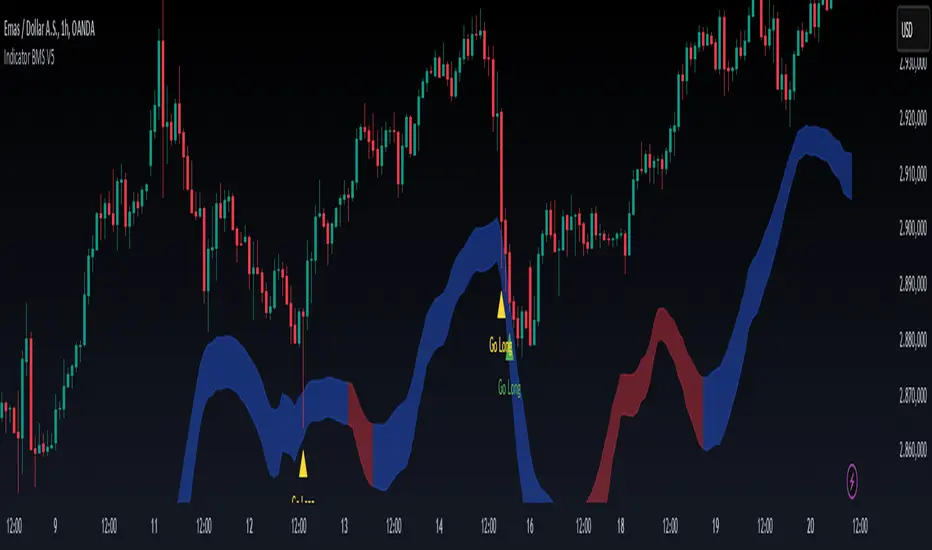
PRC-ALMA | QuantEdgeBIntroducing PRC-ALMA by QuantEdgeB
Overview
The PRC-ALMA (Percentile Adaptive ALMA) is an advanced dynamic trend and volatility filtering indicator that leverages the Arnaud Legoux Moving Average (ALMA) combined with Percentile Rank Filtering and Median Absolute Deviation (MAD) Bands. It is designed to enhance market structure clarity, detect breakout zones, and provide trade signals by dynamically adjusting its filtering based on recent price action.
____
Key Features
1. 📈 Adaptive ALMA Smoothing:
- Uses ALMA for smoothing price action while reducing lag.
- Provides a more responsive moving average than traditional EMAs and SMAs.
2. 📊 Percentile Rank-Based Thresholds:
- Determines upper and lower regions using 75th and 25th percentile ranks.
- Allows for adaptive thresholding based on historical price movements.
3. 🎯 Median Absolute Deviation (MAD) Volatility Filtering:
- Filters out noise using robust statistical deviation measures.
- MAD Bands dynamically adjust based on volatility expansion and contraction.
4. 🔄 Dynamic Trade Signals:
- Generates long signals when price exceeds the upper threshold.
- Generates short signals when price drops below the lower threshold.
5. 🎨 Customizable Color Modes & Visual Enhancements:
- Choose between multiple color schemes to match trading preferences.
- Optional candlestick coloring to indicate market sentiment shifts.
____
How It Works
1. ALMA Calculation:
- The indicator starts by computing the ALMA (Arnaud Legoux Moving Average) with a customizable length, offset, and sigma.
2. Percentile Rank Filtering:
- It then calculates the 75th and 25th percentile ranks over a selected period, determining dynamic levels for trend identification.
3. Volatility Adjustment Using Median Absolute Deviation (MAD):
- MAD is applied to filter noise and adapt the upper/lower bands based on market volatility.
- The higher the MAD multiplier, the wider the bands, allowing more price fluctuations before a signal triggers.
4. Entry & Exit Conditions:
- Long Entry: When price crosses above the upper percentile band + MAD filter.
- Short Entry: When price crosses below the lower percentile band - MAD filter.
5. Visual Enhancements:
- Dynamic band plotting with shading between percentile ranks.
- Candlestick coloring to visually indicate long/short sentiment shifts.
____
Practical Applications
✅ Trend Following & Momentum Trading – Uses ALMA for trend smoothing and percentile-based breakouts.
✅ Mean Reversion Strategies – Adaptive MAD filtering ensures only significant deviations trigger signals.
✅ Multi-Timeframe Trading – Works on intraday, daily, and weekly timeframes based on user customization.
✅ Noise Reduction – Eliminates minor fluctuations while capturing meaningful market moves.
____
🛠 Settings
-ALMA Length: 24 – Defines the smoothing period for the Arnaud Legoux Moving Average.
-ALMA Offset: 0.7 – Adjusts the shift factor, controlling responsiveness.
-ALMA Sigma: 4 – Determines the smoothing strength, balancing trend-following and noise reduction.
-Percentile Length: 21 – Lookback period for calculating percentile rank levels.
-Median Period: 21 – The period used for the Median Absolute Deviation (MAD) filter.
-Median Multiplier: 1.8 – Adjusts the sensitivity of the MAD filter, impacting how signals are generated.
-Color Mode: Strategy – Various visual themes available for better chart readability.
-Signal Label: Off - If turned off the indicator produced a Long or Cash signal when the trend changes.
📌 Conclusion
The PRC-ALMA | QuantEdgeB is an advanced valuation and signal generation tool that dynamically adjusts based on market conditions. By combining ALMA for trend smoothing, percentile rank thresholds, and MAD-based volatility filtering, it provides traders with a versatile indicator for momentum, breakout, and mean reversion strategies.
Key Takeaways:
✔ Smooth & Adaptive – ALMA ensures minimal lag while maintaining trend responsiveness.
✔ Dynamic Overbought/Oversold Zones – Adjusts to real-time market conditions using percentile-based bands.
✔ Volatility-Aware Filtering – Uses MAD to eliminate market noise, making signals more reliable.
✔ Customizable & Multi-Timeframe Ready – Works on various asset classes and timeframes with adjustable settings.
🔹 Disclaimer: Past performance is not indicative of future results. No trading strategy can guarantee success in financial markets.
🔹 Strategic Advice: Always backtest, optimize, and align parameters with your trading objectives and risk tolerance before live trading.

Candle Partition Statistics with IQV and Chi2NOTE: THE FORMULA IN THE CHART IS NOT PART OF THE CODE
This Pine Script calculates statistical measures for candle partitions based on whether a candle is bullish or bearish and whether the price is above or below an EMA. It evaluates statistical properties such as the Index of Qualitative Variation (IQV) and the Chi-Square (χ²) statistic to assess variations in price action.
Concept of Index of Qualitative Variation (IQV)
IQV is a statistical measure used to quantify the diversity or dispersion of categorical variables. In this script, it is used to measure how evenly the four categories of candles (green above EMA, red above EMA, green below EMA, red below EMA) are distributed.
Purpose of IQV in the Script:
IQV ranges from 0 to 1, where 0 indicates no variation (one category dominates) and 1 indicates maximum variation (categories are equally distributed).
A high IQV suggests balanced distributions of bullish/bearish candles above/below the EMA, indicating market uncertainty or mixed sentiment.
A low IQV suggests dominance of a particular candle type, indicating a strong trend.
Concept of Chi-Square (χ²) Test
Chi-square (χ²) is a statistical test that measures the difference between expected and observed frequencies of categorical data. It assesses whether short-term price behavior significantly deviates from historical trends.
Purpose of Chi-Square in the Script:
A high χ² value means that short-term candle distributions are significantly different from historical patterns, indicating potential trend shifts.
If χ² exceeds a predefined significance threshold (chi_threshold), an alert (Chi² Alert!) is triggered.
It helps traders identify periods where recent price behavior deviates from historical norms, possibly signaling trend reversals or market regime changes.
Key Takeaways:
IQV helps measure the diversity of price action, detecting whether the market is balanced or trending.
Chi-square (χ²) identifies significant deviations in short-term price behavior compared to long-term trends.
Both metrics together provide insights into whether the market is stable, trending, or shifting.
The Nasan C-score enhances trend strength by incorporating volatility. It is calculated as:
enhanced_t_s =(𝑡𝑠 × avg_movement x 100)/SMA(𝑐lose)
Key Components:
𝑡𝑠 : Measures trend strength based on price movements relative to EMA.
ts=green_EMAup_a+0.5×red_EMAup_a−(0.5×green_EMAdown_a+red_EMAdown_a)
avg_movement: The SMA of absolute close-open differences, capturing volatility.
Normalization: The division by SMA(close) adjusts the score relative to price levels.
Purpose of the Nasan C-score
Enhanced Trend Strength
It amplifies the trend strength value by factoring in volatility (price movement).
If price volatility is high, trend strength variations have a greater impact.
Volatility-Adjusted Momentum
By scaling 𝑡𝑠 with average movement, the score adjusts to changing price dynamics.
Higher price fluctuations lead to a higher score, making trend shifts more prominent.
How It Can Be Used in Trading
Higher values of Nasan C-score indicate strong bullish or bearish trends.
Comparing it with past values helps determine whether momentum is increasing or fading.
Thresholds can be set to identify significant trend shifts based on historical highs and lows.

MTF- Standard Deviation ChannelWhat Is Standard Deviation?
Standard deviation is a statistical measurement that looks at how far individual points in a dataset are dispersed from the mean of that set. If data points are further from the mean, there is a higher deviation within the data set. It is calculated as the square root of the variance.
Key Takeaways:
Standard deviation measures the dispersion of a dataset relative to its mean.
It is calculated as the square root of the variance.
Standard deviation, in finance, is often used as a measure of the relative riskiness of an asset.
A volatile stock has a high standard deviation, while the deviation of a stable blue-chip stock is usually rather low.
Standard deviation is also used by businesses to assess risk, manage business operations, and plan cash flows based on seasonal changes and volatility.
Source: Investopedia
--------------- UPDATE ---------------
The deviation is calculated automatically. (via stdev function).
--
The targeted timeframe is available in the options (recalculation cycle).
--
If the selected security is a contract the number of days before expiration is automatically managed, otherwise it will use the 'default' options.
---------------------------------------

metaconnectorLibrary "metaconnector"
metaconnector
buy_market_order(License_ID, symbol, lot)
Places a buy market order
Parameters:
License_ID (string) : Unique license ID of the user
symbol (string) : Trading symbol
lot (int) : Number of lots to buy
Returns: String syntax for the buy market order
sell_market_order(License_ID, symbol, lot)
Places a sell market order
Parameters:
License_ID (string) : Unique license ID of the user
symbol (string) : Trading symbol
lot (int) : Number of lots to sell
Returns: String syntax for the sell market order
buy_limit_order(License_ID, symbol, lot, price)
Places a buy limit order
Parameters:
License_ID (string) : Unique license ID of the user
symbol (string) : Trading symbol
lot (int) : Number of lots to buy
price (float) : Limit price for the order
Returns: String syntax for the buy limit order
sell_limit_order(License_ID, symbol, lot, price)
Places a sell limit order
Parameters:
License_ID (string) : Unique license ID of the user
symbol (string) : Trading symbol
lot (int) : Number of lots to sell
price (float) : Limit price for the order
Returns: String syntax for the sell limit order
stoploss_for_buy_order(License_ID, symbol, lot, stoploss_price)
Places a stop-loss order for a buy position
Parameters:
License_ID (string) : Unique license ID of the user
symbol (string) : Trading symbol
lot (int) : Number of lots to buy
stoploss_price (float)
Returns: String syntax for the buy stop-loss order
stoploss_for_sell_order(License_ID, symbol, lot, stoploss_price)
Places a stop-loss order for a sell position
Parameters:
License_ID (string) : Unique license ID of the user
symbol (string) : Trading symbol
lot (int) : Number of lots to sell
stoploss_price (float)
Returns: String syntax for the sell stop-loss order
takeprofit_for_buy_order(License_ID, symbol, lot, target_price)
Places a take-profit order for a buy position
Parameters:
License_ID (string) : Unique license ID of the user
symbol (string) : Trading symbol
lot (int) : Number of lots to buy
target_price (float)
Returns: String syntax for the buy take-profit order
takeprofit_for_sell_order(License_ID, symbol, lot, target_price)
Places a take-profit order for a sell position
Parameters:
License_ID (string) : Unique license ID of the user
symbol (string) : Trading symbol
lot (int) : Number of lots to sell
target_price (float)
Returns: String syntax for the sell take-profit order
buy_stop_order(License_ID, symbol, lot, price)
Places a buy stop order above the current market price
Parameters:
License_ID (string) : Unique license ID of the user
symbol (string) : Trading symbol
lot (int) : Number of lots to buy
price (float) : Stop order price
Returns: String syntax for the buy stop order
sell_stop_order(License_ID, symbol, lot, price)
Places a sell stop order below the current market price
Parameters:
License_ID (string) : Unique license ID of the user
symbol (string) : Trading symbol
lot (int) : Number of lots to sell
price (float) : Stop order price
Returns: String syntax for the sell stop order
close_all_positions(License_ID, symbol)
Closes all positions for a specific symbol
Parameters:
License_ID (string) : Unique license ID of the user
symbol (string) : Trading symbol
Returns: String syntax for closing all positions
close_buy_positions(License_ID, symbol)
Closes all buy positions for a specific symbol
Parameters:
License_ID (string) : Unique license ID of the user
symbol (string) : Trading symbol
Returns: String syntax for closing all buy positions
close_sell_positions(License_ID, symbol)
Closes all sell positions for a specific symbol
Parameters:
License_ID (string) : Unique license ID of the user
symbol (string) : Trading symbol
Returns: String syntax for closing all sell positions
close_partial_buy_position(License_ID, symbol, lot)
Closes a partial buy position for a specific symbol
Parameters:
License_ID (string) : Unique license ID of the user
symbol (string) : Trading symbol
lot (int) : Number of lots to close
Returns: String syntax for closing a partial buy position
close_partial_sell_position(License_ID, symbol, lot)
Closes a partial sell position for a specific symbol
Parameters:
License_ID (string) : Unique license ID of the user
symbol (string) : Trading symbol
lot (int) : Number of lots to close
Returns: String syntax for closing a partial sell position

Fibonacci Channel Standard Deviation levels based off 200MAThis script dynamically combines Fibonacci levels with the 200-period simple moving average (SMA), offering a powerful tool for identifying high-probability support and resistance zones. By adjusting to the changing 200 SMA, the script remains relevant across different market phases.
Key Features:
Dynamic Fibonacci Levels:
The script automatically calculates Fibonacci retracements and extensions relative to the 200 SMA.
These levels adapt to market trends, offering more relevant zones compared to static Fibonacci tools.
Support and Resistance Zones:
In uptrends, price often respects retracement levels above the 200 SMA (e.g., 38.2%, 50%, 61.8%).
In downtrends, price may interact with retracements and extensions below the 200 SMA (e.g., 23.6%, 1.618).
Customizable Confluence Zones:
Key levels such as the golden pocket (61.8%–65%) are highlighted as high-probability zones for reversals or continuations.
Extensions (e.g., 1.618) can serve as profit targets or bearish continuation points.
Practical Applications:
Identifying Reversal Zones:
Look for confluence between Fibonacci levels and the 200 SMA to identify potential reversal points.
Example: A pullback to the 61.8%–65% golden pocket near the 200 SMA often signals a bullish reversal.
Trend Confirmation:
In uptrends, price respecting Fibonacci retracements above the 200 SMA (e.g., 38.2%, 50%) confirms strength.
Use Fibonacci extensions (e.g., 1.618) as profit targets during strong trends.
Dynamic Risk Management:
Place stop-losses just below key Fibonacci retracement levels near the 200 SMA to minimize risk.
Bearish Scenarios:
Below the 200 SMA, Fibonacci retracements and extensions act as resistance levels and bearish targets.
How to Use:
Volume Confirmation: Watch for volume spikes near Fibonacci levels to confirm support or resistance.
Price Action: Combine with candlestick patterns (e.g., engulfing candles, pin bars) for precise entries.
Trend Indicators: Use in conjunction with shorter moving averages or RSI to confirm market direction.
Example Setup:
Scenario: Price retraces to the 61.8% Fibonacci level while holding above the 200 SMA.
Confirmation: Volume spikes, and a bullish engulfing candle forms.
Action: Enter long with a stop-loss just below the 200 SMA and target extensions like 1.618.
Key Takeaways:
The 200 SMA serves as a reliable long-term trend anchor.
Fibonacci retracements and extensions provide dynamic zones for trade entries, exits, and risk management.
Combining this tool with volume, price action, or other indicators enhances its effectiveness.
Milvetti_TraderPost_LibraryLibrary "Milvetti_TraderPost_Library"
This library has methods that provide practical signal transmission for traderpost.Developed By Milvetti
cancelOrders(symbol)
This method generates a signal in JSON format that cancels all orders for the specified pair. (If you want to cancel stop loss and takeprofit orders together, use the “exitOrder” method.
Parameters:
symbol (string)
exitOrders(symbol)
This method generates a signal in JSON format that close all orders for the specified pair.
Parameters:
symbol (string)
createOrder(ticker, positionType, orderType, entryPrice, signalPrice, qtyType, qty, stopLoss, stopType, stopValue, takeProfit, profitType, profitValue, timeInForce)
This function is designed to send buy or sell orders to traderpost. It can create customized orders by flexibly specifying parameters such as order type, position type, entry price, quantity calculation method, stop-loss, and take-profit. The purpose of the function is to consolidate all necessary details for opening a position into a single structure and present it as a structured JSON output. This format can be sent to trading platforms via webhooks.
Parameters:
ticker (string) : The ticker symbol of the instrument. Default value is the current chart's ticker (syminfo.ticker).
positionType (string) : Determines the type of order (e.g., "long" or "buy" for buying and "short" or "sell" for selling).
orderType (string) : Defines the order type for execution. Options: "market", "limit", "stop". Default is "market"
entryPrice (float) : The price level for entry orders. Only applicable for limit or stop orders. Default is 0 (market orders ignore this).
signalPrice (float) : Optional. Only necessary when using relative take profit or stop losses, and the broker does not support fetching quotes to perform the calculation. Default is 0
qtyType (string) : Determines how the order quantity is calculated. Options: "fixed_quantity", "dollar_amount", "percent_of_equity", "percent_of_position".
qty (float) : Quantity value. Can represent units of shares/contracts or a dollar amount, depending on qtyType.
stopLoss (bool) : Enable or disable stop-loss functionality. Set to `true` to activate.
stopType (string) : Specifies the stop-loss calculation type. Options: percent, "amount", "stopPrice", "trailPercent", "trailAmount". Default is "stopPrice"
stopValue (float) : Stop-loss value based on stopType. Can be a percentage, dollar amount, or a specific stop price. Default is "stopPrice"
takeProfit (bool) : Enable or disable take-profit functionality. Set to `true` to activate.
profitType (string) : Specifies the take-profit calculation type. Options: "percent", "amount", "limitPrice". Default is "limitPrice"
profitValue (float) : Take-profit value based on profitType. Can be a percentage, dollar amount, or a specific limit price. Default is 0
timeInForce (string) : The time in force for your order. Options: day, gtc, opg, cls, ioc and fok
Returns: Return result in Json format.
addTsl(symbol, stopType, stopValue, price)
This method adds trailing stop loss to the current position. “Price” is the trailing stop loss starting level. You can leave price blank if you want it to start immediately
Parameters:
symbol (string)
stopType (string) : Specifies the trailing stoploss calculation type. Options: "trailPercent", "trailAmount".
stopValue (float) : Stop-loss value based on stopType. Can be a percentage, dollar amount.
price (float) : The trailing stop loss starting level. You can leave price blank if you want it to start immediately. Default is current price.
Earnings Surprise Indicator (Post-Earnings Announcement Drift)What It Does:
- Displays a company's actual earnings vs. analysts' estimates over time
- Shows "earnings surprises" - when actual results beat or miss expectations
- Helps identify trends in a company's financial performance
How It Works:
- Green bars: Positive surprise (earnings beat estimates)
- Red bars: Negative surprise (earnings missed estimates)
- Yellow line: Analysts' earnings estimates
Correlation with Post Earnings Announcement Drift (PEAD): PEAD is the tendency for a stock's price to drift in the direction of an earnings surprise for several weeks or months after the announcement.
Why It Matters:
- Positive surprises often lead to upward price drift
- Negative surprises often lead to downward price drift
- This drift can create trading opportunities
How to Use It:
1. Spot Trends:
- Consistent beats may indicate strong company performance
- Consistent misses may signal underlying issues
2. Gauge Market Expectations:
- Large surprises may lead to significant price movements
3. Timing Decisions:
- Consider long positions after positive surprises
- Consider short positions or exits after negative surprises
4. Risk Management:
- Be cautious of reversal if the drift seems excessive
- Use in conjunction with other technical and fundamental analysis
Key Takeaways:
- Earnings surprises can be fundamental-leading indicators of future stock performance, especially when correlated with analyst projections
- PEAD suggests that markets often underreact to earnings news initially
- This indicator helps visualize the magnitude and direction of surprises
- It can be a valuable tool for timing entry and exit points in trades