YinYang TrendTrend Analysis has always been an important aspect of Trading. There are so many important types of Trend Analysis and many times it may be difficult to identify what to use; let alone if an Indicator can/should be used in conjunction with another. For these exact reasons, we decided to make YinYang Trend. It is a Trend Analysis Toolkit which features many New and many Well Known Trend Analysis Indicators. However, everything in there is added specifically for the reason that it may work well in conjunction with the other Indicators prevalent within. You may be wondering, why bother including common Trend Analysis, why not make everything unique? Ideally, we would, however, you need to remember Trend Analysis may be one of the most common forms of charting. Therefore, many other traders may be using similar Trend Analysis either through plotting manually or within other Indicators. This all boils down to Psychology; you are trading against other traders, who may be seeing some of the similar information you are, and therefore, you may likewise want to see this information. What affects their trading decisions may affect yours as well.
Now enough about Trend Analysis, what is within this Indicator, and what does it do? Well, first let’s quickly mention all of its components, then we will, through a Tutorial, discuss each individually and finally how each comes together as a cohesive whole. This Indicator features many aspects:
Bull and Bear Signals
Take Profit Signals
Bull and Bear Zones
Information Tables displaying: (Boom Meter, Bull/Bear Strength, Yin/Yang State)
16 Cipher Signals
Extremes
Pivots
Trend Lines
Custom Bollinger Bands
Boom Meter Bar Colors
True Value Zones
Bar Strength Indexes
Volume Profile
There are many things to cover within our Tutorial so let's get started, chronologically from the list above.
Tutorial:
Bull and Bear Signals:
We’ve zoomed out quite a bit for this example to help give you a broader aspect of how these Bull and Bear signals work. When a signal appears, it is displaying that there may be a large amount of Bullish or Bearish Trend Analysis occurring. These signals will remain in their state of Bull or Bear until there is enough momentum change that they change over. There are a couple Options within the Settings that dictate when/where/why these signals appear, and this example is using their default Settings of ‘Medium’. They are, Purchase Speed and Purchase Strength. Purchase Speed refers to how much Price Movement is needed for a signal to occur and Purchase Strength refers to how many verifications are required for a signal to occur. For instance:
'High' uses 15 verifications to ensure signal strength.
'Medium' uses 10 verifications to ensure signal strength.
'Low' uses 5 verifications to ensure signal strength.
'Very Low' uses 3 verifications to ensure signal strength.
By default it is set to Medium (10 verifications). This means each verification is worth 10%. The verifications used are also relevant to the Purchase Speed; meaning they will be verified faster or slower depending on its speed setting. You may find that Faster Speeds and Lower Verifications may work better on Higher Time Frames; and Slower Speeds and Higher Verifications may work better on Lower Time Frames.
We will demonstrate a few examples as to how the Speed and Strength Settings work, and why it may be beneficial to adjust based on the Time Frame you’re on:
In this example above, we’ve kept the same Time Frame (1 Day), and scope; but we’ve changed Purchase Speed from Medium->Fast and Purchase Strength from Medium-Very Low. As you can see, it now generates quite a few more signals. The Speed and Strength settings that you use will likely be based on your trading style / strategy. Are you someone who likes to stay in trades longer or do you like to swing trade daily? Likewise, how do you go about identifying your Entry / Exit locations; do you start on the 1 Day for confirmation, then move to the 15/5 minute for your entry / exit? How you trade may determine which Speed and Strength settings work right for you. Let's jump to a lower Time Frame now so you can see how it works on the 15/5 minute.
Above is what BTC/USDT looks like on the 15 Minute Time Frame with Purchase Speed and Strength set to Medium. You may note that the signals require a certain amount of movement before they get started. This is normal with Medium and the amount of movement is generally dictated by the Time Frame. You may choose to use Medium on a Lower Time Frame as it may work well, but it may also be best to change it to a little slower.
We are still on the 15 Minute Time Frame here, however we simply changed Purchase Speed from Medium->Slow. As you can see, lots of the signals have been removed. Now signals may ‘hold their ground’ for much longer. It is important to adjust your Purchase Speed and Strength Settings to your Time Frame and personalized trading style accordingly.
Above we have now jumped down to the 5 Minute Time Frame. Our Purchase Speed is Slow and our Purchase Strength is Medium. We can see it looks pretty good, although there is some signal clustering going on in the middle there. If we change our Settings, we may be able to get rid of that.
We have changed our Purchase Speed from Slow->Snail (Slowest it can go) and Purchase Strength from Medium->Very Low (Lowest it can go). Changing it from Slow-Snail helped get rid of the signal clustering. You may be wondering why we lowered the Strength from Medium->Very Low, rather than going from Medium->High. This is a use case scenario and one you’ll need to decide for yourself, but we noticed when we changed the Speed from Slow->Snail that the signal clustering was gone, so then we checked both High and Very Low for Strengths to see which produced the best looking signal locations.
Please remember, you don’t have to use it the exact way we’ve displayed in this Tutorial. It is meant to be used to suit your Trading Style and Strategy. This is why we allow you to modify these settings, rather than just automating the change based on Time Frames. You’ll likely need to play around with it, as you’ll notice different settings may work better on certain pairs and Time Frames than others.
Take Profit Signals:
We’ve reset our Purchase Settings, everything is on defaults right now at Medium. We’ve enabled Take Profit signals. As you can see there are both Take Profit signals for the Bulls and the Bears. These signals are not meant to be used within automation. In fact, none of this indicator is. These signals are meant to show there has been a strong change in momentum, to such an extent that the signal may switch from its current (Bull or Bear) and now may be a good time to Take Profit. Your Take Profit Settings likewise has a Speed and Strength, and you can set them differently than your Purchase Settings. This is in case you want to Take Profit in a different manner than your Purchase Signals. For instance:
In the example above we’ve kept Purchase Strength and Speed at Medium but we changed our Take Profit Speed from Medium->Snail and our Take Profit Strength from medium->Very Low. This greatly reduces the amount of Take Profit signals, and in some cases, none are even produced. This form of Take Profit may act more as a Trailing Take Profit that if it’s not hit, nothing appears.
In this example we have changed our Purchase Speed from Medium->Fast, our Purchase Strength from Medium->Very Low. We’ve also changed our Take Profit Speed from Snail->Medium and kept our Take Profit Strength on Very Low. Now we may get our signals quicker and likewise our Take Profit may be more rare. There are many different ways you can set up your Purchase and Take Profit Settings to fit your Trading Style / Strategy.
Bull and Bear Zones:
We have disabled our Take Profit locations so that you can see the Bull and Bear Zones. These zones change color when the Signals switch. They may represent some strong Support and Resistance locations, but more importantly may be useful for visualizing changes in momentum and consolidation. These zones allow you to see various Moving Averages; and when they start to ‘fold’ (cross) each other you may see changes in momentum. Whereas, when they’re fully stretched out and moving all in the same direction, it can provide insight that the current rally may be strong. There is also the case where they look like they’re ‘twisted’ together. This happens when all of the Moving Averages are very close together and may be a sign of Consolidation. We will go over a few examples of each of these scenarios so you can understand what we’re referring to.
In this example above, there are a few different things happening. First we have the yellow circle, where the final and slowest Moving Average (MA) crossed over and now all of the MA’s that form the zone are Bullish. You can see this in the white circle where there are no MA’s that are crossing each other. Lastly, within the blue circle, we can see how some of the faster MA’s are crossing under each other. This is a bullish momentum change. The Faster moving MA’s will always be the first ones to cross before the Slower ones do. There is a color scheme in place here to represent the Speed of the MA within the Zone. Light blue is the fastest moving Bull color -> Light Green and finally -> Dark Green. Yellow is the fastest moving Bear color -> Orange and finally -> Red / Dark Red within the Zone.
Next we will review a couple different examples of what Consolidation looks like and why it is very important to look out for. Consolidation is when Most, if not All of the MA’s are very tightly ‘twisted’ together. There is very little spacing between almost all of the MA’s in the example above; highlighted by the white circle. Consolidation is important as it may indicate a strong price movement in either direction will occur soon. When the price is consolidating it means it has had very little upwards or downwards movement recently. When this happens for long enough, MA’s may all get very similar in value. This may cause high volatility as the price tries to break out of Consolidation. Let's look at another example.
Above we have two more examples of what Consolidation looks like and how high Volatility may occur after the Consolidation is broken. Please note, not all Consolidation will create high Volatility but it is something you may want to look out for.
Information Tables displaying: (Boom Meter, Bull/Bear Strength, Yin/Yang State):
Information tables are a very important way of displaying information. It contains 3 crucial pieces of information:
Boom Meter
Bull/Bear Strength
Yin/Yang State
Boom Meter is a meter that goes from 0-100% and displays whether the current price is Dumping (0 - 29%), Consolidating (30 - 70%) or Pumping (71 - 100%). The Boom Meter is meant to be a Gauge to how the price is currently fairing. It is composed of ~50 different calculations that all vary different weights to calculate its %. Many of the calculations it uses are likewise used in other things, such as the Bull/Bear Strength, Bull/Bear Zone MA cross’, Yin/Yang State, Market Cipher Signals, RSI, Volume and a few others. The Boom Meter, although not meant to be used solely to make purchase decisions, may give you a good idea of current market conditions considering how many different things it evaluates.
Bull/Bear Strength is relevant to your Purchase Speed and Strength. It displays which state it is currently in, and the % it is within that state. When a % hits 0, is when the state changes. When states change, they always start at 100% initially and will go down at the rate of Purchase Strength (how many verifications are needed). For instance, if your Purchase Strength is set to ‘Medium’ it will move 10% per verification +/-, if it is set to High, it will move 6.67% per verification +/-. Bull/Bear Strength is a good indicator of how well that current state is fairing. For instance if you started a Long when the state changed to Bull and now it is currently at Bull with 20% left, that may be a good indication it is time to get out (obviously refer to other data as well, but it may be a good way to know that the state is 20% away from transitioning to Bear).
Yin/Yang State is the strongest MA cross within our Indicator. It is unique in the sense that it is slow to change, but not so much that it moves slowly. It isn’t as simple as say a Golden/Death Cross (50/200), but it crosses more often and may hold similar weight as it. Yin stands for Negative (Bearish) and Yang stands for Positive (Bullish). The price will always be in either a state of Yin or Yang, and just because it is in one, doesn’t mean the price can’t/won’t move in the opposite direction; it simply means the price may be favoring the state it is in.
16 Cipher Signals:
Cipher Signals are key visuals of MA cross’ that may represent price movement and momentum. It would be too confusing and hard to decipher these MA’s as lines on a chart, and therefore we decided to use signals in the form of symbols instead. There are 12 Standard and 4 Predictive/Confirming Cipher signals. The Standard Cipher signals are composed of 6 Bullish and 6 Bearish (they all have opposites that balance each other out). There can never be 2 of the same signal in a row, as the Bull and Bear cancel each other out and it's always in a state of one or the other. When all 6 Bullish or Bearish signals appear in a row, very closely together, without any of the opposing signals it may represent a strong momentum movement is about to occur.
If you refer to the example above, you’ll see that the 6 Bullish Cipher signals appeared exactly as mentioned above. Shortly after the Green Circle appeared, there was a large spike in price movement in favor of the Bulls. Cipher signals don’t need to appear in a cluster exactly like the white circle in this photo for momentum to occur, but when it does, it may represent volatility more than if it is broken up with opposing signals or spaced out over a longer time span.
Above is an example of the opposite, where all 6 Bearish Cipher signals appeared together without being broken by a Bullish Cipher signal or being too far spaced out. As you can see, even though past it there was a few Bullish signals, they were quickly reversed back to Bearish before a large price movement occurred in favor of the Bears.
In the example above we’ve changed Cipher signals to Predictive and Confirming. Support Crosses (Green +) and Blood Diamonds (Red ♦) are the normal Cipher Signals that appear within the Standard Set. They are the first Cipher Signal that appears and are the most common ones as well. However, just because they are the first, that doesn’t mean they aren’t a powerful Cipher signal. For this reason, there are Predictive and Confirming Cipher signals for these. The Predictive do just that, they appear slightly sooner (if not the same bar) as the regular and the Confirming appear later (1+ bars usually). There will be times that the Predictive appears, but it doesn’t resort to the Regular appearing, or the Regular appears and the Confirming doesn’t. This is normal behavior and also the purpose of them. They are meant to be an indication of IF they may appear soon and IF the regular was indeed a valid signal.
Extremes:
Extremes are MA’s that have a very large length. They are useful for seeing Cross’ and Support and Resistance over a long period of time. However, because they are so long and slow moving, they might not always be relevant. It’s usually advised to turn them on, see if any are close to the current price point, and if they aren’t to turn them off. The main reason being is they stretch out the chart too much if they’re too far away and they also may not be relevant at that point.
When they are close to the price however, they may act as strong Support and Resistance locations as circled in the example above.
Pivots:
Pivots are used to help identify key Support and Resistance locations. They adjust on their own in an attempt to keep their locations as relevant as possible and likewise will adjust when the price pushes their current bounds. They may be useful for seeing when the Price is currently testing their level as this may represent Overbought or Oversold. Keep in mind, just because the price is testing their levels doesn’t mean it will correct; sometimes with high volatility or geopolitical news, movement may continue even if it is exhibiting Overbought or Oversold traits. Pivots may also be useful for seeing how far the price may correct to, giving you a benchmark for potential Take Profit and Stop Loss locations.
Trend Lines:
Trend Lines may be useful for identifying Support and Resistance locations on the Vertical. Trend Lines may form many different patterns, such as Pennants, Channels, Flags and Wedges. These formations may help predict and drive the price in specific directions. Many traders draw or use Indicators to help create Trend Lines to visualize where these formations will be and they may be very useful alone even for identifying possible Support and Resistance locations.
If you refer to the previous example, and now to this example, you’ll notice that the Trend Line that supported it in 2023 was actually created in June 2020 (yellow circle). Trend Lines may be crucial for identifying Support and Resistance locations on the Vertical that may withhold over time.
Custom Bollinger Bands:
Bollinger Bands are used to help see Movement vs Consolidation Zones (When it's wide vs narrow). It's also very useful for seeing where the correction areas may be. Price may bounce between top and bottom of the Bollinger Bands, unless in a pump or dump. The Boom Meter will show you whether it is currently: Dumping, Consolidation or Pumping. If combined with Boom Meter Bar Colors it may be a good indication if it will break the Bollinger Band (go outside of it). The Middle Line of the Bollinger Band (White Line) may be a very strong support / resistance location. If the price closes above or below it, it may be a good indication of the trend changing (it may indicate one of the first stages to a pump or dump). The color of the Bollinger Bands change based on if it is within a Bull or Bear Zone.
What makes this Bollinger Band special is not only that it uses a custom multiplier, but it also incorporates volume to help add weight to the calculation.
Boom Meter Bar Colors:
Boom Meter Bar Colors are a way to see potential Overbought and Oversold locations on a per bar basis. There are 6 different colors within the Boom Meter bar colors. You have:
Overbought and Very Bullish = Dark Green
Overbought and Slightly Bullish = Light Green
Overbought and Slight Bearish = Light Red
Oversold and Very Bearish = Dark Red
Oversold and Slightly Bearish = Orange
Oversold and Slightly Bullish = Light Purple
When there is no Boom Meter Bar Color prevalent there won’t be a color change within the bar at all.
Just because there is a Boom Meter Bar Color change doesn’t mean you should act on it purchase or sell wise, but it may be an indication as to how that bar is fairing in an Overbought / Oversold perspective. Boom Meter Bar Colors are mainly based on RSI but do take in other factors like price movement to determine if it is Overbought or Oversold. When it comes to Boom Meter Bar Color, you should take it as it is, in the sense that it may be useful for seeing how Individual bars are fairing, but also note that there may be things such as:
When there is Very Overbought (Dark Green) or Very Oversold (Dark Red), during massive pump or dumps, it will maintain this color. However, once it has lost ‘some’ momentum it will likely lose this color.
When there has been a massive Pump or Dump, and there is likewise a light purple or light red, this may mean there is a correction or consolidation incoming.
True Value Zones:
True Value zones are our custom way of displaying something that is similar to a Bollinger Band that can likewise twist like an MA cross. The main purpose of it is to display where the price may reside within. Much like a Bollinger Band it has its High and Low within its zone to specify this location. Since it has the ability to cross over and under, it has the ability to specify what it thinks may be a Bullish or Bearish zone. This zone uses its upper level to display what may be a Resistance location and its lower level to display what may be a Support location. These Support and Resistance locations are based on Momentum and will move with the price in an attempt to stay relevant.
You may use these True Values zones as a gauge of if the price is Overbought or Oversold. When the price faces high volatility and moves outside of the True Value Zones, it may face consolidation or likewise a correction to bring it back within these zones. These zones may act as a guideline towards where the price is currently valued at and may belong within.
Bar Strength Indexes:
Bar Strength Indexes are our way of ranking each bar in correlation to the last few. It is based on a few things but is highly influenced on Open/Close/High/Low, Volume and how the price has moved recently. They may attempt to ‘rate’ each bar and how Bullish/Bearish each of these bars are. The Green number under the bar is its Bullish % and the Red number above the bar is its Bearish %. These %’s will always equal 100% when combined together. Bar Strength Indexes may be useful for seeing when either Bullish or Bearish momentum is picking up or when there may be a reversal / consolidation.
These Bar Strength Indexes may allow you to decipher different states. If you refer to the example above, you may notice how based on how the numbers are changing, you may see when it has entered / exited Bullish, Bearish and Consolidation. Likewise, if you refer to the current bar (yellow circle), you can see that the Bullish % has dropped from 93 to 49; this may be signifying that the Bullish movement is losing momentum. You may use these changes in Bar Indexes as a guide to when to enter / end trades.
Volume Profile:
Volume Profile has been something that has been within TradingView for quite some time. It is a very useful way of seeing at what Horizontal Price there has been the most volume. This may be very useful for seeing not only Support and Resistance locations based on Volume, but also seeing where the majority of Limit Orders are placed. Limit Orders are where traders decide they want to either Buy / Sell but have the order placed so the trade won’t happen until the price reaches a certain amount. Either through many orders from many traders, or a single order from a ‘Whale’ (trader with a lot of capital); you may see Support and Resistance at specific Price Points that have large Volume.
Many Volume Profile Indicators feature a breakdown of all the different locations of volume, along with a Point Of Control (POC) line to designate where the most Volume has been. To try and reduce clutter within our already very saturated Toolkit Indicator, we’ve decided to strip our Volume Profile to only display this POC line. This may allow you to see where the crucial Volume Support and Resistance is without all of the clutter.
You may be wondering, well how important is this Volume Profile POC line and how do I go about using it? Aside from it being a gauge towards where Support and Resistance may be within Volume, it may also be useful for identifying good Long/Short locations. If you think of the line as a ‘Battle’ between the Bulls and Bears, they’re both fighting over that line. The Bears are wanting to break through it downwards, and the Bulls are wanting to break through it upwards. When one side has temporarily won this battle, this means they may have more Capital to push the price in their direction. For instance, if both the Bulls and the Bears are fighting over this POC price, that means the Bears think that price is a good spot to sell; however, the Bulls also deem that price to be a good point to buy. If the Bulls were to win this battle, that means the Bears either canceled their orders to reevaluate, or all of their orders have been completed from the Bulls buying them all. What may happen after that is, if the Bulls were able to purchase all of these Limit Sell Orders, then they may still have more Capital left to continue to pressure the price upwards. The same may be true for if the Bears were to win this ‘Battle’.
How to use YinYang Trend as a cohesive whole:
Hopefully you’ve read and understand how each aspect of this Indicator works on its own, as knowing how/what they each do is important to understanding how it is used as a cohesive whole. Due to the fact that this Toolkit of an Indicator displays so much data, you may find it easier to use and understand when you’re zoomed in a little, somewhat like we are in this example above.
If we refer to the example above, you may like us, deduce a few things:
1. The current price may be VERY Overbought. This may be seen by a few different things:
The Boom Meter Bar Colors have been exhibiting a Dark Green color for 6 bars in a row.
The price has continuously been moving the High (red) Pivot Upwards.
Our Boom Meter displays ‘Pumping’ at 100%.
The price broke through a Downward Trend Line that was created in February of 2022 at 45,000 like it was nothing.
The Bar Strength Index hit a Bullish value of 93%.
The Price broke out of the Bollinger Bands and continues to test its upper levels.
The Low is much greater than our fastest moving MA that creates the Purchase Zones.
The Price is vastly outside of the True Value Zone.
The Bar Strength Index of our current bar is 50% bullish, which is a massive decrease from the previous bar of 93%. This may indicate that a correction is coming soon.
2. Since we’ve identified the current price may be VERY Overbought, next we need to identify if/when/to where it may correct to:
We’ve created a new example here to display potential correction areas. There are a few places it has the ability to correct to / within:
The downward Trend Line (red) below the current bar sitting currently at 32,750. This downward Trend Line is at the same price point as the Fastest MA of our Purchase Zone which may provide some decent Support there.
Between two crucial Pivot heights, within a zone of 30,000 to 31,815. This zone has the second fastest MA from the Purchase Zone right near the middle of it at 31,200 which may act as a Support within the Zone. Likewise there is the Bollinger Band Basis which is also resting at 30,000 which may provide a strong Support location here.
If 30,000 fails there may be a correction all the way to the bottom of our True Value Zone and the top of one of our Extremes at 27,850.
If 27,850 fails it may correct all the way to the bottom of our Purchase Zone / lowest of our Extremes at 27,350.
If all of the above fails, it may test our Volume Profile POC of 26,430. If this POC fails, the trend may switch to Bearish and continue further down to lower levels of Support.
The price can always correct more than the prices mentioned above, but considering overall this Indicator is favoring the Bulls, we will tailor this analysis in Favor of the Bullish Momentum maintaining even during this correction. For these reasons, we think the price may correct between the 30,000 and 31,815 zone before continuing upwards and maintaining this Bullish Momentum.
Please note, these correction estimates are just that, they’re estimates. Aside from the fact that the price is very overbought right now and our Bar Strength Index may be declining (bar hasn’t closed yet); the Boom Meter Strength remains at 100%, meaning there may not be much Bearish momentum changes happening yet. We just want to show you how an Preemptive analysis may be done before there are even Bearish Cipher Signals appearing.
Using this Indicator, you may be able to decipher Entry and Exits. In the previous example, we went over how you may use it to see where a correction (Exit / Take Profit) may be and how far this correction may go. In this example above we will be discussing how to identify Entry locations. We will be discussing a Bullish Buy entry but the same rules apply for a Bearish Sell Entry just the opposite with the Cipher Signals.
If you refer to where we circled in white, this is where the Purchase Zones faced Consolidation. When the Purchase Zones all get tight and close together like that, this may represent Volatility and Momentum in either direction may occur soon.
This was then followed by all 6 of the Standard Cipher Signals closely in succession to each other. This means the Momentum may be favoring the Bulls. If this was likewise all 6 of the Bearish Cipher Signals closely in succession, than the momentum change would favor the Bears.
If you were looking for an entry, and you saw Consolidation with the Purchase Zones and then shortly after you saw the Green Circle and Blue Flag (they can swap order); this may now be a good Entry location.
We will conclude this Tutorial here. Hopefully this has taught you how this Trend Analysis Toolkit may help you locate multiple different types of important Support and Resistance locations; as well as possible Entry and Exit locations.
Settings:
1. Bull/Bear Zones:
1.1. Purchase Speed (Bull/Bear Signals and Take Profit Signals):
Speed determines how much price movement is needed for a signal to occur.
'Sonic' uses the extremities to try and get you the best entry and exit points, but is so quick, its speed may reduce accuracy.
'Fast' may attempt to capitalize on price movements to help you get SOME or attempt to lose LITTLE quickly.
'Medium' may attempt to get you the most optimal entry and exit locations, but may miss extremities.
'Slow' may stay in trades until it is clear that momentum has changed.
'Snail' may stay in trades even if momentum has changed. Snail may only change when the price has moved significantly (This may result in BIG gains, but potentially also BIG losses).
1.2. Purchase Strength (Bull/Bear Signals and Take Profit Signals):
Strength ensures a certain amount of verifications required for signals to happen. The more verifications the more accurate that signal is, but it may also change entry and exit points, and you may miss out on some of the extremities. It is highly advised to find the best combination between Speed and Strength for the TimeFrame and Pair you are trading in, as all pairs and TimeFrames move differently.
'High' uses 15 verifications to ensure signal strength.
'Medium' uses 10 verifications to ensure signal strength.
'Low' uses 5 verifications to ensure signal strength.
'Very Low' uses 3 verifications to ensure signal strength.
2. Cipher Signals:
Cipher Signals are very strong EMA and SMA crosses, which may drastically help visualize movement and help you to predict where the price will go. All Symbols have counter opposites that cancel each other out (YinYang). Here is a list, in order of general appearance and strength:
White Cross / Diamond (Predictive): The initial indicator showing trend movement.
Green Cross / Diamond (Regular): Confirms the Predictive and may add a fair bit of strength to trend movement.
Blue Cross / Diamond (Confirming): Confirms the Regular, showing the trend might have some decent momentum now.
Green / Red X: Gives momentum to the current trend direction, possibly confirming the Confirming Cross/Diamond.
Blue / Orange Triangle: may confirm the X, Possible pump / dump of decent size may be coming soon.
Green / Red Circle: EITHER confirms the Triangle and may mean big pump / dump is potentially coming, OR it just hit its peak and signifies a potential reversal correction. PAY ATTENTION!
Green / Red Flag: Oddball that helps confirm trend movements on the short term.
Blue / Yellow Flag: Oddball that helps confirm trend movements on the medium term (Yin / Yang is the long term Oddball).
3. Bull/Bear Signals:
Bear and Bull signals are where the momentum has changed enough based on your Purchase Speed and Strength. They generally represent strong price movement in the direction of the signal, and may be more reliable on higher TimeFrames. Please don’t use JUST these signals for analysis, they are only meant to be a fraction of the important data you are using to make your technical analysis.
4. Take Profit Signals:
Take Profit signals are guidelines that momentum has started to change back and now may be a good time to take profit. Your Take Profit signals are based on your Take Profit Speed and Strength and may be adjusted to fit your trading style.
5. Information Tables:
Information tables display very important data and help to declutter the screen as they are much less intrusive compared to labels. Our Information tables display: Boom Meter, Purchase Strength of Bull/Bear Zones and Yin/Yang State.
Boom Meter: Uses over 50 different calculations to determine if the pair is currently 'Dumping' (0-29%), 'Consolidating' (30-70%), or 'Pumping' (71-100%).
Bull / Bear Strength: Shows the strength of the current Bull / Bear signal from 0-100% (Signals start at 100% and change when they hit 0%). The % it moves up or down is based on your 'Purchase Strength'.
Yin / Yang state: Is one of the strongest EMA/SMA crosses (long term Oddball) within this Indicator and may be a great indication of which way the price is moving. Do keep in mind if the price is consolidating when changing state, it may have the highest chance of switching back also. Once momentum kicks in and there is price movement the state may be confirmed. Refer to other Cipher Symbols, Extremes, Trend, BOLL, Boom %, Bull / Bear % and Bar colors when Bull / Bear Zones are consolidating and Yin / Yang State changes as this is a very strong indecision zone.
6. Bull / Bear Zones:
Our Bull / Bear zones are composed of 8 very important EMA lengths that may act as not only Support and Resistance, but they help to potentially display consolidation and momentum change. You can tell when they are getting tight and close together it may represent consolidation and when they start to flip over on each other it may represent a change in momentum.
7. MA Extremes:
Our MA Extremes may be 3 of the most important long term moving averages. They don’t always play a role in trades as sometimes they’re way off from the price (cause they’re extreme lengths), but when they are around price or they cross under or over each other, it may represent large changes in price are about to occur. They may be very useful for seeing strong resistance / support locations based on price averages. Extremes may transition from a Support to a Resistance based on its position above or below them and how many times the price has either bounced up off them (Supporting) or Bounced back down after hitting them (Resistance).
8. Pivots:
Pivots may be a very important indicator of support and resistance for horizontal price movement. Pivots may represent the current strongest Support and Resistance. When the Pivot changes, it means a new strong Support or Resistance has been created. Sometimes you'll notice the price constantly pushes the pivot during a massive Pump or Dump. This is normal, and may indicate high levels of volatility. This generally also happens when the price is outside of the Bollinger Bands and is also Over or Undervalued. The price usually consolidates for a while after something like this happens before more drastic movement may occur.
9. Trend Lines:
Trend lines may be one of the best indicators of support and resistance for diagonal price movement. When a Trend Line fails to hold it may be a strong indication of a dump. Keep a close eye to where Upward and Downward Trend Lines meet. Trend lines can create different trading formations known as Pennants, Flags and Wedges. Please familiarize yourself with these formations So you know what to look for.
10. Bollinger Bands (BOLL):
Bollinger Bands may be very useful, and ours have been customized so they may be even more accurate by using a modified calculation that also incorporates volume.
Bollinger Bands may be used to see Movement vs Consolidation Zones (When it’s wide vs narrow). It also may be very useful for seeing where the correction areas are likely to be. Price may bounce between top and bottom of the BOLL, unless perhaps in a pump or dump. The Boom Meter may show you whether it is currently: Dumping, Consolidation or Pumping, along with Boom Meter Bar Colors, may be a good indication if it will break the BOLL. The Middle Line of the BOLL (White Line) may be a very strong support / resistance line. If the price closes above or below it, it may be a good indication of the trend changing (it may be one of the first stages to a pump or dump).
11. Boom Meter Bar Colors:
Boom Meter bar colors may be very useful for seeing when the bar is Overbought or Underbought. There are 6 different types of boom meter bar colors, they are:
Dark Green: RSI may be very Overbought and price going UP (May be in a big pump. NOTICE, chance of small dump correction if Cherry Red bar appears).
Light Green: RSI may be slightly Overbought and price going UP (chance of small pump).
Light Purple: RSI may be very Underbought and price going UP (May have chance of small correction).
Dark Red: RSI may be very Underbought and price going DOWN (May be in a big dump. NOTICE, chance of small pump correction if Light Purple bar appears).
Light Orange: RSI may be slightly Underbought and price going DOWN (chance of small dump).
Cherry Red: RSI may be very Overbought and price going DOWN (Chance of small correction).
12. True Value Zone:
True Value Zones display zones that represent ranges to show what the price may truly belong within. They may be very useful for knowing if the Price is currently not valued correctly, which generally means a correction may happen soon. True Value Zones can swap from Bullish to Bearish and are represented by Red for Bearish and Green for Bullish. For example, if the price is ABOVE and OUTSIDE of the True Value Zone, this means it may be very overvalued and might correct to go back inside the True Value Zone. This correction may be done by either dumping in price back into the zone, or consolidating horizontally back into it over a longer period of time. Vice Versa is also true if it is BELOW and OUTSIDE of the True Value Zone.
13. Bar Strength Index:
Bar Strength Index may display how Bullish/Bearish the current bar is. The strength is important to help see if a pump may be losing momentum or vice versa if a dump may correct. Keep in mind, the Bar Strength Index does a small 'refresh' to account for new bars. It may help to keep the Index more accurate.
14. Volume Profile:
Volume Profiles may be important to know where the Horizontal Support/Resistance is in Price base on Volume. Our Volume Profile may identify the point where the most volume has occurred within the most relevant timeframe. Volume Profiles are helpful at identifying where Whales have their orders placed. The reason why they are so helpful at identifying whales is when the volume is profiled to a specific area, there may likely be lots of Limit Buy and/or Sells around there. Limit Buys may act as Support and Limit Sells may act as Resistance. It may be very useful to know where these lie within the price, similar to looking at Order Book Data for Whale locations.
If you have any questions, comments, ideas or concerns please don't hesitate to contact us.
HAPPY TRADING!
Search in scripts for "Table"

Automatic Ryze Zones v. 2.1.0Automatic Ryze Zones v2.1.0 — Multi-City Sunrise Opening Zones + Mitigation Signals
Automatic Ryze Zones maps the first actionable range at astronomical sunrise for major financial hubs and your own custom city—then watches how price reacts to those zones through the day. It’s built for intraday traders who like session structure, time-based anchors, and objective “tap/mitigation” signals.
What it plots
Sunrise Zone (per city):
At the exact local sunrise minute, the indicator captures the 1-minute candle’s high & low and paints a box that extends right across the session.
Optionally plots a dashed midline (the zone’s midpoint).
Mitigation Arrows (optional):
• ▲ Bullish when price interacts with a city’s zone in a bullish manner
• ▼ Bearish for bearish interactions
Signals are filtered by your choice of wick/close logic and a volatility gate (ATR ratio).
Timing Table:
For each enabled city, an on-chart table shows four equal intervals from sunrise to 22:00 UTC, helping you pre-plan intraday inflection windows.
(Debug) Heights Table:
Optional table listing the captured High/Low used to build each zone.
Cities covered (toggle any on/off)
New York, London, Tokyo, Auckland, Dubai, Rio, Reykjavik, Dallas, plus your Custom City (name + lat/lon).
Each city has its own:
Box color & opacity
“Show box” and “Show midline” toggles
Time-offset override (advanced)
Tip: Use the custom city to track your local market, a specific exchange, or any location you care about.
How it works (under the hood)
Astronomical Sunrise Calculation
For each day and city (lat/lon), the script computes sunrise using standard solar geometry (zenith ≈ 90.83°). This yields sunrise in UTC, then converts to local with the city’s time offset.
Zone Capture at Sunrise
At the exact sunrise minute, the script requests lower-timeframe data via request.security_lower_tf(...) and grabs the 1-minute High/Low. That becomes the zone for that city and day.
Zones Extend Right
The box is created at the sunrise bar and extends to the right for the rest of the session, giving you durable structure to trade around.
Mitigation Logic (signals)
You choose the interaction rule:
Wick: low-into-zone with a bullish candle → ▲; high-into-zone with a bearish candle → ▼
Close: both open & close inside the zone (bullish → ▲ / bearish → ▼)
Wick or Close: combines both checks
A volatility filter controls noise:
ATR_ratio = ATR(1) / ATR(2500) must be greater than your threshold (default 0.25) for the signal to print.
Timing Intervals Table
The time from sunrise → 22:00 UTC is divided into four equal parts per city. The table shows the resulting timestamps to help anticipate rhythm shifts.
Key inputs
Ryze Zone Master Switch — global on/off
Automatic Time Settings
Chart Zones for Today’s Date (true/false)
↺ Lookback (number of trading days back; weekends auto-skipped)
Manual Date Range (when Auto is off) — “Chart Zones from / To”
Per-City Settings
Show ■ (box), Show ⎯ (midline), Opacity, Color
Time Offset (advanced; typically leave 0 or -24 as noted)
Add Your City
Title, Lat., Lon., Color
Show box/midline, Opacity
Custom City Time Offset
Zone Mitigation Settings
Show Zone Mitigation (signals on/off)
Filter By: Wick, Close, or Wick or Close
▲ / ▼ colors
ATR Filter (default 0.25 on ATR ratio)
Debug
Table Page (for stepping through stored days)
⏼ (toggle debug table of High/Low per city)
Suggested use
Confluence trading: Combine Ryze Zones with your session bias, market profile, VWAP, or liquidity maps.
Tap/Mitigate behavior: Watch for first touch, failures to break, and midline reactions; the ATR filter helps you ignore low-energy pokes.
Timing awareness: Use the four interval times as soft “checkpoints” for rotation or continuation.
Notes & limitations
Timeframes: Works on intraday charts; uses 1-minute data internally.
Weekends: Auto-skipped in lookback.
Offsets: City time offsets are advanced controls for edge cases (synthetic sessions, DST quirks). If unsure, leave at default.
Performance: The script is optimized (uses dynamic_requests = true), but enabling many cities + long lookbacks can approach max_lines/boxes.
Historical signals: Mitigation arrows evaluate against today’s zones by design (historical arrays are foundational but signals key off the current day).
Quick start
Turn Ryze Zone Master Switch on.
Set Automatic Time on and choose your Lookback (e.g., 3).
Enable the cities you care about (NY/LON/TYO are a solid start).
Turn on Zone Mitigation with Wick or Close and keep ATR Filter = 0.25–0.35 to start.
Trade reactions into/out of zones with your own risk plan.
Credits / Version
v2.1.0 — Multi-city sunrise zones, mitigation signals with ATR ratio, interval timing table, custom city support, debug tools.

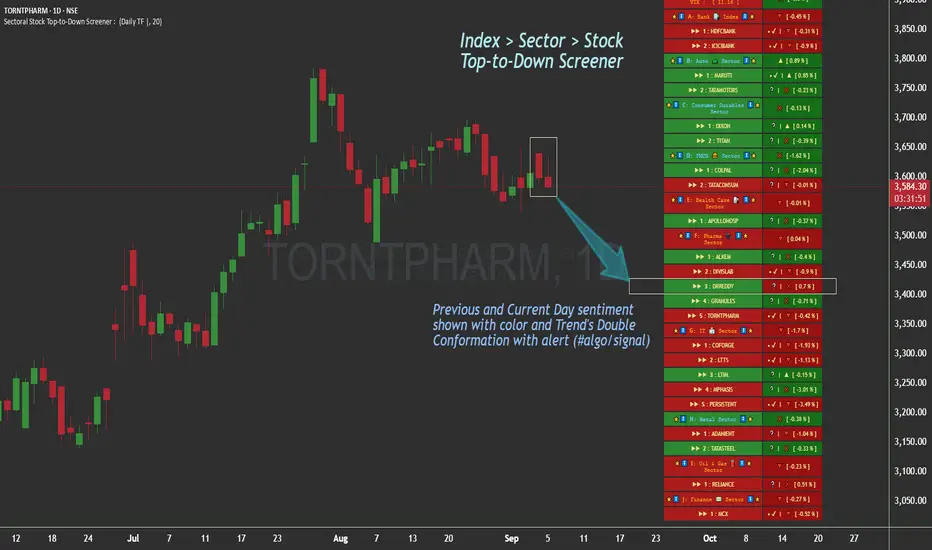
Sectoral Stock Top-to-Down Screener : ⭐ Sectoral Stock Top-to-Down Screener Analysis ⭐
This Screener indicator provides a bird's-eye view of the Market's important indices, sectors and Stocks listed in those sectors.
1: It represents a Screener Table that shows the (%) percentage change of the market, Sectors and all the Stocks (listed via input) . The color represents the Trend of the Previous day and the current day compared to Nifty50 Index.
2: The %percentage change is dependent on the Time-Frame selection:
This Input allows users to look at the Major Index > sectors > stocks in their specific time frame.
3: It has a alert function, which can trigger for all symbols/securities in the table.
Irrespective of Trading View Free or Paid user, this alert works for all .
4: Compatible with All Devices (Laptop / Mobile / Tablet / PC)
RealEdgeFX EdgeMap ProPresentation
RealEdgeFX EdgeMap Pro is built for systematic intraday decision-making. It combines a rule-based Daily Bias engine with an intraday (1-hour) regime engine based on medium timeframe engulfing (a structure change where a new directional run overwhelms the prior one). The study continuously evaluates candlestick behavior, session-level displacement, previous-day range interaction, and clearly defined points of interest (price areas left by sharp moves that often act as magnets or rejection zones). Intraday highs/lows inside an active regime are updated in real time on lower timeframes, so levels expand tick-by-tick when price makes new extremes.
Description
RealEdgeFX EdgeMap Pro is built on the idea that price alternates between contraction and expansion. Expansion begins when price drives in one direction with conviction. The study blends higher-timeframe daily context with a confirmed 1-hour structure shift called ME (Medium timeframe engulfing)—the moment a fresh run closes beyond the opening level that began the previous opposite run. From that confirmation forward, the active range’s high and low are maintained in real time on lower timeframes, expanding tick-by-tick whenever price prints new extremes. The tool also marks points of interest derived from zones where the price usually reacts following the 1h order flow context. Only the most relevant, side-aligned area is shown, and it is removed as soon as price trades decisively through it.
The engine outputs a Buy/Sell/Neutral stance and a 0–100 strength score. The definitive rules are the ones displayed in the on-chart table: the bias is produced when at least three of those criteria are active, or when a rule-based override flips the stance. Strength is calculated from the same table and increases with the number and intensity of active checks.
Tools
- Daily Bias & Strength (table-driven): Produces a Buy/Sell/Neutral bias and a 0–100 strength score for the day. The decision follows the rules shown in the on-chart table; the bias is set when at least three table criteria are active, or when a rule-based override flips it. Strength scales with how many checks are active and how strong they are.
- Medium-Timeframe Engulfing (ME) on 1-Hour: Detects a confirmed 1-hour structure shift when a new move closes beyond the opening price that started the prior opposite move. From that moment, the active range’s high/low is maintained in real time on lower timeframes, expanding tick-by-tick as new extremes print. A 1-hour close through the invalidation clears the ME and its dependents.
- Points of Interest (POI): Marks areas created by a distinct three-candle move on the 1-hour chart where the middle bar’s range does not overlap the bar from two candles earlier, or the initial candle that produces the Medium-Timeframe Engulfing. Only POIs formed after the current ME begins and lying inside the active ME range are eligible. Overlapping same-side areas merge; only the nearest, side-aligned POI is shown and it is removed once price trades decisively through it.
- ME-Based Fibonacci Levels: Draws three live reference lines tied to the active ME range—100% at the active extreme, 50% at the midpoint, and 0% at the opposite extreme. These levels extend forward, update in real time as the ME range grows, and hide automatically when no valid ME is active.
- Intraday Visuals: On the first bar of each new trading day (on intraday charts), prints an up/down arrow reflecting the current Daily Bias and a clean text label with its strength. Sizes and colors are configurable to keep the chart readable.
- On-Chart Diagnostic Table: Displays the exact rules used to build the Daily Bias and Strength, broken down by sections (Price Body & Structure, Breakout & Liquidity, POI Context, Overrides). A check mark means the criterion is currently contributing; this table is the single source of truth for the engine’s decisions.
What can you customize?
- ME Level & Label (Medium-Timeframe Engulfing): Choose line style (solid, dashed, dotted), line width, and separate colors for bullish and bearish levels. Set the label text (e.g., “ME”), its color, and size. Control how far the line/label project forward in time. Once a 1-hour close invalidates the setup, the ME line and label are removed automatically, keeping the view clean.
- POI Areas (Points of Interest): Toggle on/off. Pick separate fill colors for bullish/bearish areas, adjust transparency, and set border color, width, and style. Define how far each area extends forward. Only the most relevant, side-aligned area is shown; when price closes decisively through it, the box is cleared to avoid clutter.
- ME-Based Fibonacci Levels (100/50/0): Toggle the three reference lines, and customize each level’s color, width, and style. Turn labels on/off and set label text size and color. Control forward extension so levels project the way you prefer. Levels auto-update in real time as the ME range expands and hide when no valid ME is active.
- Intraday Day-Change Arrows & Strength Labels: Select arrow size (Tiny, Small, Normal, Large) and separate colors for buy/sell arrows. Choose text color and size for the strength percentage, also separated for buy/sell. Control the history window (how many past days’ arrows/labels remain visible) to keep the chart minimal or more informative.
- Diagnostics Table (Daily Bias & Strength): Toggle the table on/off and place it in any corner (top/bottom, left/right). Customize header background/text colors, row background/text colors, and the colors used for Buy/Sell/Neutral states. Set border width and overall text size to match your chart theme.
- Forward Extensions & History Windows: Independently control how far ME lines, POI boxes, and ME-Fibonacci levels extend into the future, and how much intraday arrow/label history is kept. These controls let you balance context vs. cleanliness on any timeframe.
How to use properly
- Add RealEdgeFX EdgeMap Pro to any TradingView symbol and timeframe.
- For execution, use intraday charts (e.g., 1–15 minutes).
- The study pulls its higher-timeframe context from the Daily and confirms structure on the 1-hour engine.
Originality & value
This study is not a mashup; it integrates a daily rule engine with a 1-hour regime detector that maintains live extremes on lower timeframes and a single, side-aligned point-of-interest filter with merging/invalidations. The combination produces a table-audited bias and strength built from measurable, configurable checks rather than generic overlays.
Terms and Conditions
Purpose and no advice. These charting tools are provided for informational and educational purposes only. They do not predict markets or provide financial, investment, or trading advice. Past performance is not indicative of future results.
User responsibility and liability. By using these tools, you agree that all decisions and outcomes are your sole responsibility. RealEdgeFX EdgeMap Pro and its creator(s) are not liable for any losses or consequences arising from the use of these products. You agree to indemnify and hold RealEdgeFX EdgeMap Pro harmless from any claims related to your use.
Access and use. Access may be granted via TradingView invite and requires an active subscription. Access is personal and non-transferable. Sharing, reselling, redistributing, copying, decompiling, or attempting to reverse engineer the code is prohibited. Access may be suspended or revoked for violations of these terms or platform policies.
Subscriptions, discounts, and cancellation. If you receive access through a Friends & Family program or use a discount code, the discount applies only to the first purchase or first billing cycle unless explicitly stated otherwise. You are solely responsible for canceling—or requesting cancellation of—your subscription if you do not wish to continue after the discounted period and/or at full price.
Refund policy. No reimbursements, refunds, or chargebacks are provided, to the maximum extent permitted by law.
Acceptance and updates. By continuing to use these tools, you acknowledge and agree to these Terms and Conditions. RealEdgeFX EdgeMap Pro may update these terms from time to time; continued use after updates constitutes acceptance of the revised terms.

INCOME STATEMENT BY N' TEEREX HOONJONGPANGConcept
This Pine Script indicator displays a dynamic, customizable table on the TradingView chart.
It is designed for traders who want to monitor annual data, quarterly performance, and key financial ratios directly on the chart without switching to external spreadsheets.
Features
Three Structured Sections:
Yearly Data Table – Displays annual values with adjustable text size and colors.
Quarterly Data Table – Shows quarter-by-quarter figures in a clear, compact format.
Financial Ratios Table – Presents key metrics (e.g., growth rates, margins, or other ratios) for quick analysis.
Customizable Appearance:
Adjustable text size for each table section.
Background and text colors for improved readability.
Option to merge cells for titles and headers.
Flexible Positioning:
Tables can be displayed in various positions on the chart (e.g., top-left, top-center, top-right).
Data Highlighting:
Color-coded cells to highlight important values or trends.
How to Use
1.Add the script to your TradingView chart.
2.Select table position (e.g., top-center for balanced display).
3.Adjust text size and color for yearly, quarterly, and ratio tables according to your preference.
4.Review the merged header cells for section titles and use the table to track key performance data alongside price action.
This tool is especially useful for swing traders, investors, and analysts who need to quickly interpret fundamental data within the same visual context as the chart.

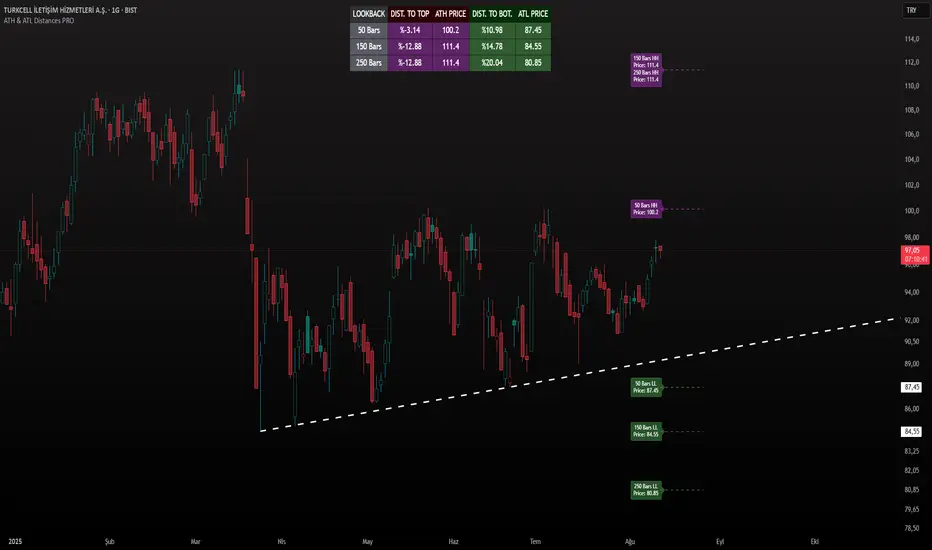
ATH & ATL Distances PROIndicator Description:
ATH & ATL Distances PROThis Pine Script indicator, built on version 6, helps traders visualize and monitor the percentage distances from the current closing price to the rolling All-Time High (ATH) and All-Time Low (ATL) over customizable lookback periods.
It's designed for overlay on your TradingView charts, providing a clear table display and optional horizontal lines with labels for quick reference.
This tool is ideal for assessing market pullbacks, rallies, or potential reversal points based on recent price extremes.
Key Features:
Customizable Lookbacks: Three adjustable periods (default: 50, 150, 250 bars) to calculate short-, medium-, and long-term highs/lows.
Percentage Distances: Shows how far the current price is from ATH (negative percentage if below) and ATL (positive if above).
Visual Aids: Optional dashed lines for ATH/ATL levels extending a set number of bars, with grouped labels to avoid clutter if levels overlap.
Info Table: A persistent table summarizing lookbacks, distances, and prices, with color-coded cells for easy reading (red for ATH/dist to top, green for ATL/dist to bottom).
User Controls: Toggle rows, lines, table position, and colors via inputs for a personalized experience.
How It Works (Logic Explained):
The script uses TradingView's built-in functions like ta.highest() and ta.lowest() to find the highest high and lowest low within each lookback period (capped at available bars to handle early chart data). It then computes:Distance to ATH: ((close - ATH) / ATH) * 100 – Negative values indicate the price is below the high.
Distance to ATL: ((close - ATL) / ATL) * 100 – Positive values show the price is above the low.
Unique ATH/ATL prices across lookbacks are grouped into arrays to prevent duplicate lines/labels; if prices match, labels concatenate details (e.g., "50 Bars HH\n150 Bars HH").
Drawings (lines and labels) are efficiently managed by redrawing only on the latest bar to optimize performance. The table updates in real-time on every bar close.How to Use:Add the indicator to your chart via TradingView's "Indicators" menu (search for "ATH & ATL Distances PRO").
Customize inputs:
Adjust lookback periods (1-1000 bars) for your timeframe (e.g., shorter for intraday, longer for daily/weekly).
Enable/disable lines, rows, or change colors/table position to suit your setup.
Interpret the table:
"DIST. TO TOP" (red): Percentage drop needed to reach ATH – useful for spotting overbought conditions.
"DIST. TO BOT." (green): Percentage rise from ATL – helpful for identifying support levels.
If lines are enabled, hover over labels for details on which lookbacks share the level.
Best on any symbol/timeframe; combine with other indicators like RSI or moving averages for confluence.
This script is open-source and free to use/modify. No external dependencies – it runs natively on TradingView. Feedback welcome; if you find it useful, a like or comment helps!
TrendGradient [By TraderMan]TrendGradient Indicator: What It Does, How It Works, and How to Use It 📊✨
The **TrendGradient ** indicator is a Pine Script tool designed for the TradingView platform, assisting traders in trend analysis, generating buy/sell signals, and determining target price (TP) and stop-loss (SL) levels. In this guide, I’ll explain in detail what the indicator does, how it operates, how to use it, and strategies for opening positions. Get ready to dive into this colorful and powerful tool! 🚀
🌟 **What Is TrendGradient and What Does It Do?**
TrendGradient is an indicator that analyzes price movements to identify trend direction and strength while generating actionable buy and sell signals. Here are its core functions:
1. **Trend Tracking**: Uses 38-period and 62-period Exponential Moving Averages (EMAs) to determine the trend direction (bullish or bearish).
2. **Buy/Sell Signals**: Generates signals based on EMA crossovers and crossunders.
3. **Target and Stop Levels**: Calculates entry, take-profit (TP1, TP2, TP3), and stop-loss (SL) levels using the Average True Range (ATR).
4. **Volatility and Trend Analysis**: Visualizes volatility levels (low, medium, high) and trend strength (strong/weak) via ATR and EMA.
5. **Visual Clarity**: Provides a user-friendly interface with colored lines, labels, tables, and shapes.
This indicator is ideal for trend-following traders and can be used for both short-term (scalping/day trading) and long-term strategies. 📈
---
### 🛠️ **How Does TrendGradient Work?**
Let’s break down the indicator’s mechanics step by step:
#### 1. **EMA-Based Trend Analysis** 📉
- **EMA 38 and EMA 62**: The indicator uses 38-period and 62-period Exponential Moving Averages to smooth price data and identify trend direction.
- **EMA 38 > EMA 62**: Bullish trend (uptrend) 📈
- **EMA 38 < EMA 62**: Bearish trend (downtrend) 📉
- EMA crossovers trigger buy/sell signals:
- **Crossover (EMA 38 crosses above EMA 62)**: Buy signal (BUY).
- **Crossunder (EMA 38 crosses below EMA 62)**: Sell signal (SELL).
- The EMAs focus on the last 20 days of data to display recent trends only.
#### 2. **ATR-Based Levels** ⚖️
- **ATR (Average True Range)**: Measures price volatility and is used to calculate entry, TP, and SL levels.
- **Entry Price**: For buys, the closing price plus an ATR multiplier; for sells, the closing price minus an ATR multiplier.
- **Take-Profit Levels (TP1, TP2, TP3)**: Calculated by adding/subtracting ATR multiples (default: 2.0, 4.0, 6.0) to/from the entry price.
- **Stop-Loss (SL)**: Set at a distance from the entry price using an ATR multiplier (default: 2.0 + additional SL).
- These levels are visualized on the chart with colored lines (yellow: entry, green: TP1, teal: TP2, blue: TP3, red: SL) and labels.
#### 3. **Signal and Status Visualization** 🖼️
- **Lines and Labels**: Buy/sell signals are marked with green "BUY" and red "SELL" labels on the chart.
- **Table**: A table in the top-right corner summarizes signal status, entry/TP/SL levels, trend strength, volatility, and trend direction.
- **Color Coding**:
- Green: Bullish trend, buy signal, or TP achievements.
- Red: Bearish trend, sell signal, or SL triggered.
- Yellow, teal, blue: Entry and TP levels.
- **Bar Coloring**: Bars are colored green (bullish) or red (bearish) based on EMA alignment.
#### 4. **TP/SL Monitoring** ✅❌
- The indicator checks if the price hits TP or SL levels and displays labels like "✔️ TP Achieved" or "❌ SL Stopped Out."
- When a TP or SL is hit, the position status updates (e.g., "In Progress ⏳", "Successful ✅", or "Failed ❌").
#### 5. **Volatility and Trend Strength** 📊
- **Volatility (ATR)**: Classified as "Low" (red), "Medium" (orange), or "High" (green) based on the ATR’s position within its 50-bar range.
- **Trend Strength**: If EMA 38 > EMA 62, the trend is "Strong" (green); otherwise, it’s "Weak" (red).
---
### 📋 **How to Use TrendGradient?**
Follow these steps to effectively use TrendGradient:
#### 1. **Add the Indicator to TradingView** 🖥️
- In TradingView, search for "TrendGradient " in the **Indicators** menu and add it to your chart.
- Use default settings or customize parameters like ATR period, multipliers, and display duration (default: 20 days) in the **Settings** menu.
#### 2. **Identify Signals** 🔍
- **Buy Signal (BUY)**: Appears when a green "BUY" label is displayed and EMA 38 crosses above EMA 62.
- **Sell Signal (SELL)**: Appears when a red "SELL" label is displayed and EMA 38 crosses below EMA 62.
- Check the top-right table for signal status ("BUY", "SELL", or "-") and position levels (Entry, TP1, TP2, TP3, SL).
#### 3. **Opening a Position** 🚪
- **Long Position (Buy)**:
1. When a "BUY" signal appears, check the entry price (yellow line).
2. Open a position at or near the entry price.
3. Set TP1, TP2, TP3 (green, teal, blue lines) and SL (red line) as targets/stops.
- **Short Position (Sell)**:
1. When a "SELL" signal appears, check the entry price.
2. Open a position at or near the entry price.
3. Use TP and SL levels as targets/stops.
- **Note**: ATR-based levels adjust dynamically to market volatility, ensuring adaptability.
#### 4. **Position Management** 🛡️
- **Take-Profit (TP)**: Realize profits when the price hits TP1, TP2, or TP3. For example, close part of the position at TP1 and hold the rest for TP2/TP3.
- **Stop-Loss (SL)**: Close the position if the price hits the SL level ("❌ SL Stopped Out" appears).
- **Partial Closes**: Use multiple TP levels to scale out of positions incrementally.
#### 5. **Trend and Volatility Analysis** 📊
- **Trend Direction and Strength**: The table shows whether the trend is "Up" or "Down" and its strength ("Strong" or "Weak"). Strong trends may warrant more aggressive positions.
- **Volatility**: ATR-based volatility indicators help gauge market conditions. High volatility (green) suggests larger price moves, while low volatility (red) indicates calmer markets.
#### 6. **Risk Management** ⚠️
- Always use the SL level and assess the risk/reward ratio (e.g., 2:1 for TP1, 4:1 for TP2).
- In low volatility (red), consider smaller positions; in high volatility (green), expect larger moves.
---
### 🛠️ **Example Position Opening Scenario**
**Scenario: Long Position**
- **Situation**: EMA 38 crosses above EMA 62, and a green "BUY" label appears.
- **Entry Price**: 100 (yellow line).
- **TP Levels**: TP1: 104, TP2: 108, TP3: 112.
- **SL Level**: 96.
- **Strategy**:
1. Open a long position at 100.
2. Close 50% of the position at TP1 (104), hold the rest for TP2 (108) or TP3 (112).
3. Exit fully if the price hits SL (96).
- **Table Status**: "Signal: BUY", "Position Status: In Progress ⏳", "Trend Strength: Strong", "Volatility: High".
**Scenario: Short Position**
- **Situation**: EMA 38 crosses below EMA 62, and a red "SELL" label appears.
- **Entry Price**: 100.
- **TP Levels**: TP1: 96, TP2: 92, TP3: 88.
- **SL Level**: 104.
- **Strategy**: Manage the position similarly, scaling out at TP levels.
---
### 💡 **Tips and Suggestions**
1. **Timeframe**: The indicator works across timeframes (1H, 4H, daily). Short-term traders can use 1H-4H, while long-term traders may prefer daily charts.
2. **Combine with Other Indicators**: Use RSI, MACD, or support/resistance levels to confirm signals.
3. **Backtesting**: Test the strategy on historical data to evaluate performance.
4. **Customization**: Adjust ATR multipliers or EMA periods to suit your market or strategy.
5. **Discipline**: Stick to signals and avoid emotional decisions.
---
### 🎨 **Visual Features**
- **Colored Lines and Labels**: Entry, TP, and SL levels are displayed with colored lines (yellow, green, teal, blue, red) for clarity.
- **Table**: The top-right table summarizes all key information (signal, levels, trend, volatility).
- **Bar Coloring**: Green bars for bullish trends and red bars for bearish trends make trend direction easy to spot.
- **Emojis**: Position status is enhanced with emojis like ⏳ (in progress), ✅ (successful), and ❌ (failed) for visual appeal.
---
### ⚠️ **Warnings and Limitations**
- **Market Conditions**: The indicator performs best in trending markets; it may produce false signals in ranging markets.
- **Risk Management**: Always use proper risk/reward ratios and risk only a small portion of your capital.
- **Lag**: EMAs are lagging indicators, so signals may be delayed in fast-moving markets.
- **Customization Needs**: Default settings may not suit all markets; test and optimize as needed.
---
### 🌟 **Conclusion**
TrendGradient is a user-friendly, visually appealing indicator for trend tracking and automated level calculation. It generates signals via EMA crossovers, calculates dynamic TP/SL levels with ATR, and presents all information clearly through tables, lines, and labels. By using this tool with discipline, you can make more informed and successful trading decisions! 🚀
If you have further questions or need help customizing the indicator, feel free to ask! 💬 Good luck and happy trading! 🍀

RS Alpha α | viResearchRS Alpha α | viResearch
Conceptual Foundation and Strategy Innovation
RS Alpha α is a dynamic, multi-asset crypto allocation engine designed for precision rotation among trending major assets. Grounded in intra-asset relative strength and enhanced by real-time trend classification, this model moves beyond static filters—adapting allocations to prevailing momentum and volatility regimes.
The strategy is purpose-built to extract tactical alpha in high-beta environments while minimizing whipsaw and drawdowns during uncertain conditions. It achieves this via a systematic, multi-layer filter stack: statistical ranking, trend validation, and risk-adjusted performance scoring.
Technical Architecture and Signal Composition
Relative Strength Matrix:
Assets are scored using a comprehensive 7x7 ratio matrix comparing each asset’s relative momentum against all others. Each row contributes to a cumulative trend score, identifying the top-performing names based on cross-asset strength.
Trend Filters (Multi-Timeframe Adaptive):
Each candidate must pass intra-trend classification (12H, 8H, 4H) and optionally a macro trend regime filter using a user-defined market benchmark (e.g., BTC or ETH on 1D).
Beta & Alpha Filter:
Assets are further screened using custom beta and alpha calculations versus a benchmark. When enabled, only assets showing above-median beta and alpha values are retained.
Optional Risk Ratios:
Sharpe, Sortino, and Omega ratio filters are included (opt-in) for forward testing purposes. These risk metrics refine selection in volatile regimes but are not required for core functionality.
Equity Engine & Allocation Logic:
A real-time system equity curve grows based on rate of change (ROC) from allocated assets, with support for:
100% single asset allocation
50/50 equal split if scores match closely
80/20 weighted allocation based on dominance
Performance Tracking and Alerts
System Equity Visualization: Real-time equity plotted using dynamic coloring tied to the primary asset allocation.
Drawdown Table: Tracks max equity drawdown since a user-defined start date.
Dominant Asset Panel: Displays current allocation format (100%, 80/20, or 50/50) and scoreboard of all considered assets.
Allocation Alerts: Sends alerts when asset rotation occurs, with clear breakdowns of new weightings and symbol changes.
Timeframe Guard: Warns users if running on anything other than the recommended 1D timeframe.
Customization and UX Enhancements
Asset Inclusion Toggle: Easily exclude assets from rotation by changing their input to "USDT".
Background Overlay (Optional): Background color highlights the dominant asset dynamically, with adjustable transparency.
User Switches for All Visual Modules: Toggle individual elements such as alerts, drawdown, dominant tables, or error messages.
Use Case and Target Audience
This tool is ideal for:
Active crypto portfolio managers seeking structured, rule-based asset rotation
Tactical traders who value adaptability and clarity in allocation shifts
Swing traders operating within medium to high-beta environments
It thrives particularly during bull trends, sector rotations, or when paired with macro regime filters like market confidence signals.
Summary
RS Alpha α provides a comprehensive, data-driven framework for crypto asset rotation. It combines statistical rigor with real-time responsiveness, offering high customization and strong risk awareness. Designed for professionals and advanced retail traders alike, it’s both a decision-support tool and a visual performance dashboard.
⚠️ Always validate any strategy with proper backtesting and forward tracking. While RS Alpha α provides robust signal logic, it is one component in a larger portfolio and risk management process.

10x HTF Candles Dynamic with LTF FVG and Key LevelsPurpose
The 10x HTF Candles Dynamic Pine Script is a versatile, all-in-one trading tool designed for TradingView to empower traders with actionable insights across multiple timeframes. It combines advanced price action analysis, Fair Value Gap (FVG) detection, market structure evaluation, and key level visualization into a single, highly customizable interface. Built for day traders, swing traders, and scalpers, this script enhances decision-making by providing a clear, multi-dimensional view of market dynamics, liquidity zones, and trend biases. Its purpose is to streamline technical analysis, reduce chart clutter, and deliver real-time, visually intuitive data to support precise trading strategies.
What the Script Does
How the Script Works:
The script leverages Pine Script v5’s advanced features to deliver a robust and efficient trading tool. Below is a step-by-step explanation of its functionality:
1. Initialization and Configuration:
- Initializes with @version=5, enabling dynamic requests, and sets limits for bars (500), lines, labels, boxes, and polylines to manage resources.
- Defines user inputs for candle settings, timeframe selection, FVG parameters, DWM levels, market structure table, and visual preferences.
- Dynamically calculates 10 higher timeframes based on the current chart timeframe (e.g., 1m chart → 5m, 15m, 60m, etc.) or allows custom timeframes.
2. Data Acquisition:
- Fetches OHLC data for up to 10 timeframes using request.security, storing it in optimized TfData objects (arrays for open, high, low, close).
- Loops through enabled timeframes to minimize redundant code, improving processing speed.
3. Candlestick Rendering:
- Draws HTF candlesticks at user-defined offsets, with customizable bullish/bearish colors, wick colors, and widths.
- Calculates bar types (Inside, Normal, Outside) and optionally labels them above candles for pattern analysis.
4. FVG Detection and Visualization:
- Scans for FVGs by comparing candle highs and lows across three bars (e.g., low of candle 1 > high of candle 3 for bullish FVG).
- Detects IFVGs based on user-selected methods (wick, close, or midpoint) and highlights them with distinct colors.
- Draws FVG boxes with configurable borders, midpoint lines, and labels, tracking mitigation status.
- Limits FVG display to a user-defined maximum (1–200) to maintain chart clarity.
5. Horizontal Levels and DWM Lines:
- Computes Highs, Lows, Midpoints, and Quarter Points for each timeframe, drawing lines with customizable styles and extensions.
- Plots DWM open, close, high, low, and control point lines, with optional alerts for high/low breaks.
- Supports session-based opening price lines (e.g., 09:30 Market Open) with similar customization.
6. Market Structure and Bias:
Calculates trend bias by comparing the current close to the midpoint of the timeframe’s range (highest high to lowest low).
Updates a market structure table with timeframe, bias, and premium/discount status, using color-coded cells for quick interpretation.
7. Countdown Timers:
- Converts timeframe strings to seconds and calculates the time remaining until the next candle using timenow.
- Renders countdown labels with timeframe names (e.g., “1h\n(00:45)”) at user-defined positions.
8. Optimization and Cleanup:
- Uses VisualElements UDTs to manage lines, wicks, and labels, reducing memory usage.
- Deletes outdated drawings when limits are exceeded, ensuring a clean and responsive chart.
- Employs loops and arrays to streamline repetitive tasks, enhancing performance.
How to Use the Script:
This script is user-friendly yet powerful, suitable for traders of all experience levels. Follow these steps to maximize its potential:
1. Add to TradingView:
- Copy the script into TradingView’s Pine Editor.
- Click “Add to Chart” to apply it to your active chart.
2. Customize Settings:
- Candle Settings: Adjust the number of candles (1–10), starting position, group spacing, bullish/bearish colors, wick colors, and candle width.
- Timeframe Settings: Enable/disable up to 10 timeframes, choosing dynamic (auto-selected) or custom timeframes (e.g., 3m, 60m, D).
- FVG Settings: Toggle FVG detection, set detection methods (wick/close/midpoint), adjust thresholds, and customize colors, borders, and midpoint lines.
- DWM Settings: Enable daily/weekly/monthly lines (open, close, high, low, midpoint), set colors, and configure alerts for high/low breaks.
- Market Structure Table: Show/hide columns for timeframe, trend bias, and premium/discount, and adjust table position (top-left, bottom-right, etc.).
- Countdown Timers: Enable timers, adjust offsets, and customize text/background colors.
- Label Settings: Configure price label precision, transparency, and offsets for clarity.
3.Interpret Visuals:
- Candlesticks: Analyze HTF candles to gauge trend direction and momentum across timeframes.
- FVGs: Look for unmitigated FVGs (colored boxes) as potential support/resistance zones or trade setups.
- Key Levels: Use Highs, Lows, Midpoints, and Quarter Points to identify breakout or reversal areas.
4. Market Structure Table: Check trend bias and premium/discount status to align trades with market conditions.
- DWM Lines: Monitor daily/weekly/monthly levels for institutional reference points.
- Countdown Timers: Time entries/exits based on upcoming candle formations.
5. Integrate with Strategy:
- Combine script insights with your trading plan (e.g., use FVGs for entries, key levels for stops/targets).
- Set alerts for high/low breaks or liquidity zone approaches to stay proactive.
- Export table data or screenshot visuals for documentation and analysis.
6. Optimize Performance:
Limit the number of candles, FVGs, and lines to match your device’s capabilities.
Regularly review settings to focus on the most relevant timeframes and features.
Why the Script is Original
The 10x HTF Candles Dynamic script stands out in the TradingView community due to its innovative design, comprehensive functionality, and trader-centric approach. Here’s what makes it unique:
1. Seamless Multi-Timeframe Integration:
- Unlike single-timeframe indicators, this script synthesizes data from up to 10 timeframes, offering a holistic view of market structure.
- Dynamic timeframe selection adapts to the chart’s timeframe, ensuring relevance across all trading styles.
2 . Advanced FVG and IFVG Detection:
- Provides granular control over FVG detection with three IFVG methods (wick, close, midpoint), a rarity in most scripts.
- Tracks mitigation status and highlights unmitigated FVGs, enabling traders to capitalize on high-probability setups.
- Visualizes FVGs with boxes, midpoint lines, and labels, enhancing clarity and usability.
3. Sophisticated Market Structure Analysis:
-The bias calculation, introduced in recent updates (2 days ago), uses a robust algorithm to assess trend direction based on range midpoints.
- The market structure table, with premium/discount zones (added 20 hours ago), offers a unique summary of market conditions, unmatched by standard indicators.
4. Comprehensive DWM and Session Support:
- Integrates daily, weekly, and monthly levels alongside session-based opening prices, catering to institutional and retail traders alike.
- Customizable alerts for high/low breaks add actionable functionality.
5. Visual Hierarchy and Clarity:
- Scales line widths and transparency by timeframe, prioritizing higher timeframes for strategic focus.
- Countdown timers provide real-time context, a feature rarely seen in multi-timeframe scripts.
6.Performance Optimization:
- Recent updates introduced loops and UDTs to reduce code redundancy and boost processing speed.
- Automated cleanup mechanisms prevent chart clutter, ensuring smooth operation even on low-resource devices.
7. High Customizability:
- Offers extensive settings for visuals, timeframes, FVGs, DWM lines, and alerts, accommodating diverse trading preferences.
- Balances complexity with accessibility, making it approachable for beginners and powerful for advanced users.
8.Continuous Evolution:
- Regular updates (e.g., bias filter table, premium/discount feature, code optimization) demonstrate ongoing commitment to improvement.
- Closed-source protection (noted 20 hours ago) ensures intellectual integrity while allowing free use, fostering trust in the TradingView community.
Conclusion
The 10x HTF Candles Dynamic Pine Script is a groundbreaking tool that redefines multi-timeframe analysis on TradingView. By combining candlestick visualization, FVG detection, market structure insights, DWM levels, and countdown timers, it provides traders with a comprehensive, real-time view of market dynamics. Its advanced optimization, customization options, and continuous updates make it a standout choice for traders seeking precision, clarity, and efficiency. Whether you’re scalping intraday moves or swing trading weekly trends, this script equips you with the tools to master the markets with confidence.

BG Ichimoku Tenkan & RSI MTF (Optimized)BG Ichimoku Tenkan & RSI MTF (Optimized)
The "BG Ichimoku Tenkan & RSI MTF (Optimized)" is a powerful and versatile TradingView indicator designed to provide multi-timeframe insights into market momentum using both the Tenkan-sen component of the Ichimoku Kinko Hyo and the Relative Strength Index (RSI). Developed by BAB & GINO, this tool helps traders quickly gauge trends and potential reversals across various timeframes directly on their chart.
Key Features and Functionality
This indicator combines visual clarity with comprehensive data presentation in a customizable table, making it easier to monitor multiple market dynamics at a glance.
Tenkan-sen Analysis
The Tenkan-sen (turning line) is a crucial part of the Ichimoku Kinko Hyo, calculated as the average of the highest high and lowest low over the past 9 periods. It serves as a short-term trend indicator.
Main Tenkan-sen Plot: The indicator displays the main Tenkan-sen line on your chart, colored dynamically to match the active chart's timeframe color for easy identification.
Multi-Timeframe (MTF) Tenkan Lines: You can enable additional Tenkan-sen lines for up to seven user-defined timeframes (e.g., 1m, 3m, 5m, 15m, 30m, 60m, 240m). These lines extend from the current bar with an adjustable offset, helping you visualize higher or lower timeframe Tenkan-sen levels relative to the current price.
MTF Line Labels: Each MTF Tenkan line can have a corresponding label indicating its timeframe (e.g., "1m", "3m"), with customizable size and offset for optimal visibility.
Tenkan Trend in Table: The indicator's integrated table clearly shows the current relationship between the Tenkan-sen and the price for each selected timeframe. An "🔼" symbol indicates the Tenkan-sen is above the price (bullish signal), while a "🔽" symbol indicates it's below (bearish signal), along with the Tenkan-sen's rounded value.
RSI Analysis
The Relative Strength Index (RSI) is a momentum oscillator that measures the speed and change of price movements. It typically ranges from 0 to 100 and is used to identify overbought or oversold conditions.
Customizable RSI Levels: You can set standard high (e.g., 60) and low (e.g., 40) RSI levels, as well as extreme high (e.g., 80) and extreme low (e.g., 20) levels to define zones of interest.
RSI Status in Table: The table provides a quick overview of the RSI value for each chosen timeframe, accompanied by intuitive emojis and symbols:
"🥵": Extremely overbought (above extreme high level)
"↑": Overbought (above high level)
"🥶": Extremely oversold (below extreme low level)
"↓": Oversold (below low level)
"-": Neutral (between high and low levels) The RSI value is also displayed, rounded to two decimal places.
Customizable Settings
The indicator offers extensive customization options through its input panel:
Table Position: Choose where the information table appears on your chart (Top Left, Top Right, Bottom Left, Bottom Right, Bottom Center).
Tenkan-sen Display: Toggle the visibility of the main Tenkan-sen line and the MTF Tenkan lines.
Line Offset: Adjust how far the MTF Tenkan lines extend from the current price bar.
MTF Label Settings: Control the visibility, size, and pixel offset of the MTF Tenkan line labels.
RSI Configuration: Define the RSI length and the thresholds for high, low, extreme high, and extreme low levels.
Table Text Size: Customize the font size within the indicator's table (Tiny, Small, Normal, Large).
Timeframe Selection: Independently set up to seven specific timeframes (in minutes) for both Tenkan and RSI analysis.
Timeframe Colors: Assign unique colors to each of the seven selected timeframes. These colors are used for the MTF Tenkan lines on the chart, the main Tenkan-sen line when its timeframe matches the chart, and the header cells in the information table, providing a consistent visual theme.
This "BG Ichimoku Tenkan & RSI MTF (Optimized)" indicator is a valuable tool for traders looking to enhance their market analysis with multi-timeframe confirmation, aiding in better-informed trading decisions.

ZenAlgo - MultiverseThe ZenAlgo – Multiverse indicator provides a multi-timeframe view of Volume-Weighted Average Price (VWAP) levels and their dynamic interaction with price across seven defined timeframes: Daily, Weekly, Monthly, Quarterly, Semi-Annual, and Yearly. The indicator is intended to help traders contextualize price within time-based value areas and examine how price interacts with statistically relevant bands derived from those VWAPs.
VWAP Calculation and Period Structure
At the core, this script computes VWAP levels anchored to six distinct timeframes using volume data and a configurable source (default is HLC3). Each VWAP resets at the start of its corresponding period (e.g., Daily VWAP resets at the beginning of a new day) using timeframe.change() as a detection mechanism. This allows each VWAP level to reflect a clean aggregation of price and volume over its specified period.
VWAP levels are only computed if volume data is present and cumulative volume increases, ensuring logical consistency. If volume is missing or inconsistent, the script terminates execution with an error to prevent invalid outputs.
Band Calculation
Each VWAP is accompanied by one or two optional bands on both sides, calculated using percentage-based offset. Daily VWAP is configurable per user preference to use either standard deviation or a percentage-based offset. These bands provide a dynamic value area that expands or contracts with volatility or proportional price distance, respectively.
The bands help classify price as:
Inside the main band (e.g., between ±1 band): near average value
Inside extended band (e.g., ±2 bands): stretched but not extreme
Beyond extended band: potentially overheated or oversold conditions
This layering creates a multi-zoned map of value perception across timeframes.
Labeling and Historical Tracking
As each new VWAP is computed, it is stored in a bounded array alongside metadata such as label position, line objects, test count, and test state (whether price has interacted with it). Each level is drawn as a dotted horizontal line and labeled with its value and corresponding period (e.g., "D", "W", "M").
Price interaction with a VWAP level (i.e., candle high/low crossing the line) changes the styling of the label and line, marking it as "tested." A cap on how many tested levels are retained (default 10) avoids excessive clutter and resource usage.
These persistent horizontal levels give the trader a visual reference of where value was defined in previous periods and how price has respected or ignored those levels over time.
Summary Tables and Grid
Two visual table overlays are provided:
1. VWAP Summary Table , this table shows:
VWAP values per timeframe
Trend interpretation (rising, falling, stable) relative to price
Ranked order of VWAP values (from highest to lowest)
The order is recalculated each bar to reflect the vertical positioning of each VWAP on the price chart.
2. VWAP Relationship Grid
A grid matrix compares each VWAP and current price against all others. Each cell reflects whether a given source is above, below, or within a tolerance threshold relative to another. Colors (green, red, gray) visually encode the result, with the diagonal marked in black and unused cells disabled.
This matrix helps identify alignment or dissonance among timeframes, allowing users to detect whether shorter-term value is leading or lagging longer-term value.
Price Band Classification
For the Daily VWAP specifically, the script includes an extra classification system. It assigns the current price to a zone (e.g., "At VWAP", "Bear Band", "Above Bull Band 2") based on where the price lies in relation to the VWAP bands. This classification is also used for dynamic coloring and added to the daily label.
Display Controls
The script offers fine-grained controls:
Toggle visibility of each VWAP and band group independently
Adjust the offset of labels from the current bar
Customize band multipliers and color transparency
Limit the number of historical VWAP labels plotted
Position both the summary and grid tables flexibly on screen
These options allow traders to declutter their charts and focus on the most relevant context for their strategy.
How to Interpret and Use
This indicator provides a structured view of market value perception across various timeframes. For example:
When price converges with multiple VWAPs, it may suggest consensus on value.
When price moves away from all VWAPs, it may indicate trending or stretched conditions.
Crosses and retests of VWAPs (especially higher-timeframe ones) can act as areas of interest.
The band-based classification helps identify transitional zones and whether price is situated in an area where value is being accepted or rejected.
The summary tables offer a high-level dashboard of price positioning and value structure, which can assist with top-down analysis, filtering setups, or contextual decision-making.
Added Value Compared to Free Alternatives
Most free VWAP scripts:
Cover only a single timeframe (often daily or session-based)
Lack historical level tracking with tested/retested visualization
Do not support grid-level relationships or multi-timeframe band analysis
Offer limited configuration over how bands are calculated or displayed
This script consolidates multiple value areas in one consistent framework and goes further by tracking historical relevance, providing interaction logs, and organizing data into actionable overlays.
For traders seeking comprehensive value context across intraday and swing horizons, this tool offers persistent and structured data views that are otherwise unavailable through individual, isolated VWAP tools.
Limitations and Disclaimers
The indicator depends on volume data. On instruments with unreliable or synthetic volume (e.g., certain spot forex or CFDs), results may not be meaningful.
Band-based interpretation should not be used as a signal mechanism on its own.
On low timeframes, longer-period VWAPs may appear flat or visually compressed.
As with any analytical tool, interpretation requires trader discretion and should be combined with broader context.
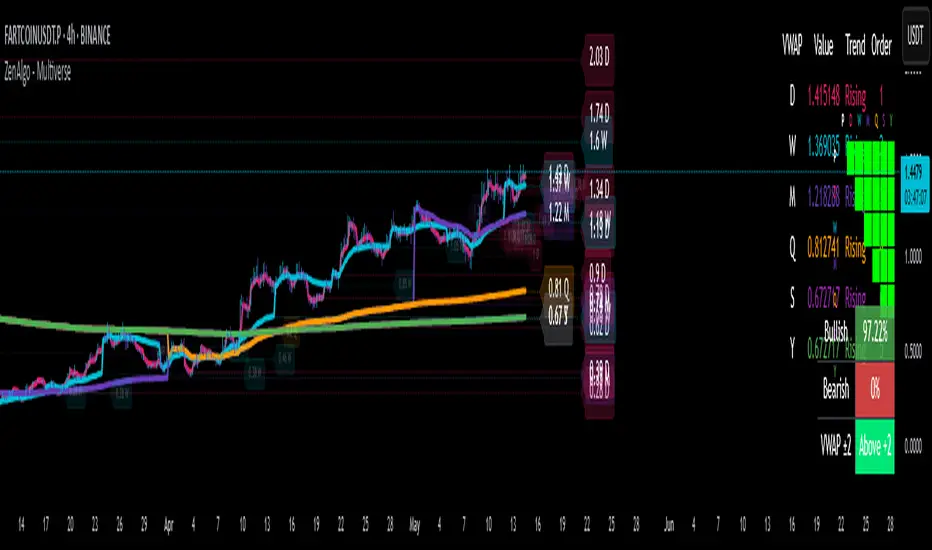
MACD Multi-Timeframe K2Indicator Description: MACD Multi-Timeframe K2
Important! it works best when all timeframes except 1M and 1W on the daily chart are included.
Review
"MACD Multi-Timeframe K2" is a Pine Script v5 indicator designed to monitor convergence crossings and divergences of moving averages (MACDs) on multiple timeframes simultaneously. It provides visual signals on the chart and a dynamic table to help traders identify when the MACD conditions match on selected timeframes, indicating potential bullish or bearish opportunities. This superimposed indicator is ideal for traders who use multi-time frame analysis to confirm trends or reversals.
How it works
MACD calculation : For each timeframe, the indicator calculates the MACD using three components:
Fast EMA : short-term exponential moving average (default length: 12).
Slow EMA : long-term exponential moving average (default length: 26).
Signal line : 9-period EMA of the MACD line (fast EMA - slow EMA).
Crossover detection :
A bullish signal occurs when the MACD line crosses the signal line from bottom to top.
A bearish signal occurs when the MACD line crosses the signal line from bottom to top.
The logic of working with multiple timeframes: the indicator checks the MACD intersections on 11 timeframes (1M, 5M, 15M, 30M, 1H, 2H, 4H, 8H, 12H, 1D, 1W) and gives a signal only when all the included timeframes line up in the same direction (all bullish or all bearish).
Visualization :
Triangles : green triangles under the bars are bullish signals, red triangles above the bars are bearish signals.
Labels: The labels "Long" (green) or "Short" (red) appear on the last confirmed bar when the conditions match.
Table : The dynamic table in the lower central part of the chart shows the MACD status (green for bullish trend, red for bearish) for each included timeframe.
Entrances
MACD Settings :
The length of the fast moving average : the length of the fast EMA (default: 12).
The length of the slow EMA: the length of the slow EMA (default: 26).
The length of the signal : the length of the signal line EMA (default: 9).
Timeframe logic settings : switching timeframes involved in the logic of the signal:
Use 1M, 5M, 15M, 30M, 1H, 2H, 4H, 8H, 12H, 1D, 1W (all default values are true).
Timeframe visualization settings : switching timeframes displayed in the table:
Show 1M, 5M, 15M, 30M, 1H, 2H, 4H, 8H, 12H, 1D, 1W (all default values are true).
Functions
Configurable time frames: Enable or disable specific time frames for independent signal generation and visualization.
Dynamic Table: Adjusts the number of columns based on visible timeframes, displaying only selected columns with real-time color updates (green = bullish, red = bearish).
Alerts : Built-in alert conditions when all included timeframes become bullish ("All Timeframes Bullish") or bearish ("All Timeframes Bearish").
Overlay design: Signals are displayed directly on the price chart, making it easier to integrate with other indicators or price action analysis.
Using
Configure :
Add the indicator to your TradingView chart.
Adjust the length of the MACD (fast, slow, signal) in the settings according to your trading strategy.
Enable/disable timeframes in the "Timeframe Logic Settings" section to determine which of them trigger the signals.
Enable/disable timeframes in the Timeframe Visualization Settings section to customize the table display.
Interpretation of signals :
Bullish (long) : The green triangle below the band and the "Long" label indicate that the MACD line has crossed the signal line from top to bottom on all included timeframes. Consider this as a potential buy signal.
Bearish (short) : The red triangle above the band and the "short" label indicate that the MACD line has crossed the signal line from below on all included timeframes. Consider this as a potential sell signal.
Table : Keep an eye on the table to see the MACD status across all time intervals. Green cells suggest bullish momentum, red cells suggest bearish momentum.
Testing :
Use lower timeframes (e.g., 5M, 15M) for more frequent signals, or higher timeframes (e.g., 1D, 1W) for stronger trend confirmation.
Experiment with the MACD settings (for example, 5, 13, 3) for faster or slower signal generation.
Notes
Performance : When all 11 timeframes are enabled, the indicator makes several calls to request.security(), which may cause a slight delay on very low timeframes of the chart (for example, 1M). For optimal performance, test at 5M or higher or disable unused timeframes.
Signal frequency : MACD crossings tend to occur less frequently than some other indicators (such as the RSI). Adjust the MACD length or timeframe selection to balance sensitivity and reliability.
Setup: If desired, the script can be expanded with additional functions, such as stop loss/take profit fields (as in previous versions of Stoch RSI).
Examples of scenarios
Bullish setup : on the 15-month chart, all included timeframes (for example, 1M, 5M, 15M, 1H) are displayed in the table in green, a green triangle appears under the bar, and the "Long" label confirms the signal.
Bearish setup: on the 1H chart, all included timeframes (for example, 1H, 4H, 1D) turn red, a red triangle appears above the band, and the "Short" label signals a potential downtrend.
Описание индикатора: MACD Multi-Timeframe K2
Важно! работает лучше всего когда включены все таймфреймы кроме 1M и 1W на дневном графике.
Обзор
"MACD Multi-Timeframe K2" - это индикатор Pine Script v5, разработанный для мониторинга пересечений конвергенции и расхождения скользящих средних (MACD) на нескольких таймфреймах одновременно. Он обеспечивает визуальные сигналы на графике и динамическую таблицу, чтобы помочь трейдерам определить, когда условия MACD совпадают на выбранных таймфреймах, указывая на потенциальные бычьи или медвежьи возможности. Этот наложенный индикатор идеально подходит для трейдеров, которые используют многотаймфреймовый анализ для подтверждения трендов или разворотов.
Как это работает
Расчет MACD : для каждого таймфрейма индикатор рассчитывает MACD, используя три компонента:
Быстрая EMA : краткосрочная экспоненциальная скользящая средняя (длина по умолчанию: 12).
Медленная EMA : долгосрочная экспоненциальная скользящая средняя (длина по умолчанию: 26).
Сигнальная линия : 9-периодная EMA линии MACD (быстрая EMA - медленная EMA).
Обнаружение кроссовера :
Бычий сигнал возникает, когда линия MACD пересекает сигнальную линию снизу вверх.
Медвежий сигнал возникает, когда линия MACD пересекает сигнальную линию снизу вверх.
Логика работы с несколькими таймфреймами : индикатор проверяет пересечения MACD на 11 таймфреймах (1M, 5M, 15M, 30M, 1H, 2H, 4H, 8H, 12H, 1D, 1W) и подает сигнал только тогда, когда все включенные таймфреймы выстраиваются в одном направлении (все бычьи или все медвежьи).
Визуализация :
Треугольники : зеленые треугольники под столбиками — бычьи сигналы, красные треугольники над столбиками — медвежьи сигналы.
Метки : метки «Длинный» (зеленый) или «Короткий» (красный) появляются на последнем подтвержденном баре, когда условия совпадают.
Таблица : динамическая таблица в нижней центральной части графика показывает состояние MACD (зеленый — для бычьего тренда, красный — для медвежьего) для каждого включенного таймфрейма.
Входы
Настройки MACD :
Длина быстрой скользящей средней : длина быстрой EMA (по умолчанию: 12).
Длина медленной EMA: длина медленной EMA (по умолчанию: 26).
Длина сигнала : длина сигнальной линии EMA (по умолчанию: 9).
Настройки логики таймфрейма : переключение таймфреймов, участвующих в логике сигнала:
Используйте 1M, 5M, 15M, 30M, 1H, 2H, 4H, 8H, 12H, 1D, 1W (все значения по умолчанию: true).
Настройки визуализации таймфрейма : переключение таймфреймов, отображаемых в таблице:
Показать 1M, 5M, 15M, 30M, 1H, 2H, 4H, 8H, 12H, 1D, 1W (все значения по умолчанию: true).
Функции
Настраиваемые временные рамки : включение или отключение определенных временных рамок для независимой генерации и визуализации сигнала.
Динамическая таблица : регулирует количество столбцов на основе видимых таймфреймов, отображая только выбранные столбцы с обновлением цвета в реальном времени (зеленый = бычий, красный = медвежий).
Оповещения : встроенные условия оповещения, когда все включенные таймфреймы становятся бычьими («All Timeframes Bullish») или медвежьими («All Timeframes Bearish»).
Дизайн наложения : сигналы отображаются непосредственно на ценовом графике, что упрощает интеграцию с другими индикаторами или анализом ценового действия.
Использование
Настраивать :
Добавьте индикатор на свой график TradingView.
Отрегулируйте длину MACD (быстрая, медленная, сигнальная) в настройках в соответствии с вашей торговой стратегией.
Включите/отключите таймфреймы в разделе «Настройки логики таймфрейма», чтобы определить, какие из них запускают сигналы.
Включите/отключите таймфреймы в разделе «Настройки визуализации таймфреймов», чтобы настроить отображение таблицы.
Интерпретация сигналов :
Бычий (длинный) : зеленый треугольник под полосой и метка «Длинный» указывают на то, что линия MACD пересекла сигнальную линию сверху вниз на всех включенных таймфреймах. Рассматривайте это как потенциальный сигнал на покупку.
Медвежий (короткий) : Красный треугольник над полосой и метка «короткий» указывают на то, что линия MACD пересекла сигнальную линию снизу на всех включенных таймфреймах. Рассматривайте это как потенциальный сигнал на продажу.
Таблица : Следите за таблицей, чтобы увидеть состояние MACD по всем временным интервалам. Зеленые ячейки предполагают бычий импульс, красные ячейки предполагают медвежий импульс.
Тестирование :
Используйте более низкие таймфреймы (например, 5M, 15M) для более частых сигналов или более высокие таймфреймы (например, 1D, 1W) для более сильного подтверждения тренда.
Поэкспериментируйте с настройками MACD (например, 5, 13, 3) для более быстрой или медленной генерации сигнала.
Примечания
Производительность : при включении всех 11 таймфреймов индикатор делает несколько вызовов request.security() , что может вызвать небольшую задержку на очень низких таймфреймах графика (например, 1M). Для оптимальной производительности тестируйте на 5M или выше или отключите неиспользуемые таймфреймы.
Частота сигнала : пересечения MACD, как правило, происходят реже, чем некоторые другие индикаторы (например, RSI). Отрегулируйте длину MACD или выбор таймфрейма, чтобы сбалансировать чувствительность и надежность.
Настройка : При желании скрипт можно расширить дополнительными функциями, такими как поля стоп-лосса/тейк-профита (как в предыдущих версиях Stoch RSI).
Примеры сценариев
Бычья установка : на 15-месячном графике все включенные таймфреймы (например, 1M, 5M, 15M, 1H) отображаются в таблице зеленым цветом, под полосой появляется зеленый треугольник, а метка «Длинная» подтверждает сигнал.
Медвежья установка : на графике 1H все включенные таймфреймы (например, 1H, 4H, 1D) становятся красными, над полосой появляется красный треугольник, а метка «Short» сигнализирует о потенциальном нисходящем тренде.

liquidation Heatmap [by Alpha_Precision_Charts]Indicator Description: Heatmap Longs/Shorts with OI Sensitivity & Aggregated Tools
Overview
The "Heatmap Longs/Shorts with OI Sensitivity & Aggregated Tools" is an advanced, multi-functional indicator crafted for futures traders seeking a deeper understanding of market dynamics. This tool integrates several key features—Heatmap of Longs and Shorts with Open Interest (OI) sensitivity, Histograms, Liquidity Exit Bubbles, Volume Bubbles, RSI Labels, Moving Averages, and an OI Table—into a single, cohesive package. By pulling real-time OI data from major exchanges (Binance, BitMEX, OKX, Kraken), it offers a robust framework for analyzing liquidity, order flow, momentum, and trends across various timeframes.
Why Aggregation Matters
Market analysis thrives on combining diverse insights, as relying on a single tool often leaves gaps in understanding. Each component of this indicator addresses a distinct aspect of market behavior:
Heatmap Longs/Shorts with OI Sensitivity: Maps potential liquidation zones based on OI, pinpointing where leveraged positions might cluster.
Histograms: Visualize the density of potential liquidity across price levels, enhancing OI-based analysis.
OI Table: Provides a breakdown of OI across all supported exchanges, offering transparency into total market exposure.
Liquidity Exit Bubbles: Highlight significant position exits (negative OI delta), signaling potential reversals or liquidations.
Volume Bubbles: Detect high-volume events from perpetual futures, revealing aggressive market participation.
RSI Labels: Track momentum with overbought and oversold conditions, refining entry and exit timing.
Moving Averages: Establish trend direction and dynamic support/resistance levels.
The power of aggregation lies in its ability to connect these dots. For instance, the Heatmap identifies potential liquidation zones, Volume Bubbles confirm aggressive moves, and RSI Labels add momentum context. Histograms and the OI Table further enrich this by detailing liquidity density and market exposure, creating a comprehensive view critical for navigating volatile markets.
Key Features
Heatmap Longs/Shorts with OI Sensitivity
Displays potential liquidation levels above (Shorts) and below (Longs) the price, with leverage settings from 5x to 125x.
Includes a Minimum Liquidity Sensitivity filter (0.1-1.0) to exclude small-order noise.
Features a dynamic gradient (purple to yellow) with adjustable intensity based on OI.
Note: Exact trader leverage isn’t known; liquidation zones are inferred from market psychology, as traders often favor specific leverage levels (e.g., 25x, 50x, 125x).
Histograms
Display the density of potential liquidity across price levels, complementing the Heatmap. Note that the largest histogram bars may appear in different locations compared to the most intense (yellow) areas of the Heatmap, as histograms primarily focus on the accumulation of smaller orders.
OI Table
Aggregates OI data from all supported exchanges (Binance, BitMEX, OKX, Kraken) in base currency and USD, sortable by volume.
Displays total OI and individual exchange contributions automatically.
Liquidity Exit Bubbles
Plots bubbles for significant negative OI changes, sized as small, medium, or large based on magnitude.
Positioned above or below candles depending on volatility direction, with customizable colors.
Volume Bubbles
Marks high-volume activity from perpetual futures, with sizes (normal, high, ultra-high) tied to intensity.
Offers adjustable sensitivity and offset for precise placement.
RSI Labels
Provides real-time RSI readings, highlighting overbought (≥70) and oversold (≤30) levels.
Configurable by price source (e.g., High/Low, Close) and timeframe, with customizable appearance.
Moving Averages
Supports SMA, EMA, WMA, and VWMA with three user-defined periods (default: 21, 50, 100).
Toggleable visibility and colors for trend analysis.
How to Use
Scalping/Day Trading (1m-15m):
Load the indicator three times: one at 125x leverage (visible), one at 50x (hidden), and one at 25x (hidden). Use the 125x Heatmap to identify immediate liquidation zones. When price breaks through the 125x liquidity pool, enable the 50x instance, then 25x as needed, to track cascading liquidations.
Pair with Histograms to monitor potential liquidity density, Volume Bubbles for breakout signals, and Liquidity Exit Bubbles for reversals.
Check RSI Labels on short timeframes (e.g., 15m) for overextended moves.
Swing Trading (1H-4H):
Set the Heatmap to lower leverage (e.g., 25x, 10x) and combine with Moving Averages to confirm trends.
Use RSI Labels on matching timeframes to time entries/exits based on momentum.
Reference the OI Table to assess overall market exposure.
Liquidity Analysis:
Adjust the Minimum Liquidity Sensitivity to focus on significant OI clusters. Higher filtering removes small orders, so use Volume Bubbles and the OI Table for broader context in sideways markets.
Use the OI Table to see total OI across all exchanges.
General Tips:
Toggle features (e.g., Bubbles, MAs) to focus on relevant data.
Test settings on your asset—optimized for Bitcoin, adjustable for altcoins.
Settings
Exchanges: Data from Binance, BitMEX, OKX, and Kraken is automatically included.
Heatmap: Enable Longs/Shorts, set start date, adjust leverage and color intensity.
Liquidity Filtering: Tune Minimum Liquidity Sensitivity (0.1-1.0) to balance detail and noise.
Histograms: Automatically active, showing potential liquidity density; no direct settings.
OI Table: Toggle visibility and choose position (e.g., Top Right).
Bubbles: Enable/disable Liquidity Exit and Volume Bubbles, set sensitivities and colors.
RSI: Pick price source, timeframe, and label style (size, color, offset).
Moving Averages: Select type, periods, and visibility.
Why It’s Unique
This indicator blends liquidity tools (Heatmap, Histograms, OI Table, Bubbles) with momentum and trend analysis (RSI, MAs). The adjustable Heatmap intensity enhances visibility of significant OI levels, while the multi-tool approach provides a fuller market perspective.
Notes
Best suited for perpetual futures; test on spot or other instruments for compatibility.
High leverage (e.g., 125x) excels on short timeframes; use 5x-25x for daily/weekly views.
Experiment with settings to optimize for your asset and timeframe.
This indicator relies on the availability of Open Interest (OI) data from TradingView. Functionality may vary depending on data access for your chosen asset and exchange.
Feedback
Your input is valued to enhance this tool. Enjoy trading with a fuller market perspective!
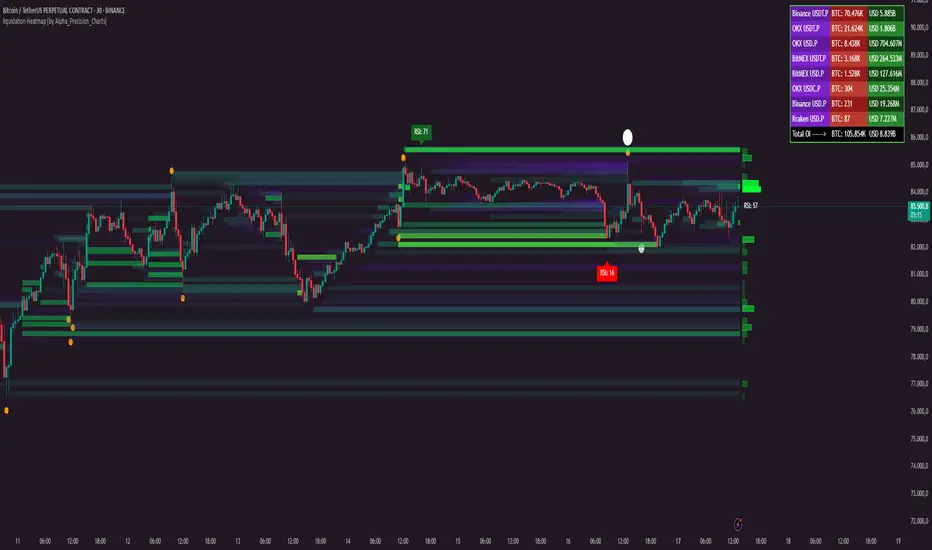
Market RhythmMarket Rhythm
Overview
If you’re a price-action enthusiast who loves to stay on top of structural shifts in the market, Market Rhythm is here to supercharge your charting experience! This script automatically identifies swing points (HH, LH, HL, LL), detects breaks of structure (BOS), flags changes of character (CHoCH), and offers an optional Trade Tip to guide your next move. It also provides a sleek table summarizing the latest signals so you can confirm momentum or pivot-based ideas at a glance.
What It Does
Swing Detection
Spots the last few pivot highs and lows on your chart.
Labels them as HH (Higher High), LH (Lower High), HL (Higher Low), or LL (Lower Low).
You can display all identified swings or only the most recent ones.
Adaptive Swing Logic
Optionally invert your swing lengths when the script detects a bearish trend, allowing it to adapt pivot detection automatically.
This means if the market flips to a downtrend, pivot detection reconfigures itself in real time.
Break of Structure (BOS)
If price breaks above the previous swing high or below the previous swing low, the script prints a BOS line on the chart.
You can choose whether to confirm breakouts via candle closes or wicks.
CHoCH (Change of Character)
When a BOS flips from bullish to bearish (or vice versa) against the prior direction, it’s renamed CHoCH for added clarity.
Color-coded lines and labels let you instantly see if the market’s “character” is reversing.
Optional Trade Tip
The script can suggest “Look for Long” or “Look for Short” based on your last pivot type and overall trend direction.
This “Trade Tip” is completely optional: enable or disable it in the settings, and the table reconfigures itself automatically.
Information Table
A compact on-chart table gives you an at-a-glance summary of:
Trend – Are we bullish, bearish, or uncertain?
Last BOS – If there’s a recent break of structure, how many bars ago did it happen?
Last CHoCH – If the market made a sudden reversal, how many bars back?
Trade Tip (Optional) – Summarizes whether conditions favor a long or short setup, or if it’s best to wait.
Alerts
Built-in alert conditions let you know when a BOS or CHoCH happens (bullish or bearish).
Turn them on to receive notifications without staring at the screen all day.
Chart Elements
Swing Labels: “HH,” “LH,” “HL,” “LL” near the pivot bars.
BOS & CHoCH Lines: Solid/dashed/dotted lines drawn across your chart, marking the level of structure that got broken.
Color Codes: Bullish signals are tinted in blue-ish tones, bearish signals in pink/purple-ish tones, making it easy to parse your chart visually.
Trade Tip Row: If enabled, instantly highlights “Look for Long” or “Look for Short” in a color-coded cell (blue for long, purple for short, gray if none).
Key Settings
Swing Points
Swing Points Display: Show all pivots, only the last set, or no pivots at all.
Invert Right Swing in Bearish Trend: Automatically swap your “Right Swing Length (High)” and “Right Swing Length (Low)” once the script detects a bearish trend (signaled by the most recent CHoCH).
Left Swing Length / Right Swing Length High/Low: Control how sensitive pivot detection is for highs vs. lows.
Pivot Source: Decide if your pivots are based on candle closes or wicks.
BOS Settings
Show BOS: Hide or reveal the Break of Structure lines entirely.
BOS Confirmation: Candle closes or wicks needed for a “true” breakout.
Line Style / Width / Color: Customize the BOS lines to your liking.
Show Only Last BOS: Show only the freshest BOS or keep historical ones on the chart.
CHoCH Settings
Show CHoCH: Rename the first opposite BOS to CHoCH if desired.
Bullish/Bearish Colors: Pick your favorite color theme for CHoCH lines.
Line Style / Width / Show Only Last CHoCH: Similar customizing options as BOS lines.
Table Settings
Show Table: Toggle the entire summary table on/off.
Position & Text Size: Choose table location (top-left, bottom-right, etc.) and text size (small to huge).
Show 'Trade Tip' row: Decide whether to add a fourth row that suggests potential trade direction. If disabled, the table has only three rows (Trend, Last BOS, and Last CHoCH).
Alerts
Several alert conditions are built in (e.g., “Bullish BOS Alert,” “Bearish BOS Alert,” “CHoCH Alert,” etc.), so you can set notifications for real-time structural shifts.
Why You’ll Love It
Visual Clarity: No more guesswork on which pivot was broken or whether a CHoCH just took place—color-coded lines and labels handle it.
Flexible Pivot Logic: Candle closes vs. wicks, separate right swing lengths for highs and lows, and an adaptive approach if the market goes bearish.
Quick Glance Table: Summaries of the latest signals keep you in the loop without cluttering your chart.
Trade Tip Option: Let the script gently nudge you toward potential bullish or bearish setups—only if you want it to!
Alerts for Everything: BOS and CHoCH can trigger alerts so you never miss a key structural change.
Give Market Rhythm a go, and watch your chart transform into a dynamic story of structure breaks, pivot swings, and potential trade cues. Whether you’re a short-term scalper or a higher-timeframe swing trader, this tool aims to simplify your analysis and keep you laser-focused on what matters.
Supertrend StatsSupertrend with Probabilistic Stats and MA Filter
Overview: The Supertrend with Probabilistic Stats and MA Filter is a comprehensive TradingView Pine Script indicator designed to enhance trading strategies by combining the trend-detection capabilities of the Supertrend indicator with the trend-confirmation strength of Moving Averages (MA). Additionally, it offers robust statistical tracking to provide traders with valuable insights into the performance and reliability of their trading signals.
Key Features:
Supertrend Indicator Integration:
Trend Detection: Utilizes the Supertrend algorithm to identify prevailing market trends.
Buy/Sell Signals: Generates clear buy and sell signals based on trend reversals.
Customizable Parameters: Allows adjustment of ATR period and multiplier to suit different trading styles and market conditions.
Visual Aids: Plots Supertrend lines on the chart and highlights trend areas for easy visualization.
Moving Average (MA) Filter:
Trend Confirmation: Filters buy signals to occur only when the open price is above the MA and sell signals only when the open price is below the MA.
Customizable MA Types: Supports various MA types, including SMA, EMA, SMMA (RMA), WMA, and VWMA.
Flexible Configuration: Offers options to enable/disable the MA filter, select MA type, set MA length, and adjust MA source and offset.
Statistical Tracking:
Trimmed Mean Calculation: Computes trimmed means for bullish and bearish movements, removing outliers to provide a more accurate average movement.
Success Rate Metrics: Calculates the success rates (%) for both bullish and bearish signals, indicating the percentage of signals that resulted in favorable price movements.
Candle Count Analysis: Tracks the average number of candles each bullish and bearish move lasts, offering insights into the duration of trends.
Data Visualization: Presents all statistical data in a neatly formatted table on the chart, allowing for quick reference and analysis.
Customizable Statistics Table:
Text Color Customization: Provides an option to change the table text color to match personal preferences or chart aesthetics, enhancing readability.
Comprehensive Metrics: Displays key statistics such as Bullish/Bearish Averages, Counts, Success Rates, and Average Candle Counts.
Optional Pinbar Filtering:
Signal Refinement: Adds an additional layer of signal confirmation by filtering buy and sell signals based on pinbar candlestick patterns.
Adjustable Thresholds: Allows customization of the pinbar wick threshold to fine-tune signal accuracy.
Visual Enhancements:
Markers: Optionally displays markers on the first and last candles of bullish and bearish moves for better trend identification.
Highlighter: Shades the chart background to indicate current trend direction, aiding in visual trend recognition.
How It Works:
Trend Identification with Supertrend:
The indicator calculates the Supertrend based on user-defined ATR periods and multipliers.
It plots the Supertrend lines and generates buy/sell signals when the price crosses these lines, indicating a potential trend reversal.
Filtering Signals with Moving Average:
When the MA filter is enabled, the indicator ensures that buy signals are only considered valid if the candle's open price is above the selected MA, and sell signals only if the open price is below the MA.
This additional confirmation aligns trades with the broader market trend, potentially increasing signal reliability.
Statistical Analysis:
Upon triggering a buy or sell signal, the indicator records the entry price and tracks the subsequent price movements.
It calculates trimmed means to assess average movements while excluding extreme outliers.
Success rates are computed by comparing the closing price against the entry price, indicating how often signals result in favorable outcomes.
The average number of candles per move provides insight into trend duration and volatility.
Visualization and Customization:
All statistical data is presented in a table on the chart, with customizable text colors for enhanced readability.
Optional pinbar filtering and visual markers further refine and illustrate trading signals, aiding in decision-making.
Benefits to Traders:
Enhanced Signal Reliability:
By combining Supertrend with an MA filter, the indicator ensures that only signals aligning with the broader market trend are considered, potentially reducing false signals.
Data-Driven Decision Making:
The comprehensive statistical tracking offers traders insights into the performance of their signals, enabling informed adjustments to their trading strategies based on empirical data.
Trend Confirmation and Alignment:
The MA filter acts as a trend confirmation tool, ensuring that trades are placed in the direction of the prevailing trend, which can enhance the probability of successful trades.
Performance Metrics at a Glance:
The statistics table provides all necessary performance metrics in a single view, allowing traders to quickly assess the effectiveness of their strategy without sifting through extensive data.
Customization and Flexibility:
With options to adjust MA types, lengths, and table text colors, traders can tailor the indicator to fit their specific preferences and trading environments.
Visual Clarity and Aids:
The plotted Supertrend lines, MA line, signal markers, and highlighter enhance visual clarity, making it easier to identify trends and potential trade opportunities on the chart.
Usage Instructions:
Adding the Indicator:
Copy the Script: Select and copy the entire Pine Script provided.
Open TradingView: Navigate to TradingView and open your desired asset's chart.
Access Pine Editor: Click on the Pine Editor tab at the bottom of the TradingView interface.
Paste and Add to Chart: Paste the script into the editor and click "Add to Chart" to apply the indicator.
Configuring Settings:
Supertrend Parameters: Adjust the ATR period and multiplier to suit your trading style and the asset's volatility.
MA Filter Settings:
Enable MA Filter: Toggle "Enable MA Filter?" to ON to activate the filter.
Select MA Type: Choose from SMA, EMA, SMMA (RMA), WMA, or VWMA.
Set MA Length: Define the period for the MA calculation.
MA Source and Offset: Choose the price source (default is close) and set any desired plot offset.
Statistical Tracking:
Trimmed Mean Percentage: Set the percentage to trim outliers in mean calculations.
Show Cross Markers: Toggle to display or hide markers on the first and last candles of bullish and bearish moves.
Table Customization:
Table Text Color: Select your preferred text color for the statistics table to match your chart's theme or enhance readability.
Pinbar Filtering (Optional):
Enable Pinbar Filtering: Toggle to refine signals based on pinbar patterns.
Set Pinbar Wick Threshold: Adjust the threshold to define the characteristics of a valid pinbar.
Interpreting the Indicators:
Buy/Sell Signals: Look for labeled "BUY" and "SELL" signals on the chart that align with Supertrend reversals and MA conditions.
Statistics Table: Refer to the table located at the bottom right of the chart to assess:
Bullish/Bearish Averages: Average price movements following signals.
Counts: Total number of bullish and bearish signals.
Success Rates (%): Percentage of signals that resulted in profitable trades.
Candle Averages: Average duration of bullish and bearish moves in terms of candle counts.
Markers and Highlighter: Utilize visual markers and shaded trend areas to better understand market trends and the context of each signal.
Making Informed Decisions:
Assess Signal Performance: Use the success rates and averages to evaluate the effectiveness of your current settings and make necessary adjustments.
Adjust Parameters: Modify Supertrend and MA parameters based on observed performance and changing market conditions to optimize signal accuracy.
Combine with Other Analysis: Integrate insights from this indicator with other technical analysis tools and fundamental factors to form a holistic trading strategy.
Conclusion: The Supertrend with Probabilistic Stats and MA Filter indicator offers a powerful combination of trend detection, signal filtering, and statistical analysis. By providing detailed performance metrics and ensuring that trades align with the broader market trend, this indicator empowers traders to make more informed, data-driven decisions. Whether you're a novice seeking clarity or an experienced trader aiming to refine your strategy, this tool serves as a valuable asset in your trading toolkit.
If you have any further questions or require additional customizations, feel free to reach out!
Open-Close Absolute Difference with Threshold CountsThe Open-Close Absolute Difference with Threshold Counts indicator is a versatile tool designed to help traders analyze the volatility and price movements within any given timeframe on their charts. This indicator calculates the absolute difference between the open and close prices for each bar, providing a clear visualization through a color-coded histogram.
Key features include:
• Timeframe Flexibility: Utilizes the current chart’s timeframe, whether it’s a 5-minute, hourly, or daily chart.
• Custom Thresholds: Allows you to set up to four custom threshold levels (Thresholds A, B, C, and D) with default values of 10, 15, 25, and 35, respectively.
• Period Customization: Enables you to define the number of bars (N) over which the indicator calculates the counts, with a default of 100 bars.
• Visual Threshold Lines: Plots horizontal dashed lines on the histogram representing each threshold for easy visual reference.
• Dynamic Counting: Counts and displays the number of times the absolute difference is less than or greater than each threshold within the specified period.
• Customizable Table Position: Offers the flexibility to position the results table anywhere on the chart (e.g., Top Right, Bottom Left).
How It Works:
1. Absolute Difference Calculation:
• For each bar on the chart, the indicator calculates the absolute difference between the open and close prices.
• This difference is plotted as a histogram:
• Green Bars: Close price is higher than the open price.
• Red Bars: Close price is lower than the open price.
2. Threshold Comparison and Counting:
• Compares the absolute difference to each of the four thresholds.
• Determines whether the difference is less than or greater than each threshold.
• Utilizes the ta.sum() function to count occurrences over the specified number of bars (N).
3. Results Table:
• Displays a table with three columns:
• Left Column: Counts where the absolute difference is less than the threshold.
• Middle Column: The threshold value.
• Right Column: Counts where the absolute difference is greater than the threshold.
• The table updates dynamically and can be positioned anywhere on the chart according to your preference.
4. Threshold Lines on Histogram:
• Plots horizontal dashed lines at each threshold level.
• Each line is color-coded for distinction:
• Threshold A: Yellow
• Threshold B: Orange
• Threshold C: Purple
• Threshold D: Blue
How to Use:
1. Add the Indicator to Your Chart:
• Open the Pine Editor on TradingView.
• Copy and paste the provided code into the editor.
• Click “Add to Chart.”
2. Configure Settings:
• Number of Bars (N):
• Set the period over which you want to calculate the counts (default is 100).
• Thresholds A, B, C, D:
• Input your desired threshold values (defaults are 10, 15, 25, 35).
• Table Position:
• Choose where you want the results table to appear on the chart:
• Options include “Top Left,” “Top Center,” “Top Right,” “Bottom Left,” “Bottom Center,” “Bottom Right.”
3. Interpret the Histogram:
• Observe the absolute differences plotted as a histogram.
• Use the color-coded bars to quickly assess whether the close price was higher or lower than the open price.
4. Analyze the Counts Table:
• Review the counts of occurrences where the absolute difference was less than or greater than each threshold.
• Use this data to gauge volatility and price movement intensity over the specified period.
5. Visual Reference with Threshold Lines:
• Refer to the horizontal dashed lines on the histogram to see how the absolute differences align with your thresholds.
Example Use Case:
Suppose you’re analyzing a 5-minute chart for a particular stock and want to understand its short-term volatility:
• Set the Number of Bars (N) to 50 to analyze the recent 50 bars.
• Adjust Thresholds based on the typical price movements of the stock, e.g., Threshold A: 0.5, Threshold B: 1.0, Threshold C: 1.5, Threshold D: 2.0.
• Position the Table at the “Top Right” for easy viewing.
By doing so, you can:
• Quickly see how often the stock experiences significant price movements within 5-minute intervals.
• Make informed decisions about entry and exit points based on the volatility patterns.
• Customize the thresholds and periods as market conditions change.
Benefits:
• Customizable Analysis: Tailor the indicator to fit various trading styles and timeframes.
• Quick Visualization: Instantly assess market volatility and price movement direction.
• Enhanced Decision-Making: Use the counts and visual cues to make more informed trading decisions.
• User-Friendly Interface: Simple configuration and clear display of information.
Note: Always test the indicator with different settings to find the configuration that best suits your trading strategy. This indicator should be used as part of a comprehensive analysis and not as the sole basis for trading decisions.
Export Candles DataThis program is written in Pine Script (version 5) and is designed to retrieve candlestick data (open, high, low, and close prices) from the TradingView chart. The data is displayed in a table located in the upper right corner of the chart.
Main Functions of the Program:
Retrieving candlestick data: The program processes data for the last 10 candlesticks on the selected timeframe (e.g., hourly, minute, etc.) in the TradingView chart. For each candlestick, it retrieves:
Time of the candle's close
Opening price
Highest price during the period
Lowest price during the period
Closing price
Displaying data in a table: The data is presented in a compact table located in the upper right corner of the chart. The table contains 5 columns:
Time of the candle's close (formatted as yyyy-MM-dd HH:mm)
Opening price
Highest price
Lowest price
Closing price
Clearing the table every 50 bars: To prevent the table from becoming overloaded, it clears itself every 50 bars, starting from the first row and first column.
Data updates dynamically: The table dynamically updates, displaying the latest 10 candles, allowing traders to track current market changes.
Application:
This indicator is useful for traders who want a quick view of key candlestick parameters directly on the chart.
The indicator can be easily applied to any instrument or index in TradingView, such as the IMOEX index.
The table view makes it easy to quickly analyze market movements without needing to inspect each candle individually.
How the Program Works:
On each new bar, the program checks the current bar's index.
The program clears the table if 50 bars have passed since the last clearing.
It writes the data of the last 10 candlesticks into the table: the time of the candle's close, opening price, highest and lowest prices, and closing price.
The table updates automatically and continuously displays the latest data.
This indicator is suitable for both short-term and long-term market analysis, providing a convenient and efficient way to monitor price movements directly on the chart.
RSI - ARIEIVhe RSI MAPPING - ARIEIV is a powerful technical indicator based on the Relative Strength Index (RSI) combined with moving averages and divergence detection. This indicator is designed to provide a clear view of overbought and oversold conditions, as well as identifying potential reversals and signals for market entries and exits.
Key Features:
Customizable RSI:
The indicator offers flexibility in adjusting the RSI length and data source (closing price, open price, etc.).
The overbought and oversold lines can be customized, allowing the RSI to signal critical market zones according to the trader’s strategy.
RSI-Based Moving Averages (MA):
Users can enable a moving average based on the RSI with support for multiple types such as SMA, EMA, WMA, VWMA, and SMMA (RMA).
For those who prefer Bollinger Bands, there’s an option to use the moving average with standard deviation to detect market volatility.
Divergence Detection:
Detects both regular and hidden divergences (bullish and bearish) between price and RSI, which can indicate potential market reversals.
These divergences can be customized with specific colors for easy identification on the chart, allowing traders to quickly spot significant market shifts.
Zone Mapping:
The script maps zones of buying and selling strength, filling the areas between the overbought and oversold levels with specific colors, highlighting when the market is in extreme conditions.
Strength Tables:
At the end of each session, a table appears on the right side of the chart, displaying the "Buying Strength" and "Selling Strength" based on calculated RSI levels. This allows for quick analysis of the dominant pressure in the market.
Flexible Settings:
Many customization options are available, from adjusting the number of decimal places to the choice of colors and the ability to toggle elements on or off within the chart.
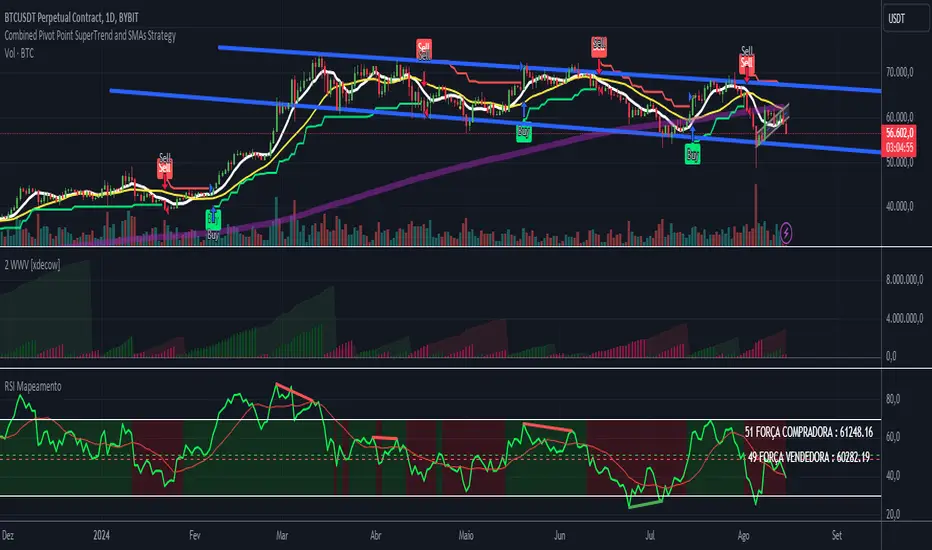
Volume, Volatility, and Momentum Metrics IndicatorVolume, Volatility, and Momentum Metrics Indicator
Welcome to our comprehensive TradingView indicator designed to provide traders with essential volume, volatility, and momentum metrics. This powerful tool is ideal for traders looking to enhance their market analysis by visualizing key indicators in a concise and easy-to-read format.
Key Features
1. Volume Metrics:
• Daily Dollar Volume: Understand the monetary value of the traded volume each day.
• Relative Volume (RVOL) Day: Compare the current volume to the previous day’s volume to gauge trading activity.
• Relative Volume (RVOL) 30D: Assess the average trading volume over the past 30 days.
• Relative Volume (RVOL) 90D: Evaluate the average trading volume over the past 90 days.
2. Volatility and Momentum Metrics:
• Average Daily Range (ADR) %: Measure the average daily price range as a percentage of the current price.
• Average True Range (ATR): Track the volatility by calculating the average true range over a specified period.
• Relative Strength Index (RSI): Determine the momentum by analyzing the speed and change of price movements.
3. Customizable Table Positions:
• Place the volume metrics table and the volatility/momentum metrics table in the bottom-left or bottom-right corners of your chart for optimal visibility and convenience.
Why Use This Indicator?
• Enhanced Market Analysis: Quickly assess volume trends, volatility, and momentum to make informed trading decisions.
• User-Friendly Interface: The clear and concise tables provide at-a-glance information without cluttering your chart.
• Customization Options: Choose where to display the tables to suit your trading style and preferences.
How It Works
This indicator uses advanced calculations to provide real-time data on trading volume, price range, and momentum. By displaying this information in separate, neatly organized tables, traders can easily monitor these critical metrics without diverting their focus from the main chart.
Who Can Benefit?
• Day Traders: Quickly gauge intraday trading activity and volatility.
• Swing Traders: Analyze longer-term volume trends and momentum to identify potential trade setups.
• Technical Analysts: Utilize comprehensive metrics to enhance technical analysis and trading strategies.
Get Started
To add this powerful indicator to your TradingView chart, simply search for “Volume, Volatility, and Momentum Metrics” in the TradingView public library, or use the provided link to add it directly to your chart. Enhance your trading analysis and make more informed decisions with our comprehensive TradingView indicator.

BTC Halving [YinYangAlgorithms]This Indicator not only estimates what it thinks may be the PRICE for the Start, High and Low of the Halving, but likewise estimates WHEN the Start, High and Low of Halving may be. It then creates Trend Lines based on these predictions so that you may get an evaluation towards if the Price is currently Overbought or Oversold. These Trend Lines may be very useful for seeing the Slope in which the Price may move if it is to reach the estimated Price by the estimated Date. By evaluating the Prices location based on these Trend Lines we may determine if the Price is currently Overbought or Oversold.
These Trend Lines likewise may help identify locations of Support and Resistance. If the Price is much higher than its current Trend Line it is Overbought. There is a chance it will Consolidate back to the Trend Line or it may even correct with a dump all the way back to it; the opposite is true if it is much lower than its current Trend Line.
Trend Lines and Estimates are not all that is featured within this Indicator however. There are also Price Zones which may help identify if the price is currently:
Very Overbought (Red)
Slightly Overbought (Orange)
Neutral (Yellow)
Slightly Oversold (Teal)
Very Oversold (Green)
These zones may help give you an idea of how the price is currently fairing and its potential for movement. Likewise, it may help define where Support and Resistance may be found.
The trend line estimates are done with an algorithm created to evaluate the difference between price and % change that has occurred between the Start, High and Low of all the halvings over how many days between each data type. This may allow us to make an educated estimate towards what Price and Date the Start, High and Low will occur at.
Our Zones are created by evaluating the current Market Cap and circulating supply vs Max Supply of BTC. This may help give us an evaluation of what Price may be considered to be Overbought and Oversold; and likewise may help with estimations of where there may be Support and Resistance based on these Zones.
Tutorial:
In the example above we’re displaying the Halving Start Trend Line, our Information Tables and our Estimated Halving Vertical Marker. This Trend Line may help to display not only the trajectory and slope the Price needs to take to reach the Estimated Halving Price by the Estimated Halving Date; but it may also help to show if the price is Overvalued or Undervalued based on its position above or below this Trend Line.
Based on the Trajectory of the Estimated High Upward Trend Line (Green Line) in the photo above and from the ‘High Date’ estimated in the Information tables; we may attempt to estimate the location the ATH of this Bull Market will create and the price slope it may follow in doing so. This Trajectory may be very useful for understanding the price action that may occur for it to reach the High estimated Price by the High estimated Date.
We currently allow for two different types of zones within our Settings, one called ‘Fast’ displayed in the example above; and the other called ‘Slow’ displayed in the example below.
Our Fast Zone aims to move the Zone Levels Faster in an attempt to move with volatility and parabolic movement. This may help to keep the Very Overbought (Red) and Very OverSold (Green) Levels more accurate by attempting to keep the price within them. By doing so, we may aim to keep all of the Slightly Overbought, Slightly Oversold and Neutral Levels more accurate as well.
The Levels within these zones are defined by the Bright (less transparent) Lines. Whereas the Darker (more transparent) lines represent the Basis Lines between two different levels. These Basis lines may likewise act as a Support and Resistance Location too, but generally hold less weight than the actual Levels themselves.
What you may see is that during the Bull Market, the price is within the very Overbought Zones and even touches again the Very Overbought Level a few times. Likewise, during the Bear Market, the price is within the very Oversold Zones and even slightly drops below the Very Oversold Level. This may be expected and likewise may help to give estimates at potential for growth and decay within the Price based on which condition the Market is within.
Slow Zones move a little slower than Fast Zones, however they may still be accurate. Likewise, it is up to you to decide which Zone works better for your specific Trading Style; however, by default, the Zone type is set to Fast.
If you refer to both the Fast and Slow examples above, you may notice in the Fast the Price is only slightly above the ‘Slightly Oversold’ (Teal) line. Also, In the Fast, the Price where the ‘Very Overbought’ Level is 100k. This is one of the many reasons we’ve opted for ‘Fast’ as the default, and it is because it allows more room for movement; and in our opinion, potentially accuracy as well.
If you refer to the Slow example, you’ll see that the price is currently facing the Neutral Level as a Resistance location. However, if you refer to the price residing at the Slows ‘Very Overbought’ Level, it is only 81.5k, compared to the 100k of Fast.
The BTC Halving is a major event that takes place roughly every 4 years. It historically has a major impact on the market, and some may even say it signifies the Start, or close to start of the Bull Market. Therefore, since historically there may be cycles that BTC and potentially crypto itself follows, we’ve developed this Indicator in hopes that it may solve one of the biggest questions traders face. What Date will the Start, High and Low of the Halving occur and also at what Price.
Hopefully this Tutorial has given you some guidance as to how this Indicator may be used to help identify some of these key levels; including the slope at which the price may have to move if it is to reach its projection Price by its projected Date.
Settings:
1. Show Prediction Trend Lines:
- Options:
All
Start + High
Start + Low
High + Low
Start
High
Low
None
- Description:
Prediction Trend Lines may be an important way to see the Slope the Price needs to take to reach the Predicted Price by the Predicted Date. This may be useful for identifying if the Price is currently Overbought or Oversold.
2. Zone Type:
- Options:
Fast
Slow
- Description:
Zone types change the way the Zones expand.
3. Show Zones:
- Options:
All
Zones
Basis
None
- Description:
Zones are a way of seeing Overbought and Oversold Price locations based on Market Cap and Circulating Supply vs Max Supply.
4. Vertical Markers:
- Options:
All
Line
Label
None
- Description:
Vertical Markers display where the Halving has occurred with a Vertical Line and Label.
5. Show Tables:
Tables may be useful for seeing the Price and Date for when the Start, High and Low of the Halving may occur.
6. Fill Zones:
Filling in Zones may help to identify which Zone the Price is currently in.
If you have any questions, comments, ideas or concerns please don't hesitate to contact us.
HAPPY TRADING!

Fib RSI++ by [JohnnySnow]Fib RSI++ by is an RSI Inspired by my absolutely favorite RSI on tradingview: RSI & EMA with Reverse Calculator Panel by balipour.
Built for quicker and easily identify prices at current RSI /possibly reversals/ RSI direction and RSI landings.
From balipour, I reuse /adapt to pinescriptV5 3 lines of code ( ) - the balipour implementation for reversing RSI formula in order to calculate price estimation based on the Given RSI level. Credits to the author.
Inspired by it, I also combine RSI with a MA but tuned to reads better the support/resistance levels (my humble opinion).
For quicker price target identification 2 features were added:
- Gridlines based on Fib levels, standard overbought/oversold levels and other levels I personally use. All of the grid lines can be configured according to user preferences.
- 2 information tables:
--First with a collection of 'close' numbers and Fib RSI levels price estimations at given RSI
--The second table allows the user to add up to 3 custom RSI levels to further target the price estimation.
Author UI Preferences to be used with this indicator: dark theme, hidden vertical and horizontal chart gridlines.

trend_vol_forecastNote: The following description is copied from the script's comments. Since TradingView does not allow me to edit this description, please refer to the comments and release notes for the most up-to-date information.
-----------
USAGE
This script compares trend trading with a volatility stop to "buy and hold".
Trades are taken with the trend, except when price exceeds a volatility
forecast. The trend is defined by a moving average crossover. The forecast
is based on projecting future volatility from historical volatility.
The trend is defined by two parameters:
- long: the length of a long ("slow") moving average.
- short: the length of a short ("fast") moving average.
The trend is up when the short moving average is above the long. Otherwise
it is down.
The volatility stop is defined by three parameters:
- volatility window: determines the number of periods in the historical
volatility calculation. More periods means a slower (smoother)
estimate of historical volatility.
- stop forecast periods: the number of periods in the volatility
forecast. For example, "7" on a daily chart means that the volatility
will be forecasted with a one week lag.
- stop forecast stdev: the number of standard deviations in the stop
forecast. For example, "2" means two standard deviations.
EXAMPLE
The default parameters are:
- long: 50
- short: 20
- volatility window: 30
- stop forecast periods: 7
- stop forecast standard deviations: 1
The trend will be up when the 20 period moving average is above the 50
period moving average. On each bar, the historical volatility will be
calculated from the previous 30 bars. If the historical volatility is 0.65
(65%), then a forecast will be drawn as a fuchsia line, subtracting
0.65 * sqrt(7 / 365) from the closing price. If price at any point falls
below the forecast, the volatility stop is in place, and the trend is
negated.
OUTPUTS
Plots:
- The trend is shown by painting the slow moving average green (up), red
(down), or black (none; volatility stop).
- The fast moving average is shown in faint blue
- The previous volatility forecasts are shown in faint fuchsia
- The current volatility forecast is shown as a fuchsia line, projecting
into the future as far as it is valid.
Tables:
- The current historical volatility is given in the top right corner, as a
whole number percentage.
- The performance table shows the mean, standard deviation, and sharpe
ratio of the volatility stop trend strategy, as well as buy and hold.
If the trend is up, each period's return is added to the sample (the
strategy is long). If the trend is down, the inverse of each period's
return is added to the sample (the strategy is short). If there is no
trend (the volatility stop is active), the period's return is excluded
from the sample. Every period is added to the buy-and-hold strategy's
sample. The total number of periods in each sample is also shown.
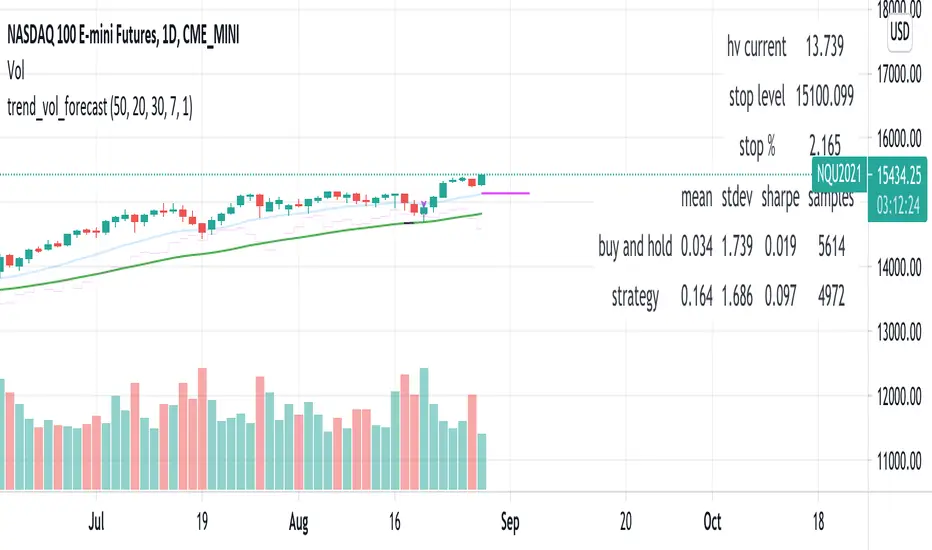
🎮 Liquidity Checklist – EFI + CMF + Centered MFIWhat it is
A confirmation dashboard combining EFI (Elder Force Index), CMF (Chaikin Money Flow), and MFI (Money Flow Index).
Provides a checklist table with / conditions, glow plots, and theme/override system. Intended as confirmation tool, not a standalone signal generator.
Why combine these three?
EFI (Force): captures impulse of price change × volume strength of push. CMF (Flow): measures accumulation/distribution capital inflow or outflow.
MFI (Liquidity/Momentum): RSI with volume liquidity stretch or balance.
Aligning force + flow + liquidity avoids weak setups and highlights agreement.
How it works
EFI: EMA of ( Close × Volume). Positive = buying pressure; Negative = selling pressure.
CMF: Money Flow Multiplier × Volume, averaged relative to total volume. Above 0 = inflow; Below 0 = outflow.
MFI: built-in 0 100 oscillator.
On chart: plotted centered as (MFI 50). In table: shown as real 0 100 value.
Checklist logic
Long bias: EFI > 0; CMF > 0; MFI > 35.
Short bias: EFI < 0; CMF < 0; MFI < 65.
Between 35 65, MFI may allow both long and short (neutral liquidity zone).
What s original here
Centered MFI plotting so all indicators share a zero baseline.
Dashboard checklist table with live indicator values.
Theme engine with custom color overrides (separate plot vs. table).
Normalization toggle for EFI/CMF readability on high-volume tickers.
Inputs & settings
Lengths: EFI (13), CMF (20), MFI (14).
Themes: Arcade, Feng Shui, Samurai, Irish, Cyberpunk.
Override plot colors option; table stays theme-based.
Normalize EFI/CMF (default OFF). ON scales EFI/CMF to 100 +100 for visual balance with MFI. Logic uses raw values.
How to read
Chart: EFI & CMF as glowing columns; MFI as centered line; reference lines at 0, +15 ( 65), 15
(35).
Table: / for each condition and live values; READY row lights when all align.
Suggested use
Use as confirmation filter:
1) Define trade idea (structure, catalyst).
2) Check EFI and CMF align with bias.
3) Confirm MFI not stretched (avoid longs >65, shorts <35).
4) Look for READY tick when all three align.
Works across timeframes; many prefer 15m 1H for intraday.
Limitations
Not a trading system on its own.
CMF may be na when High == Low.
Normalization affects visuals only, not logic. Always backtest and manage risk.
Credits
EFI by Alexander Elder. CMF by Marc Chaikin.
MFI standard oscillator.
Centered-MFI plotting, checklist UI, themes, normalization: NICK789.
Disclaimer
Educational use only; not financial advice.
No guarantees of accuracy or profitability.
Markets involve risk; past performance does not guarantee results.
