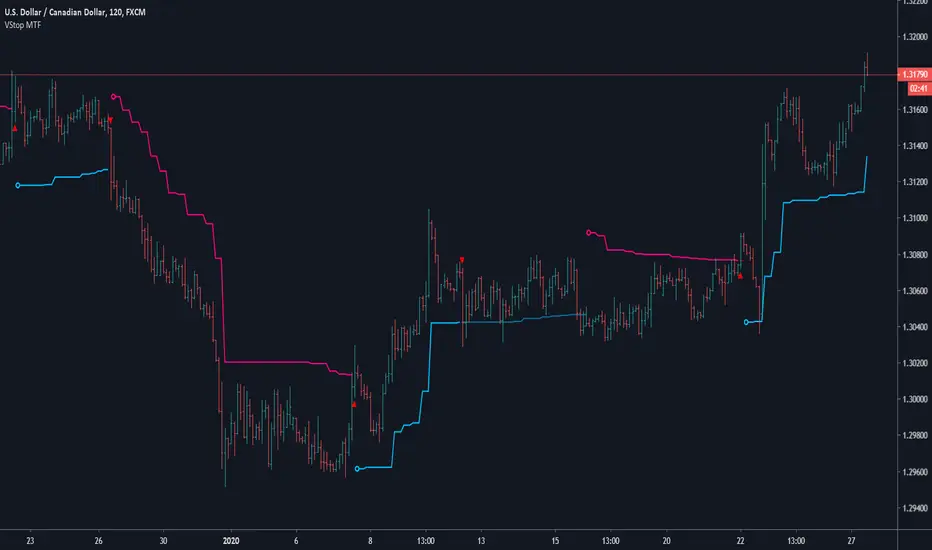
Volatility Stop MTFThis is a multi-timeframe version of our Volatility Stop , an ATR-based trend detector that can be used as a stop.
► Timeframe selection
The higher timeframe can be selected using 3 different ways:
• By steps (60 min., 1D, 3D, 1W, 1M, 1Y).
• As a multiple of the current chart's resolution, which can be fractional, so 3.5 will work.
• Fixed.
Note that you can also use this indicator without the higher timeframe functionality. It will then behave as our normal Volatility Stop would.
► Stop breaches
Two modes of stop-breaching logic can be selected.
• In the default, Early Breach mode, the stop is considered breached when a bar at the chart's current resolution breaches the higher timeframe stop.
• You may also choose to calculate breaches on the higher timeframe information only.
Choosing the Early Breach mode has the advantage of generating faster exits. It will create a state of limbo where the stop has been breached but the Volatility Stop trend has not yet reversed. The impact of detecting earlier exits to minimize losses comes, as is usually the case, at the cost of a compromise: if the stop is breached early in a long trend, the indicator will then spend most of that trend in limbo. Sizeable portions of a trend can thus be missed.
A few options are provided when you use Early Breach mode:
• A red triangle can identify early breaches (default).
• You can color bars or the background to identify limbo states.
When in limbo, the color used to plot the indicator's line or shapes will always be darker.
► Alerts
Five pre-defined alerts are supplied:
• #1: On any trend change.
• #2: On changes into an uptrend.
• #3: On changes into a downtrend.
• #4: Only on breaches of the uptrend by the chart's bars (Early Breach mode). Will not trigger on a trend change.
• #5: Only on breaches of the downtrend by the chart's bars (Early Breach mode). Will not trigger on a trend change.
As usual, alerts should be configured to trigger Once Per Bar Close . When creating alerts, you will see a warning to the effect that potentially repainting code is used, even if the indicator's default non-repainting mode is active. The warning is normal.
► Other features
• You can color bars using the indicator's up/down state. When bars are colored, up bars are more brightly colored.
• The HTF line is non-repainting by default, but you can allow it to repaint.
• You can confirm the higher timeframe used by displaying it at a selectable distance from the last bar on the chart.
• Choice of 2 color themes.
• Choice of display as a line, circles, diamonds or arrows. The line can be used with the other shapes. If no line is required, set its thickness to zero.
Enjoy!
Look first. Then leap.
Search in scripts for "Up down"
Run Up/Down TriggerTriggers for a sequential number of periods going up or down, with separate thresholds for up and down.
Pine Script® indicator
VRSI-MARSI AI wanted to create an indicator which resembles price movement, aside to volume movement.
MARSI (= MA RSI(close)) = "yellow-blue" line which is the MA(5) of the RSI (9) of closing price.
VRSI (= MA RSI(Volume)) = "orange" line which is the MA(5) of the RSI (9) of Volume .
(Default plot of RSI and VRSI is not visible but can be made visible ("Settings" > "Style" > set "Opacity" of "RSI & VRSI"))
Because it still is a RSI indicator, the midline (50), and Oversold/Overbought area's (20-30 & 70-80) are important to watch, especially the MARSI!
Comparing the price movement with the "orange" Volume VRSI line helps to spot a possible trend change,
for example when price goes up and an ascending Volume VRSI line starts to flatten or starts descending,
this could be a sign that the Bullish trend is weakening, predicting a possible trend change.
Or, when for example a downwards price movement is accompanied with a rising Volume VRSI line, this can be a sign of large Bearish power.
This study comes with Bollinger Bands as an assisting tool, it is default made not visible but can be made visible
("settings" > "style" > Set "Opacity" of "basis, upper & lower")
You can see where the MARSI ("yellow-blue" line) crosses the "basis", or bounces off the bands, ...
All this is seen in "VRSI-MARSI B"
"VRSI-MARSI A" contains the alerts:
1) Long/Short = "Triangle UP/DOWN", color: lime/red
Condition: Movement of MA(5) of RSI (9) of price (close )
2) Long2/Short2 = ">", color: lime/red
Condition: Long/Short condition is true for 2 or more bars (= continuation)
3) Long3/Short3 = "•", color: lime/red
Condition: MA RSI (Close) crosses MA RSI ( Volume )
1 or more alerts can easily be disabled if desired (settings > inputs)
Thanks!
-------------------------------------------------------------------------------------------------------------------------------------------------------------------------
More information available in the script ;-)
Pine Script® indicator
VRSI-MARSI BI wanted to create an indicator which resembles price movement, aside to volume movement.
MARSI (= MA RSI(close)) = "yellow-blue" line which is the MA(5) of the RSI (9) of closing price.
VRSI (= MA RSI(Volume)) = "orange" line which is the MA(5) of the RSI (9) of Volume .
(Default plot of RSI and VRSI is not visible but can be made visible ("Settings" > "Style" > set "Opacity" of "RSI & VRSI"))
Because it still is a RSI indicator, the midline (50), and Oversold/Overbought area's (20-30 & 70-80) are important to watch, especially the MARSI!
Comparing the price movement with the "orange" Volume VRSI line helps to spot a possible trend change,
for example when price goes up and an ascending Volume VRSI line starts to flatten or starts descending,
this could be a sign that the Bullish trend is weakening, predicting a possible trend change.
Or, when for example a downwards price movement is accompanied with a rising Volume VRSI line, this can be a sign of large Bearish power.
This study comes with Bollinger Bands as an assisting tool, it is default made not visible but can be made visible
("settings" > "style" > Set "Opacity" of "basis, upper & lower")
You can see where the MARSI ("yellow-blue" line) crosses the "basis", or bounces off the bands, ...
All this is seen in "VRSI-MARSI B"
"VRSI-MARSI A" contains the alerts:
1) Long/Short = "Triangle UP/DOWN", color: lime/red
Condition: Movement of MA(5) of RSI (9) of price (close )
2) Long2/Short2 = ">", color: lime/red
Condition: Long/Short condition is true for 2 or more bars (= continuation)
3) Long3/Short3 = "•", color: lime/red
Condition: MA RSI (Close) crosses MA RSI ( Volume )
1 or more alerts can easily be disabled if desired (settings > inputs)
Thanks!
-------------------------------------------------------------------------------------------------------------------------------------------------------------------------
More information available in the script ;-)
Pine Script® indicator
Visual RSI [LucF]Visual RSI offers a different way of looking at RSI by providing a composite representation of 9 different RSI-generated components. Instead of focusing on one line only, this approach blends multiple sources to provide the viewer with a larger context RSI-based picture.
For those who don’t want to read
• Green in bullish (>50) zone is the most bullish.
• Red in bullish zone doesn’t necessarily mean bearish—it just means bullish strength is weakening. It may be just a pause before a reprise or exhaustion signalling a reversal—impossible to tell.
• The same in inverse applies to the bearish zone (<50).
For those who want to understand
The nine components making up Visual RSI are:
• a current timeframe RSI
• a higher timeframe RSI
• the delta between these two RSI lines
• for each of these three basic components, two independent Bollinger band: one calculated for the bullish section of the scale (>50) and a separate one calculated for the lower bearish region.
Dual BBs
In my view, RSI’s position with regards to the centerline is much more important than its position in extreme areas. Why? Because the building block of RSI is the ratio of the averages of up/down moves during the RSI period. When the average of ups is greater, RSI is > 50. So while a rising signal starting from 20 let’s say, indicates that the rate of change is increasing, only when it crosses 50 can we say that sentiment balance has truly become bullish, and this information is more reliable than the signal being at a level corresponding to whatever estimate we make of what constitutes an extreme value. In my landscape, the general balance of a ratio provides more valuable information than the ratio’s exact value.
The idea behind the dual BBs is to provide independent tracking information for both halves of the indicator’s space, which I find more useful than the normal method of simply adding a multiple of the standard deviation on both sides of the mean. With dual BBs, the upper BB will never go lower than the indicator’s centerline, and the lower BB will never go higher. The upper BB focuses on upper-bound volatility when the signal is bearish, and the lower BB focuses on downside volatility when the signal is bearish.
The functions used to calculate the independent BBs are reusable on other signals if a centerline can be defined for them. A clamping percentage is implemented, so that when a BB line is hugging the centerline it clamps to it. This helps in providing earlier signals when they use the BB line states.
Providing context to RSI
What RSI measures indirectly is the balance in the rate of change—or the speed of price movement, but not its instant value, otherwise RSI would be even noisier. More precisely, RSI represents the relative strength of the up/down movement in the last n bars of RSI’s length, with 14 often used because that’s what Wilder proposed (Visual RSI’s defaults are 20 for the current timeframe and 40 for the higher timeframe). At every bar, a new value is added to the equation and an old value carrying equal weight is dropped, so a large dropped off value will have more impact on RSI’s value if the new bar’s move is small. This accounts for some of RSI’s speed in identifying exhaustion after important moves, but almost for some of its noise.
Visual RSI is the result of trying to drown RSI’s noise in the context of other informational streams, while simultaneously providing even faster information than RSI alone, by giving more visual weight to the delta between the current and higher timeframe RSI’s.
How to read Visual RSI
The default settings show all 9 basic components as green/red areas of intensities varying with their importance. The most intense colors are reserved for the delta RSI and the BBs have the lightest intensities. The individual lines of components are intentionally difficult to distinguish so that focus is first on the general picture, including the all-important six-state background, and then on the delta RSI.
One entry setup could be reversals in a larger trend context, so low pivots of the delta in a fully bullish context (a green background in the upper section of the indicator), and inversely, high pivots in a fully bearish context (a red background in the lower section of the indicator).
Please resist the common misconception, when interpreting RSI, that a reversal in the signal will necessarily lead to a reversal in price. Each trend has its rhythm. Only machine-generated price action can progress regularly. It’s normal for trends to take a breather for some time before they continue or reverse, as traders driving the trend experience emotional fatigue and gradual fear. RSI reversals merely signify that such a breather has occurred—nothing more. Only the larger context can provide information that can situate that pause and put more meaningful odds on it having more probability of continuing in one direction or the other. This is the reasoning behind the setup just described.
Features
• All components can be hidden, displayed as a simple line, a uniformly colored fill, or a green/red fill (the default).
• The background can be colored using 9 different methods, including 3 six-state methods using the rising/falling BB lines of the 3 basic components. These six states allow for bullish/bearish/neutral sentiment in both the upper and lower regions of the indicator. A bearish (dark red) background in the bullish (>50) section of the indicator represents decreasing bullishness. A bearish (slightly brighter red) in the bearish (<50) section of the indicator means incresingly bearish sentiment. The six-state backgrounds allow for neutral (no color) sentiment when no compelling signs can be found to conclude anything with meaningful odds. The default background uses the six-state method on the higher timeframe RSI’s BBs because I find it the most useful, as it represents the largest—and slowest—context sentiment among all the indicator’s components.
• A thin status bar in the top part of the indicator also allows selection of the same 9 methods to color it. The default is a triple-state system using the rising/falling characteristics of the current timeframe RSI’s BBs to provide a short-term counterbalance to the long-term background.
• Three different markers can be configured using approximately 70 permutations each, each filtered by 20 different filter permutations. When modification of the relevant parameters in the script’s Settings/Settings/Parameters section is added, possibilities are almost endless. If the generated signals are then fed into the PineCoders Engine and combined with the Engine’s own options, the permutations go up another order of magnitude, and changes to any setting can be instantly evaluated using the Engine’s backtesting results.
• Five simple filters can be combined. They are additive. They include volume-related conditions and a chandelier, which I find useful because both volume and volatility (the chandelier using highs/lows and ATR) are sensible complementary sources to RSI’s momentum information. The filter’s state can be shown as a thin line at the bottom of the indicator.
• Alerts can be configured using any of the marker/filter combinations mentioned. As usual, once your markers/filters are set up the way you want, create your alert from the chart/timeframe you want the alert to run on and be sure to use the “Once Per Bar Close” triggering condition. Use an alert message that will remind you of which combination of markers were used when creating the alert.
• A plot providing entry signals for the PineCoders Backtesting & Trading Engine is supplied. It will use whichever marker/filter configuration is active to generate signals.
• All higher timeframe information is non-repainting. Higher timeframe lines can be smoothed (the default). The selection of the higher timeframe can be made using 3 different methods:
1. By steps (if current timeframe <= 1 minute: 60 min, <= 60 min: 1D, <= 6H: 3D, <= 1D: 1W, <=1W: 1M, >1W: 12M)
2. By a user-defined multiple of the current timeframe
3. Using a fixed timeframe
Thanks to:
• Alex Orekhov aka @everget for the chandelier code.
• @RicardoSantos who through a small remark early on, unknowingly put me on the track of eliminating noise through visual crowding.
• The brilliant guys in the PineCoders Pro room for your knowledge, limitless creativity and constant companionship.
Pine Script® indicator
Chaikin Oscillator HystogramThis indicator shows an hystogram with the Chainkin Oscilator values, with color changes in function of the direction (up/down) . Also show the 0 crossovers, up and down.
Chaikin Oscillator gets its name from its creator, Marc Chaikin.
The Chaikin Indicator applies MACD to the accumulation-distribution line rather than closing price.
For me it's very usefull to identify (or confirm) trends up and trends down.
All my published scripts:
es.tradingview.com
Pine Script® indicator
Percentage OscillatorUsing momentum calculations on multiple time frames and adding everything together into 4 separate directions:
1- green: the strength and momentum in +45 to +90 degrees angle
2- blue: the strength and momentum in 0 to +45 degrees angle
3- orange: the strength and momentum in 0 to -45 degrees angle
4- red: the strength and momentum in -45 to -90 degrees angle
Single parameter to control the size of the largest moving window.
Uptrend is green with orange corrections
Downtrend is red with blue corrections
When downtrend turns into uptrend, blue becomes green
When uptrend turns into downtrend, orange becomes red
The natural cycle of the market is RED->BLUE->GREEN->ORANGE and so on, you will see the cycle repeats itself 3 times before a break up\down. The strength of the movement depends on the height and width of all the waves that created the 3 cycle movement (reminds Elliot in an oscillatory representation)
The script is provided as is, there are no trading strategies implied or recommended.
Feel free to PM with questions
Pine Script® indicator
Basic candle patternsBasic candle patterns marker marks:
- Doji stars
- Doji graves
- Doji dragonflies
- Hammers
- Reversed hammers
- Hanging mans
- Falling stars
- Absorption up/down
- Tweezers up/down
- Three inside ups/downs
Pine Script® indicator
Kawabunga Swing Failure Points Candles (SFP) by RRBKawabunga Swing Failure Points Candles (SFP) by RagingRocketBull 2019
Version 1.0
This indicator shows Swing Failure Points (SFP) and Swing Confirmation Points (SCP) as candles on a chart.
SFP/SCP candles are used by traders as signals for trend confirmation/possible reversal.
The signal is stronger on a higher volume/larger candle size.
A Swing Failure Point (SFP) candle is used to spot a reversal:
- up trend SFP is a failure to close above prev high after making a new higher high => implies reversal down
- down trend SFP is a failure to close below prev low after making a new lower low => implies reversal up
A Swing Confirmation Point (SCP) candle is just the opposite and is used to confirm the current trend:
- up trend SCP is a successful close above prev high after making a new higher high => confirms the trend and implies continuation up
- down trend SCP is a successful close below prev low after making a new lower low => confirms the trend and implies continuation down
Features:
- uses fractal pivots with optional filter
- show/hide SFP/SCP candles, pivots, zigzag, last min/max pivot bands
- dim lag zones/hide false signals introduced by lagging fractals or
- use unconfirmed pivots to eliminate fractal lag/false signals. 2 modes: fractals 1,1 and highest/lowest
- filter only SFP/SCP candles confirmed with volume/candle size
- SFP/SCP candles color highlighting, dim non-important bars
Usage:
- adjust fractal settings to get pivots that best match your data (lower values => more frequent pivots. 0,0 - each candle is a pivot)
- use one of the unconfirmed pivot modes to eliminate false signals or just ignore all signals in the gray lag zones
- optionally filter only SFP/SCP candles with large volume/candle size (volume % change relative to prev bar, abs candle body size value)
- up/down trend SCP (lime/fuchsia) => continuation up/down; up/down trend SFP (orange/aqua) => possible reversal down/up. lime/aqua => up; fuchsia/orange => down.
- when in doubt use show/hide pivots/unconfirmed pivots, min/max pivot bands to see which prev pivot and min/max value were used in comparisons to generate a signal on the following candle.
- disable offset to check on which bar the signal was generated
Notes:
Fractal Pivots:
- SFP/SCP candles depend on fractal pivots, you will get different signals with different pivot settings. Usually 4,4 or 2,2 settings are used to produce fractal pivots, but you can try custom values that fit your data best.
- fractal pivots are a mixed series of highs and lows in no particular order. Pivots must be filtered to produce a proper zigzag where ideally a high is followed by a low and another high in orderly fashion.
Fractal Lag/False Signals:
- only past fractal pivots can be processed on the current bar introducing a lag, therefore, pivots and min/max pivot bands are shown with offset=-rightBars to match their target bars. For unconfirmed pivots an offset=-1 is used with a lag of just 1 bar.
- new pivot is not a confirmed fractal and "does not exist yet" while the distance between it and the current bar is < rightBars => prev old fractal pivot in the same dir is used for comparisons => gives a false signal for that dir
- to show false signals enable lag zones. SFP/SCP candles in lag zones are false. New pivots will be eventually confirmed, but meanwhile you get a false signal because prev pivot in the same dir was used instead.
- to solve this problem you can either temporary hide false signals or completely eliminate them by using unconfirmed pivots of a smaller degree/lag.
- hiding false signals only works for history and should be used only temporary (left disabled). In realtime/replay mode it disables all signals altogether due to TradingView's bug (barcolor doesn't support negative offsets)
Unconfirmed Pivots:
- you have 2 methods to check for unconfirmed pivots: highest/lowest(rightBars) or fractals(1,1) with a min possible step. The first is essentially fractals(0,0) where each candle is a pivot. Both produce more frequent pivots (weaker signals).
- an unconfirmed pivot is used in comparisons to generate a valid signal only when it is a higher high (> max high) or a lower low (< min low) in the dir of a trend. Confirmed pivots of a higher degree are not affected. Zigzag is not affected.
- you can also manually disable the offset to check on which bar the pivot was confirmed. If the pivot just before an SCP/SFP suddenly jumps ahead of it - prev pivot was used, generating a false signal.
- last max high/min low bands can be used to check which value was used in candle comparison to generate a signal: min(pivot min_low, upivot min_low) and max(pivot max_high, upivot max_high) are used
- in the unconfirmed pivots mode the max high/min low pivot bands partially break because you can't have a variable offset to match the random pos of an unconfirmed pivot (anywhere in 0..rightBars from the current bar) to its target bar.
- in the unconfirmed pivots mode h (green) and l (red) pivots become H and L, and h (lime) and l (fuchsia) are used to show unconfirmed pivots of a smaller degree. Some of them will be confirmed later as H and L pivots of a higher degree.
Pivot Filter:
- pivot filter is used to produce a better looking zigzag. Essentially it keeps only higher highs/lower lows in the trend direction until it changes, skipping:
- after a new high: all subsequent lower highs until a new low
- after a new low: all subsequent higher lows until a new high
- you can't filter out all prev highs/lows to keep just the last min/max pivots of the current swing because they were already confirmed as pivots and you can't delete/change history
- alternatively you could just pick the first high following a low and the first low following a high in a sequence and ignore the rest of the pivots in the same dir, producing a crude looking zigzag where obvious max high/min lows are ignored.
- pivot filter affects SCP/SFP signals because it skips some pivots
- pivot filter is not applied to/not affected by the unconfirmed pivots
- zigzag is affected by pivot filter, but not by the unconfirmed pivots. You can't have both high/low on the same bar in a zigzag. High has priority over Low.
- keep same bar pivots option lets you choose which pivots to keep when there are both high/low pivots on the same bar (both kept by default)
SCP/SFP Filters:
- you can confirm/filter only SCP/SFP signals with volume % change/candle size larger than delta. Higher volume/larger candle means stronger signal.
- technically SCP/SFP is always the first matching candle, but it can be invalidated by the following signal in the opposite dir which in turn can be negated by the next signal.
- show first matching SCP/SFP = true - shows only the first signal candle (and any invalidations that follow) and hides further duplicate signals in the same dir, does not highlight the trend.
- show first matching SCP/SFP = false - produces a sequence of candles with duplicate signals, highlights the whole trend until its dir changes (new pivot).
Good Luck! Feel free to learn from/reuse the code to build your own indicators!
Pine Script® indicator
Renko CandlesticksRenko charts are awesome . They reduce noise by only painting a brick on the chart when price moves by a specified amount up/down. When the price reverses, it must go twice the specified amount before a brick is painted. Time is not a factor, just price movement. Sometimes however, you want the pros of a renko chart, but on a regular candlestick chart. This indicator attempts to do just that.
A band is placed around price action showing the upper and lower bounds of what would be the current renko brick. The band only goes up/down when the price action itself moves up/down by the amount you specify. There are several ways of specifying the amount:
Fixed Price Amount: As the name says, you enter the brick size amount, i.e. the amount the price has to move before being in a new brick.
% of Price: This method will calculate the amount the price has to move as a percentage of the price itself. This way as price goes up/down, your brick size will adjust accordingly. Recommended values would be around 1% or less.
% of ATR: This option will make the brick size a percentage of the Average True Range. You can specify the ATR time frame to be different from your current time frame as well as the ATR length. For instance you could be on a 10 minute chart but specify the ATR to be daily with a length of 3 and a percentage amount of 15. This would make your brick size 15% of the Average True Range for the last 3 days. Recommended values are 10 to 20%.
Use this indicator on any time frame, even the 1 minute as the renko bands span the price action the same way on any time frame easily letting you know whether or not the price has moved appreciably, regardless of how much time has passed.
You can also set alerts easily, simply set the alert to crossing and choose “Renko Candlesticks” instead of “Value”. You will then see the options for the renko upper and lower bounds.
Tested on Bitcoin with the following values:
Fixed Price Amount: 30 ($30)
% of Price: 0.45 (if Bitcoin is $7000 then the brick size would be $31.50)
% of ATR: 15%, ATR Time Frame: 1D, ATR Length: 3 (3 days)
Pine Script® indicator
Impulses-1Lines "Total Up Impulses" and "Total Down Impulses" are the sum of impulses in the last n periods (Length).
line 1 => "Total Up Impulses": the sum of up impulses.
line 2 => "Total Down Impulses": the sum of down impulses.
When line 1 crosses up line 2, it indicates an uptrend is comming out.
When line 1 crosses down line 2, it indicates a downtrend is comming out.
Pine Script® indicator
Fibonacci Commodity Stenth IndexFibonacci Commodity Strength Value tells us about the strength and weakness of bull or bear market.
The main focus in this is too be done at reversal. It can also be used for identifying fake ups/downs.
If all the 4 lines moves upward after a huge up spike, then notice the values of all 4 values. If red fib is smaller than green fib then it is a fake trend. If its more then its uptrend and same for bear movement. ;)
It also represents cci (in terms of values) and rsi (in terms of waves).
Enjoy !!!!!
Pine Script® indicator
Directional Movement Index - DMI | TR🎯 Overview
Directional Movement Index - DMI | TR is a comprehensive trend strength and direction indicator that measures the strength and direction of price movement. Developed by Tiagorocha1989, this enhanced version of Welles Wilder's classic DMI system offers multiple visualization modes, customizable moving averages, and comprehensive visual features to help traders identify trend direction, measure trend strength, and generate clear entry and exit signals.
🔧 How It Works
The DMI system consists of three key components: the Positive Directional Indicator (+DI), the Negative Directional Indicator (-DI), and the Average Directional Index (ADX). The relationship between +DI and -DI determines trend direction, while ADX measures trend strength regardless of direction.
Core Calculation Logic:
The indicator calculates directional movement by comparing current price highs and lows with previous periods to determine:
+DI (Positive Directional Indicator): Measures upward price pressure
-DI (Negative Directional Indicator): Measures downward price pressure
ADX (Average Directional Index): Smoothed average of the directional movement, indicating trend strength
The relationship between +DI and -DI creates the primary signals:
When +DI crosses above -DI → Bullish trend developing
When -DI crosses above +DI → Bearish trend developing
The spread between them indicates trend strength
Additionally, the indicator calculates DMI as the difference between +DI and -DI (+DI minus -DI), creating an oscillator that oscillates around zero:
Positive DMI values → Bullish momentum ( +DI above -DI)
Negative DMI values → Bearish momentum (-DI above +DI)
✨ Key Features
🔹 Multiple Display Modes
DMI Average Mode: Shows the DMI oscillator (+DI minus -DI) with signal line, providing a clean, oscillator-style view of directional balance
Normal DMI Mode: Displays the classic +DI and -DI lines for traditional analysis
ADX Mode: Shows the Average Directional Index for trend strength measurement
All modes can be combined for comprehensive analysis
🔹 Dual Operating Modes for Signals
Zero Line Mode: Signals occur when the DMI oscillator crosses above or below the zero line
DMI MA Mode: Enhanced mode where signals occur when DMI crosses its own moving average, providing filtered entries
🔹 Flexible Moving Average Selection
Choose from six MA types for the DMI MA mode:
EMA, SMA, RMA, WMA, VWMA, and HMA
🔹 Customizable DMI Parameters
Length: Lookback period for DMI calculation (default 8)
ADX Smoothing: Additional smoothing for ADX calculation (default 1)
🔹 Customizable Color Themes
Eight distinct color schemes to match your charting preferences:
Classic – Green for bullish, Red for bearish
Modern – White for bullish, Purple for bearish
Robust – Amber for bullish, Maroon for bearish
Accented – Violet for bullish, Pink for bearish
Monochrome – Light gray for bullish, Dark gray for bearish
Moderate – Green for bullish, Red for bearish
Aqua – Blue for bullish, Orange for bearish
Cosmic – Pink for bullish, Purple for bearish
🔹 Comprehensive Visual Feedback
DMI Oscillator: Colored line showing the difference between +DI and -DI
Signal Line: Yellow line for MA-based signals
Gradient Fill Zones: Clear visualization of extreme readings
Dynamic Zone Fills: Semi-transparent fills showing when DMI is above or below the signal line
+DI and -DI Lines: Optional display of classic directional indicators
ADX Line: Optional blue line showing trend strength
Color-Coded Candles: Bars reflect current trend direction based on +DI/-DI relationship
Signal Markers: Triangle up/down symbols at crossover points
Live Value Display: Floating labels showing current values for each enabled component
Trend Table: Bullish/Bearish status displayed on the chart
🔹 Ready-to-Use Alerts
Built-in alert conditions trigger LONG signals when +DI crosses above -DI, and SHORT signals when +DI crosses below -DI.
⚙️ Settings Summary
Color Choice: Select from eight visual themes (Default: Classic)
DMI Display: Toggle to show the DMI Average oscillator (Default: Enabled)
Length: Lookback period for DMI calculation (Default: 8)
Entry/Exit Signal: Choose between zero line or DMI MA mode (Default: Zero Line)
Length MA: Moving average period for DMI MA mode (Default: 365)
DMI MA Type: Moving average method for signal line (Default: EMA)
Normal DMI: Toggle to show classic +DI and -DI lines (Default: Disabled)
ADX Smoothing: Toggle to show ADX with adjustable smoothing (Default: Disabled)
📈 Practical Applications
🔹 Trend Direction Identification
The primary use of the DMI system is identifying trend direction:
+DI above -DI → Bullish trend
-DI above +DI → Bearish trend
The wider the separation, the stronger the trend
🔹 Trend Strength Measurement
The ADX component quantifies trend strength regardless of direction:
ADX below 20 → Weak or non-trending market
ADX between 20-40 → Trending market with moderate strength
ADX above 40 → Strong trend (can signal trend exhaustion in some cases)
🔹 Crossover Signals
Crossovers between +DI and -DI provide classic entry signals:
+DI crosses above -DI → Potential LONG entry
-DI crosses above +DI → Potential SHORT entry
🔹 DMI Oscillator Analysis
The DMI oscillator (+DI minus -DI) offers additional insights:
Positive values indicate bullish dominance
Negative values indicate bearish dominance
Crossovers of the zero line confirm trend changes
Crossovers of the moving average provide filtered signals
🔹 Trend Exhaustion Detection
When ADX reaches very high levels (above 50-60) after a prolonged trend, it may indicate trend exhaustion and potential reversal. Combined with a narrowing spread between +DI and -DI, this can signal trend weakening.
🔹 Multiple Timeframe Confirmation
Compare DMI readings across different timeframes:
Higher timeframe DMI confirms primary trend direction
Lower timeframe DMI identifies entry timing
🎯 Ideal For
✅ Trend Traders seeking to identify and follow established trends
✅ Swing Traders wanting to capture medium-term directional moves
✅ System Developers needing reliable trend direction signals
✅ Multi-Timeframe Analysts comparing trend strength across periods
✅ Risk Managers assessing whether markets are trending or ranging
📌 Key Takeaways
Comprehensive Trend Analysis: Combines direction (+DI/-DI), strength (ADX), and oscillator views in one indicator
Multiple Display Modes: Choose between classic +DI/-DI lines, DMI oscillator, or ADX based on your analysis style
Dual-Mode Signal Generation: Zero line crossovers for classic signals or MA-smoothed signals for filtered entries
Rich Visual Feedback: Color themes, gradient fills, candles, and floating labels provide immediate market awareness
Alert-Ready: Built-in alerts for trend change signals when +DI crosses -DI
⚠️ Important Notes
The DMI system works best in trending markets and can produce false signals in ranging conditions. ADX does not indicate direction, only strength; always use it in conjunction with +DI/-DI. The 365-day MA default in DMI MA mode is designed for longer-term trend context on daily charts. Consider using ADX above 20-25 to filter for trending conditions before taking crossover signals. Always combine with proper risk management and additional confirmation for best results.
Disclaimer: This indicator is provided for educational and informational purposes only. Past performance is not indicative of future results. Always conduct thorough testing and align with your risk management strategy before live deployment.
Pine Script® indicator
Awesome Oscillator - AO | TR🎯 Overview
Awesome Oscillator - AO | TR is a sophisticated momentum indicator that measures market momentum by calculating the difference between two moving averages of different lengths. Developed by Tiagorocha1989, this enhanced version of Bill Williams' classic Awesome Oscillator offers dual-mode operation, extensive moving average customization, and comprehensive visual features to help traders identify momentum shifts, divergences, and potential trend reversals with greater precision.
🔧 How It Works
The Awesome Oscillator measures market momentum by comparing short-term and long-term price action, creating a histogram that oscillates above and below a zero line. When the short-term moving average is above the long-term moving average, the oscillator is positive (bullish), and when it's below, the oscillator is negative (bearish).
Core Calculation Logic:
The indicator calculates the difference between two moving averages applied to the same price source. The first moving average uses a shorter period (default 22) to capture recent price action, while the second uses a longer period (default 49) to establish the broader trend context.
The resulting value creates a histogram where:
Positive values (above zero or the signal line) indicate bullish momentum
Negative values (below zero or the signal line) indicate bearish momentum
The slope and direction of the oscillator reveal momentum acceleration or deceleration
In standard mode, signals are generated based on crossovers of the zero line. In AO MA mode, signals are based on crossovers between the oscillator and a smoothed moving average line, providing filtered entries.
✨ Key Features
🔹 Dual Operating Modes
Zero Line Mode: Classic Awesome Oscillator implementation where signals occur when the oscillator crosses above or below the zero line
AO MA Mode: Enhanced version where signals occur when the oscillator crosses a user-defined moving average, providing smoother, more filtered signals
🔹 Flexible Moving Average Selection
Choose from six MA types for both the oscillator calculation and the signal line:
EMA (Exponential Moving Average) for responsive signals
SMA (Simple Moving Average) for smoother readings
RMA (Rolling Moving Average) for weighted recent data
WMA (Weighted Moving Average) for customizable weighting
VWMA (Volume-Weighted Moving Average) incorporating volume
HMA (Hull Moving Average) for reduced lag
🔹 Dual Period Settings
First AO Length: Shorter period for the fast moving average (default 22)
Second AO Length: Longer period for the slow moving average (default 49)
🔹 Customizable Color Themes
Eight distinct color schemes to match your charting preferences:
Classic – Green for bullish, Red for bearish
Modern – White for bullish, Purple for bearish
Robust – Amber for bullish, Maroon for bearish
Accented – Violet for bullish, Pink for bearish
Monochrome – Light gray for bullish, Dark gray for bearish
Moderate – Green for bullish, Red for bearish
Aqua – Blue for bullish, Orange for bearish
Cosmic – Pink for bullish, Purple for bearish
🔹 Comprehensive Visual Feedback
Dual Visualization Modes: Line style or column histogram based on user preference
Gradient Fill Zones: Clear visualization of overbought and oversold conditions
Color-Coded Candles: Bars reflect current momentum direction
Signal Markers: Triangle up/down symbols at crossover points
Live Value Display: Current AO value shown in a floating label
Trend Table: Bullish/Bearish status displayed on the chart
🔹 Ready-to-Use Alerts
Built-in alert conditions trigger LONG signals on bullish crossovers and SHORT signals on bearish crossunders across both operating modes.
⚙️ Settings Summary
Color Choice: Select from eight visual themes (Default: Classic)
AO Display: Toggle between line style or column histogram (Default: Line)
First AO Length: Short-term moving average period (Default: 22)
Second AO Length: Long-term moving average period (Default: 49)
AO Source: Price source for calculations (Default: Close)
AO Moving Average Type: MA method for oscillator calculation (Default: EMA)
Entry/Exit Signal: Choose between zero line or AO MA mode (Default: AO MA)
Length AO MA: Signal line moving average period (Default: 730)
AO MA Type: Moving average method for signal line (Default: EMA)
📈 Practical Applications
🔹 Momentum Shift Detection
The primary use of the Awesome Oscillator is identifying when momentum is changing. When the histogram crosses from negative to positive, it suggests bullish momentum is building. Crosses from positive to negative indicate bearish momentum is emerging.
🔹 Divergence Trading
One of the most powerful applications is spotting divergences between price and the oscillator:
Bullish Divergence: Price makes a lower low while AO makes a higher low, suggesting upcoming upside reversal
Bearish Divergence: Price makes a higher high while AO makes a lower high, warning of potential downside reversal
🔹 Zero Line Crossovers
In Zero Line mode, crossovers provide clear entry signals:
Crossover above zero → LONG signal
Crossunder below zero → SHORT signal
🔹 Signal Line Crossovers
In AO MA mode, crossovers between the oscillator and its moving average provide filtered signals that reduce whipsaws in choppy markets.
🔹 Twin Peaks Strategy
Look for two consecutive peaks in the same direction:
Bullish Twin Peaks: Two lows below zero, with the second low higher than the first, followed by a crossover above the signal line
Bearish Twin Peaks: Two highs above zero, with the second high lower than the first, followed by a crossunder below the signal line
🔹 Saucer Pattern
When the histogram changes from red to green (or vice versa) with a smooth, rounded shape, it suggests a gradual momentum shift that often leads to sustainable moves.
🎯 Ideal For
✅ Momentum Traders seeking to identify when momentum is accelerating or decelerating
✅ Divergence Traders looking for hidden reversal signals before they appear on price
✅ Swing Traders wanting to capture medium-term momentum shifts
✅ System Developers needing reliable crossover logic for automated strategies
✅ Multi-Timeframe Analysts comparing momentum across different periods
📌 Key Takeaways
Dual-Mode Flexibility: Choose between classic zero-line crossovers for maximum sensitivity or MA-smoothed signals for cleaner entries
Customizable Calculation: Six MA types for both oscillator and signal line allow fine-tuning for any market condition
Comprehensive Visualization: Color themes, gradient fills, candles, and labels provide immediate momentum awareness
Divergence Capability: Excellent for spotting both regular and hidden divergences that signal trend reversals or continuations
Alert-Ready: Built-in alerts for both LONG and SHORT signals across both operating modes
⚠️ Important Notes
The Awesome Oscillator works best in trending markets and can produce false signals in ranging conditions. Consider combining with trend filters or using the AO MA mode for smoother signals in choppy markets. The 730-day MA default in AO MA mode is designed for longer-term trend context on daily charts. Always combine with proper risk management and additional confirmation for best results.
Disclaimer: This indicator is provided for educational and informational purposes only. Past performance is not indicative of future results. Always conduct thorough testing and align with your risk management strategy before live deployment.
Pine Script® indicator
Multi-Coin SpaghettiMulti-Coin Spaghetti is a Pine Script v6 indicator for comparing the relative performance of multiple crypto symbols in one dedicated indicator pane.
Inspiration and originality
Inspired in part by "Multi-Asset Performance - By Leviathan".
Implementation logic in this script was written from scratch.
Some feature ideas (including parts of table analytics) were adapted conceptually and reimplemented for this workflow.
What this indicator does
Plots up to 20 symbols as percentage-change lines from a shared anchor.
Uses one bulk Ticker List text field so you can copy/paste many symbols at once.
Supports two comparison modes:
Raw %: each symbol's own anchored return.
Relative to Base: each symbol's outperformance/underperformance versus a selected base ticker.
Supports anchor/reset modes:
Visible Range
Timestamp Anchor
Time-based periods from 5m to 1Y
Includes group context:
Mean line
Optional +/- N sigma deviation bands
Outlier and threshold alerts
Includes an auto-ranked table (sorted by current % each bar):
Rank: current position by % value (1 = strongest)
Symbol: ticker name (base row is marked)
%: anchored performance from selected period start (depends on Comparison Mode: Raw % or Relative to Base)
Delta %: bar-to-bar change in the above % value
Direction: quick up/down/flat signal from Delta %
RSI: 14-period RSI of that symbol
r: correlation of percentage returns vs selected base ticker over 20 bars
beta: relative volatility vs the selected base ticker
Why the symbol input workflow matters
Many multi-symbol scripts require one-by-one symbol fields.
This script is designed for fast bulk paste setup using Pine v6 string/array handling.
Useful when rotating baskets frequently.
How symbol resolution works
Input supports comma-separated or newline-separated symbols.
Bare symbols can be auto-resolved using selected Exchange + Quote Currency + Market Type.
Fully qualified symbols containing ":" are preserved (uppercased only).
Futures mode appends ".P" where needed. Spot mode does not.
Max active symbols: 20.
Functional options and purpose
Color palettes (Vivid, Jewel Tones, Pastel): tune contrast/readability for your chart theme.
Color modes:
All Colored: identity tracking for each line.
Threshold Highlight: each symbol's indicator performance line is green if current % > +X, red if < -X, otherwise dim gray.
Threshold Highlight affects indicator lines only. It does not color main-chart candles.
Highlight Selected Ticker: isolate one symbol to inspect leadership/lagging behavior while fading others.
Highlight Selected Ticker works only for symbols already present in Ticker List; non-listed symbols are ignored.
Smoothing (SMA): reduce noise for cleaner trend comparison (with lag tradeoff).
Period separators: make reset boundaries visually explicit.
Table color modes (Threshold, Line Color, Gradient, None): choose emphasis style for your workflow.
Status table: warns when more than 20 symbols are requested or data is missing.
Important behavior notes
In Visible Range mode, values re-anchor when you scroll/zoom. Historical values can move after viewport changes.
For stable alerting behavior, prefer Timestamp or fixed time-based period modes.
Missing market data for a symbol can result in no plotted line for that slot.
Comparative analytics tool only, not financial advice.
How to view it clearly on chart
This script runs in a separate indicator pane (not over price candles).
For best readability: shrink the main price pane and expand the indicator pane.
Hide unnecessary chart elements/other indicators to make lines and table easier to read.
Alert conditions included
Deviation Outlier Cross
Threshold Upside Cross
Threshold Downside Cross
How to add alerts in TradingView
Add the indicator to chart.
Click Alert (clock icon) or press Alt + A.
In Condition, choose this script name.
Select one of the script conditions:
Deviation Outlier Cross
Threshold Upside Cross
Threshold Downside Cross
Set alert frequency and expiration.
Configure notification channels (popup/app/email/webhook).
Create the alert.
Alert interpretation
Threshold alerts: trigger when a symbol crosses above +Threshold or below -Threshold.
Deviation alerts: trigger when a symbol crosses outside configured deviation context.
In Visible Range mode, historical trigger locations can shift after viewport changes.
Pine Script® indicator
Impulse Trend ArrowsThis indicator is a volatility-normalized momentum + trend state tool designed to provide a clean “market regime” read: UP / DOWN / NEUTRAL, with optional visual confirmation on the chart. Works on collection of clasic indicators RSI, EMA + ATR and some simple math.
🧭 Trend state behavior
When a new BUY/SELL impulse is confirmed, the script updates a persistent trend state (“BUY”, “SELL”, or “NONE”).
That state stays active until the opposite confirmed impulse appears.
✅ Visuals & Usage
Made some minor, mostly visual upgrades on this release:
Baseline + ATR bands are smoothed for cleaner visuals.
Optional BUY/SELL arrows are plotted outside the channel to avoid overlap with channel.
Optional full-chart background shading reflects the current trend state:
Green = UPTREND
Red = DOWNTREND
A minimal top panel shows the current regime (UP / DOWN / NEUTRAL).
I also recently added this channel smoother parameter (for Dragon Channel), if you want it to have less spikes on those MAs just use the bigger number, I picked 8 for default.
Pine Script® indicator
Snail Sequence + SnailST Levels + CVD/OI Div by TheActualSnail Snail Sequence + SnailST Levels + Order Flow (CVD/OI) by TheActualSnail
Overview
This indicator combines Snail Sequence price exhaustion logic with SnailST Levels (structure) and an order-flow proxy (CVD) plus optional Open Interest confirmation to build a multi-layer confluence model.
Instead of relying on a single signal, it looks for agreement between:
• Exhaustion signals (Setup 8/9 and the 13-step Exhaustion Run)
• Structural context (SnailST Support/Resistance levels)
• Order-flow behavior (CVD divergences and CVD slope)
• Participation context (optional Open Interest filters/confirmation)
The goal is not to call exact tops or bottoms. It’s to highlight zones where probability shifts because multiple independent factors align.
________________________________________
How This Can Be Used As Confluence
This tool is built to answer one question:
“Is there enough evidence that momentum or positioning is changing?”
Typical high-quality situations
Bullish Confluence
• Buy Setup 8/9 or Exhaustion Run 13 appears
• Price holds/reclaims SnailST Support (or breaks above resistance depending on regime)
• CVD prints bullish divergence or CVD slope turns positive
• (Optional) Open Interest conditions align (trend/squeeze logic)
Bearish Confluence
• Sell Setup 8/9 or Exhaustion Run 13 appears
• Price rejects SnailST Resistance (or loses support depending on regime)
• CVD prints bearish divergence or CVD slope turns negative
• (Optional) Open Interest conditions align (trend/squeeze logic)
The Bias Engine aggregates these conditions and prints a BULLISH or BEARISH label only when enough factors agree. This helps reduce random signals and focuses attention on high-participation turning points or continuation zones.
________________________________________
Settings Explained
1) UI & Label Controls
Label Size
Adjusts visibility of numbers and signal labels.
Limit labels to last N bars
Prevents clutter by showing only recent labels.
N bars
How far back labels are allowed to appear.
________________________________________
UI — Number Offsets
(Visual only: moves the printed numbers away from candles.)
Number offset mode (Ticks / ATR)
• Ticks: fixed spacing
• ATR: spacing scales with volatility
ATR length
ATR period used when ATR mode is selected.
Numbers offset (ticks / ATR mult)
Moves number labels up/down to avoid overlapping price candles.
________________________________________
UI — Big Label Placement
(Controls where divergence and bias labels print.)
Bias/Div placement (Auto / Force Above / Force Below)
• Auto = bearish above / bullish below
• Force options override direction
Bias/Div offset (price)
Pushes big labels away from price (useful on BTC/high-vol pairs).
________________________________________
2) Snail Sequence Settings
Setup (1–9)
Require Price Flip to start Setup
Stricter logic. Helps avoid counting setups in messy transitions.
Buy Setup / Sell Setup
Enable or disable either side.
Show only 8/9 (hide 1–7)
Cleaner chart for traders who only care about exhaustion zones.
________________________________________
Exhaustion Run (1–13)
Show Exhaustion Run
Displays the 13-step exhaustion sequence.
Cancel Run on Opposite Setup 9
Stops the run if a full opposite setup completes.
Require 13 qualified vs 8
Stricter “completion” requirement. Helps filter weaker 13s.
Show Run 8 Marker
Highlights the key intermediate step.
________________________________________
Perfected Signals
Mark Perfected 8/9
Highlights higher-quality 8/9 conditions.
Show Perfected Later Arrows
Marks when a setup becomes “perfected” later after completion.
________________________________________
SnailST Levels (Structure)
SnailST Downside (Support) / SnailST Upside (Resistance)
Plots structure levels derived from completed setups.
These often act as:
• Reaction / liquidity zones
• Breakout confirmation levels
• Invalidation context
________________________________________
Recycling (Advanced)
Enable Recycling Markers (R/S)
Optional markers for extended cycles/reset logic.
Recycle Marker (R)
Triggers when the run drags on too long without resolving.
Recycle Marker (S) + multiplier
Compares setup range expansion vs prior setup to flag “size-based recycling.”
________________________________________
Sequence Colors
Visual customization for setups, perfected marks, run values, SnailST levels, and recycling markers.
________________________________________
3) Order Flow (CVD) Settings
This module estimates buy vs sell pressure using intrabar volume and builds a running CVD.
Calculation
Lower TF for intrabars
Smaller timeframe = more precise, but heavier to compute.
Delta mode (Delta / Delta %)
• Delta: raw difference
• Delta %: normalized by total volume
CVD reset
Controls when CVD restarts (daily/weekly/monthly/session/fixed time).
________________________________________
Open Interest (Optional)
Enable Open Interest / OI symbol
Pulls OI from your selected symbol.
Use OI MA (internal) + MA length
Smoothing helper (used internally).
OI trend length
Defines “rising/falling” detection window.
Filter divergence labels by OI
Only show divergences when OI direction matches your selected rule.
________________________________________
Divergences
Enable divergence labels
Turns divergence labels on/off.
Pivot length
Sensitivity for swing detection (bigger = fewer, stronger signals).
Use wicks for pivots
More aggressive pivot detection.
Min CVD difference (filter)
Filters weak divergences.
Also show hidden divergences
Adds continuation-style divergences.
________________________________________
4) Bias Engine (Signal Aggregator)
This is the confluence core. It scores:
• Sequence events (Setup 8/9 or Run 13)
• CVD divergences (regular/hidden)
• CVD slope filter
• SnailST context (buffered)
• Optional OI confirmation (if enabled)
Then prints BULLISH or BEARISH only if enough factors align.
Mode (Aggressive / Balanced / Conservative)
Controls how many confirmations are required.
SnailST buffer (ticks)
Adds a buffer around SnailST levels to reduce “noise touches.”
Bias label cooldown (bars)
Prevents repeated labels in tight ranges.
________________________________________
5) Alerts
Alerts are available for:
• Buy Setup 9 / Sell Setup 9
• Buy Run 13 / Sell Run 13
• Bullish/Bearish CVD Divergence
• Bullish/Bearish Bias (Sequence + OF)
________________________________________
Best Practices
• Use it as confirmation, not a standalone entry button.
• Higher timeframes usually produce cleaner signals.
• Combine with structure tools (key levels, VWAP, liquidity zones).
• Treat Setup 8/9 and Run 13 as potential exhaustion, not guaranteed reversals.
________________________________________
Disclaimer
This script is provided for educational and informational purposes only.
It does not constitute financial, investment, or trading advice.
Markets are probabilistic and no indicator can guarantee outcomes.
Always manage risk and make independent decisions based on your own analysis and circumstances.
Pine Script® indicator
DSMS - DeltaSurge Matrix Station - 1M Scalping [SurgeGuru]DSMS - DeltaSurge Matrix Station
HOW TO READ THE CHART
=====================================
This guide explains every visual element you see on the chart.
DSMS is a volume profile + order flow indicator built for 1-minute Bitcoin scalping.
It shows WHERE institutional money is sitting and WHERE price is likely to react next.
=====================================
1. THE VOLUME PROFILE (left side of chart)
=====================================
The colored horizontal bars extending left from the candles are the volume profile.
Each bar represents a price level (called a "bin") and shows how much volume traded there.
LONGER BAR = more volume at that price.
BAR COLOR tells you who is in control:
- Green/teal bar = buyers dominated that level (bullish delta)
- Red/orange bar = sellers dominated that level (bearish delta)
- The more intense the color, the stronger the imbalance
SPLIT BARS (bull/bear breakdown):
If enabled, each bar splits into two halves showing exact buy vs sell volume.
Top half = sell volume, bottom half = buy volume.
HEATMAP (wide faded bars behind the profile):
The large transparent boxes behind the profile bars are the heatmap.
They show the same delta information but stretched wider for quick visual scanning.
Bright = high conviction. Faded = low conviction.
=====================================
2. KEY PRICE LEVELS ON THE PROFILE
=====================================
POC (Point of Control):
The bin outlined with a bright border is the POC -- the single price level
with the MOST volume. Price tends to gravitate back to the POC.
A small label shows the POC price and context like "EQUILIBRIUM" or "BULL ATK".
POC FLASH LINE:
A short dashed cyan line appears at the POC when a bounce is detected.
Trigger conditions: price is at the POC, the current candle is bullish after
a bearish candle, and volume is at least 1.2x average. This signals that
the POC is acting as active support and price is reacting to it in real time.
VA HIGH / VA LOW (Value Area lines):
Two horizontal lines mark the top and bottom of the Value Area -- the price range
where approximately 70% of volume traded. These act as support and resistance.
- VA High = resistance when price is below, breakout level when price pushes above
- VA Low = support when price is above, breakdown level when price drops below
When a breakout happens, the line turns green (up) or red (down) and gets thicker.
=====================================
3. LABELS ON PROFILE BINS
=====================================
Each profile bin can show a small text label. These describe what is happening
at that specific price level. Here is what each label means:
ABS (with up/down arrow):
"ABS▼ 7b" = Absorption detected. Institutional players are absorbing selling
pressure at this level (likely accumulating). The "7b" means it held for 7 bars.
ABS▼ = absorbing sells (bullish). ABS▲ = absorbing buys (bearish).
FLOW (with arrow):
"FLOW↑" or "FLOW↓" = A flow shift happened here. The delta direction reversed,
meaning buyers took over from sellers or vice versa. This is a momentum change signal.
FAIL (with arrow):
"FAIL↑" or "FAIL↓" = A flow shift was detected but FAILED to confirm.
The reversal started but price did not follow through. Shown in orange.
Often means the opposing side absorbed the move.
INVAL / INVALID:
"INVAL" or "INVALID" = A previously confirmed flow shift was invalidated.
Price reversed back through the shift level, canceling the signal.
Shown in orange. Treat the original shift direction as no longer valid.
BULL EXH / BEAR EXH:
"BULL EXH" or "BEAR EXH" = Exhaustion zone. Extreme delta (above 65%) combined
with FADING volume. The dominant side pushed too hard and is running out of fuel.
Shown in gold. Often precedes a reversal. Higher delta + lower volume = more exhausted.
IMBALANCE RATIO (number:1):
"4:1" = The ratio of buy volume to sell volume (or vice versa) at this bin.
A 4:1 ratio means one side has 4x the volume of the other.
Only shown when the imbalance exceeds the configured threshold.
ICE:
"ICE" = Iceberg order detected in this bin. High volume traded but price barely
moved, suggesting a large hidden order was absorbing all the activity.
CONFL / CONF+ / CONF-:
Confluence detected. Multiple signals (structure + order flow) agree on direction.
CONF+ = bullish confluence. CONF- = bearish confluence.
CONFLICT:
Structure says one thing, order flow says another. Be cautious.
STK (with multiplier):
"STK x3" = Imbalance stack. Three or more consecutive bins all lean the same
direction. Shows institutional pressure building across multiple price levels.
OB (with arrow):
"OB↑" or "OB↓" = This bin overlaps with an active Order Block (see section 6).
FVG (with arrow):
"FVG↑" or "FVG↓" = This bin overlaps with an active Fair Value Gap (see section 7).
"uFVG↑" or "uFVG↓" = Same but for a micro-level FVG (smaller gap detected
within the profile structure rather than on-chart candle gaps).
uSR:
Micro structure level. A price level that has been tested multiple times with
high volume -- acts as local support or resistance.
EQUILIBRIUM / BULL ATK / BEAR DEF / etc:
Context labels that describe the state of the bin:
- EQUILIBRIUM = balanced buyers and sellers
- BULL ATK = buyers attacking with increasing volume
- BULL DEF = buyers holding but volume fading
- BEAR ATK = sellers attacking with increasing volume
- BEAR DEF = sellers holding but volume fading
CONFIDENCE SCORE (number at end of label):
Example: "ABS▼ CONFL "
The number in brackets is a confidence score from 0-100.
Higher = more signals agreeing. Above 70 is strong.
DWELL TIME:
"8d" at the end means price spent 8 bars dwelling at this level.
More time at a level = stronger support/resistance.
=====================================
4. ARROWS ON PROFILE BINS
=====================================
Small arrows may appear to the right of profile bars:
DELTA ARROWS (^^):
Show if buying/selling pressure is accelerating or decelerating.
pointing up = bullish momentum gaining speed
pointing down = bearish momentum gaining speed
VOLUME ARROWS:
Show if volume is increasing or decreasing at each level.
Up arrow = volume building. Down arrow = volume fading.
VELOCITY BANDS:
Small colored boxes to the right of the profile.
Green = volume accelerating. Red = volume decelerating.
Only appears on high-volume bins.
=====================================
5. CVD LINE (curved line inside the profile)
=====================================
The colored line running through the profile area is the CVD
(Cumulative Volume Delta) line.
It tracks the running total of buy volume minus sell volume across the session.
- Line going UP = buyers accumulating over time
- Line going DOWN = sellers accumulating over time
HOW THE LINE COLOR WORKS:
The line color is NOT random. It checks the CVD value against 5 moving averages
(EMA 8, 13, 21, 34, and 55). Each EMA that CVD is ABOVE scores +1. Each EMA
that CVD is BELOW scores -1. The total score (-5 to +5) sets the color:
+5 (above ALL 5 EMAs) = deep forest green -- strong bullish momentum
+3 to +4 = bright green -- solid bullish
+1 to +2 = light green -- lean bullish
0 = gray -- neutral, no clear direction
-1 to -2 = light red -- lean bearish
-3 to -4 = bright red -- solid bearish
-5 (below ALL 5 EMAs) = deep dark red -- strong bearish momentum
In practice: when the line shifts from red to green, it means CVD has crossed
above its moving averages -- buying pressure is accelerating. When green turns
red, selling pressure is taking over. A gray section means CVD is choppy and
sitting between its averages with no conviction.
CVD LABEL (at the right end of the line):
"CVD +1.2K +5"
First number = raw CVD value (+1,200 net buy volume)
Second number = confirmation count (+5 means 5 consecutive bars where the
adaptive reset system confirmed the bullish direction)
The label color uses a separate gradient based on the confirmation count:
Deep green = many consecutive bullish confirmations
Deep red = many consecutive bearish confirmations
Yellow/gray = few or mixed confirmations
=====================================
6. ORDER BLOCKS (OBs) - colored boxes on candles
=====================================
Order Blocks are zones where institutions placed large orders.
They appear as colored boxes around groups of candles.
ACTIVE OBs (not yet tested):
- Green/teal box = bullish OB (expect support when price returns)
- Red box = bearish OB (expect resistance when price returns)
- Solid fill, extends rightward from the origin candles
BROKEN OBs (breakers):
- Same colors but with a transparent fill and border outline only
- A bullish OB becomes a breaker when price closes below its bottom
- A bearish OB becomes a breaker when price closes above its top
- Once broken, the OB flips role: old support becomes resistance and vice versa
- A dotted midline shows the 50% level of the broken OB
- If price then closes through the breaker in the new direction, it is removed entirely
Two detection methods run simultaneously:
- Fast: simple 3-bar pivot swings for reactive OBs near current price
- Deep: ICS-style fractal depth swings for structural OBs from further back
The "Detection Depth" setting controls the fractal depth (Short/Intermediate/Long Term).
=====================================
7. FAIR VALUE GAPS (FVGs) - striped zones on candles
=====================================
FVGs are gaps in the price action where one side (buyers or sellers) was so
dominant that price skipped over a range. Price tends to come back and fill these gaps.
They appear as small striped/hatched boxes at the gap location.
- Purple-ish stripes = the gap zone
- Each individual stripe is deleted when price crosses through its midpoint,
so the gap visually erodes from the inside out as price fills it
- After 21 bars, remaining unfilled stripes fade to show the gap is aging
- Once every stripe is filled, the FVG is fully removed from the chart
- Maximum 30 FVGs tracked at once (oldest removed first if exceeded)
=====================================
8. MULTI-TIMEFRAME BOXES (2m / 5m / 15m)
=====================================
Colored boxes extending behind and slightly ahead of the current candles.
These show FVGs and Order Blocks detected on HIGHER timeframes (2-minute,
5-minute, 15-minute charts) projected onto your 1-minute chart.
HOW TO TELL THEM APART:
Border style:
- Dashed border = FVG (Fair Value Gap)
- Solid border = OB (Order Block)
Thickness and length:
- Thin border, extends 20 bars back = 2-minute timeframe
- Thin border, extends 30 bars back = 5-minute timeframe
- Thick border, extends 50 bars back = 15-minute timeframe
Color:
- Cyan/teal = bullish (expect support)
- Orange = bearish (expect resistance)
When your 1-minute price touches a higher-timeframe structure, it carries
more weight because institutions watch those levels.
=====================================
9. PREDICTIVE CONFLUENCE ZONES (projected boxes)
=====================================
These are the "ZONE S x3" and "ZONE R x2" boxes that project AHEAD of current price
(to the right of the last candle).
They appear when multiple structures from different sources cluster at the
same price area:
- 1m Order Blocks + 1m FVGs + 2m structures + 5m structures + 15m structures
The system scans all unmitigated levels, finds where they overlap, and projects
a high-probability reaction zone.
"ZONE S x3" = Support zone, 3 structures converge here (green box)
"ZONE R x2" = Resistance zone, 2 structures converge here (red box)
Higher count = stronger zone. These are the highest-conviction levels on the chart.
=====================================
10. SIGNAL LABELS ON CANDLES
=====================================
These labels appear directly on or near candles when specific conditions are met:
SWEEP LABELS (cyan/magenta bubbles):
Example: "VA High 8"
A liquidity sweep happened -- price wicked past a key level and reversed.
The name shows which level was swept. The number is a quality score.
Higher score = more reliable sweep. Cyan = bullish sweep. Magenta = bearish.
ICE (cyan/red squares):
Small squares below (bull) or above (bear) candles.
"ICE 2.3x" = Iceberg order detected. Volume was 2.3x average but price
barely moved. A hidden large order was absorbing all activity.
COILED:
"COILED " = Price has been compressing (low volatility) for 4 bars
while sitting near a wall of support/resistance. Like a spring ready to release.
Green = bullish coil (expect breakout up). Red = bearish coil (expect breakdown).
!!SR (with arrow and count):
"!!SR 5x" = A wall of 5 micro-structure levels stacked at this price.
Strong support (arrow down, green) or resistance (arrow up, red).
CVD DIV:
"CVD DIV (up arrow)" = Bullish CVD divergence. Price is making lower lows but CVD
is improving -- hidden buying.
"CVD DIV (down arrow)" = Bearish CVD divergence. Price making higher highs but CVD
declining -- hidden selling.
VA BREAK:
"VA BREAK (up arrow)" or "VA BREAK (down arrow)" = Price just broke out of the Value Area.
A thick green or red line extends forward showing the breakout level.
This is a high-momentum signal.
VOLUME SPIKE:
"x3.2" = Volume on this candle is 3.2x the average. Shows in magenta above the candle.
REJECT:
"REJECT (arrow)" = Price momentum is pushing into a wall of support or resistance.
Warns of a potential rejection/reversal at that wall.
=====================================
11. SEQUENCE PATTERNS (triangles)
=====================================
These track a full institutional flow sequence through 4 stages:
1. ABSORPTION = institution absorbs orders at a level
2. FLOW SHIFT = delta reverses confirming direction
3. SWEEP = liquidity grab confirms intent
4. BREAKOUT = Value Area breakout completes the pattern
PROGRESS LABELS (small, during build-up):
"SEQ:SHIFT" or "SEQ:SWEEP" = Sequence is building, currently at that stage.
COMPLETED SEQUENCE (large triangle + label):
Hot pink triangle (up or down) with "SEQ BULL " or "SEQ BEAR ".
The number is the sequence score. This is the highest-confidence signal in DSMS.
A full 4-stage institutional sequence just completed.
=====================================
12. CANDLE TECH (colored candle borders)
=====================================
Certain candles get a colored border and a small label:
- Green border = bullish pattern detected (hammer, bullish engulfing, etc.)
- Red border = bearish pattern detected (shooting star, bearish engulfing, etc.)
The label shows:
"R 5" = Reversal pattern, score 5
"(up arrow) 3" = Continuation pattern, score 3
Higher score = more confirming factors (CVD alignment, volume surge, trend direction).
Thicker border = stronger pattern.
=====================================
13. LIQUIDITY VOID LINES
=====================================
Yellow dashed horizontal lines extending left from the profile.
These mark price levels with very low volume -- gaps where price moved
through quickly without much trading. When price returns to these levels,
it tends to move through them fast again or react sharply.
=====================================
14. STATE OF THE ARENA TABLE (corner dashboard)
=====================================
The table in the corner of the chart is the real-time scoring dashboard.
It combines all signals into one weighted score from -100 (max bearish) to +100 (max bullish).
HEADER ROW:
Shows the overall market state and final score.
States: BREAKOUT, TRENDING, COMPRESSED, CONTESTED, or NEUTRAL.
COMPONENT ROWS (each scored -100 to +100, weighted into final score):
Delta Flow (10%) -- raw buying vs selling pressure on current bar
CVD Flow (10%) -- cumulative volume delta trend and EMA band position
Flow Shift (9%) -- recent delta direction reversals
Absorption (9%) -- institutional stop hunt detection
Sequence (8%) -- institutional flow sequence progress
Confluence (7%) -- structural + psychological signal agreement
OB/FVG (7%) -- nearest order block or gap bias
Sweep (7%) -- recent liquidity grab signals
MTF (6%) -- multi-timeframe alignment (2m/5m/15m)
Volume (6%) -- spike detection
Walls (6%) -- support/resistance cluster strength
Accel (5%) -- delta acceleration (2nd derivative of momentum)
Iceberg (4%) -- hidden institutional order detection
Candle (3%) -- pattern recognition score
POC Shift (3%) -- value area migration direction
The final score is the weighted sum, clamped to -100 to +100.
70+ or below -70 = STRONG conviction
40-69 = MEDIUM conviction
15-39 = WEAK conviction
Below 15 = no clear direction
Each row shows a text status, numeric score, and a visual bar made of blocks.
Green blocks = bullish. Red blocks = bearish. More blocks = stronger signal.
SIGNAL SECTION (bottom of table):
Shows the single highest-priority actionable signal right now.
"Key" = what the signal is based on
"Action" = suggested stance (BUY / SELL / HOLD / CAUTION)
"Watch" = what to watch for next
=====================================
QUICK REFERENCE - COLOR GUIDE
=====================================
Cyan/Teal ......... Bullish structures, support, buy signals
Red/Orange ........ Bearish structures, resistance, sell signals
Green ............. Bullish momentum, buyers winning
Red ............... Bearish momentum, sellers winning
Yellow ............ Liquidity voids, caution zones
Purple ............ FVG gap zones
Hot Pink .......... Completed sequence patterns
Magenta ........... Volume spikes, sweep highlights
Gold .............. Predictive zone projections
White text ........ All on-chart signal labels
=====================================
ALERTS
=====================================
DSMS has 6 built-in alerts you can set from TradingView's alert menu:
Flow Shift -- delta direction reversed at a price level
Volume Spike -- volume exceeds threshold with bin concentration
VA Breakout -- price broke out of the Value Area
Strong Confluence -- multiple signals align above the confluence threshold
Absorption -- institutional absorption pattern detected
Sequence Complete -- full 4-stage institutional sequence finished
To set an alert: click the alarm clock icon in TradingView, select DSMS as
the condition source, pick the alert type, and choose your notification method.
Each alert can be toggled on/off in the settings panel.
=====================================
SETTINGS OVERVIEW
=====================================
Everything is toggleable. The main groups in settings are:
Core Settings -- lookback period, number of bins, profile width
Display Options -- toggle heatmap, delta flow, volume breakdown, POC
1M Scalping -- CVD line, zoomed-out mode, volume trend arrows
Signal Settings -- enable/disable each signal type
Advanced Tuning -- compression bars, confidence thresholds
OB/FVG Settings -- order block depth, FVG stripe count, max blocks
Candle Tech -- pattern detection and scoring
Liquidity Sweeps -- wick ratio, volume requirement, score display
Tier 3: Flow Intel -- sequence patterns, multi-timeframe (2m/5m/15m), predictive zones
Colors -- customize every major visual element
State of the Arena -- table position, size, and which components to show
Pine Script® indicator
EMA HH/LL Levels v6This indicator builds dynamic horizontal levels based on Higher Highs (HH) and Lower Lows (LL) of an Exponential Moving Average (EMA) rather than raw price.
It is designed to highlight structural EMA-based resistance and support levels and automatically manage their lifecycle.
🔹 Core Logic
The script calculates an EMA (default length: 26).
Pivot Highs and Pivot Lows are detected directly on the EMA line, not on price.
Each confirmed:
EMA Higher High (HH) → creates a solid blue horizontal level
EMA Lower Low (LL) → creates a solid red horizontal level
Levels extend to the right and remain active until specific conditions are met.
🔹 Level State Management
Each level can be in one of three states:
Active (Solid line)
The level has been created but not interacted with yet.
Touched by Price (Dotted line)
When a price bar touches the level (High ≥ level AND Low ≤ level),
the level changes its style from solid to dotted, but remains on the chart.
Broken by EMA (Removed)
When the EMA itself crosses the level:
HH level → removed when EMA crosses above it
LL level → removed when EMA crosses below it
The level is then deleted from the chart.
⚠️ Important:
Levels are never removed by price action alone — only by an EMA break.
🔹 EMA Visualization
The EMA line is color-coded by direction:
Upward slope → user-defined “up” color
Downward slope → user-defined “down” color
EMA length, colors, and line width are fully configurable.
🔹 Customization Options
EMA length
EMA up/down colors and thickness
Pivot sensitivity (left/right bars)
HH / LL level colors and thickness
Maximum number of stored levels (to control memory and chart clutter)
🔹 Use Cases
Identifying EMA-based dynamic support and resistance
Tracking trend structure via EMA swings
Confluence with price action, pullbacks, and breakouts
Trend-following and mean-reversion strategies
🔹 Notes
This indicator works on all markets and timeframes.
No repainting after pivot confirmation.
No ta.crossover() / ta.crossunder() is used — all logic is calculated manually for maximum stability in Pine Script v6.
Pine Script® indicator
Trend Candles - [EntryLab]
Trend Candles:
This indicator overrides or overlays standard chart candles with a color gradient that reflects a calculated trend bias (uptrend or downtrend), helping traders quickly assess the overall market direction.Features:Candles are colored using a gradient scale: stronger shades indicate higher-confidence trend direction based on the algorithm.
Two usage modes:
Full override: Disable and hide the chart's native ticker/symbol candles (via chart settings) so the indicator's colored candles take over completely.
Hover preview: Keep your preferred candle setup/colors intact; simply hover the mouse over the indicator name in the chart legend to temporarily display the trend-colored gradient candles for quick reference without altering your main view.
Customizable inputs (adjust in settings): gradient colors for up/down trends, intensity thresholds, etc.
How it works (high-level):
The trend bias is determined using a combination of multiple VWAP calculations, trend-following data, and momentum-based indicators. This multi-factor approach aims to provide a smoother, more reliable signal of whether the market is in an uptrend (bullish bias) or downtrend (bearish bias) compared to single-indicator methods.
How to use:
Apply the indicator to your chart and use the colored candles as a visual aid for trend bias decision-making. For example:In a strong uptrend (deeper bullish gradient), consider favoring long setups or avoiding shorts.
In a downtrend (deeper bearish gradient), consider short opportunities or caution on longs.
Combine with other tools (support/resistance, volume, etc.) for confluence rather than relying solely on candle color.
This script offers a unique way to visualize trend strength via candle recoloring with gradient feedback, which can provide a broader overview of directional bias without cluttering the chart with additional plots/lines.Best suited for any timeframe, especially higher ones for swing/position trading or lower ones for intraday confirmation. No repainting occurs once a bar closes. Not financial advice. Trading carries significant risk of loss of capital. Always backtest and use discretion; results are not guaranteed.
Pine Script® indicator
Trend Signal GridTrend Signal Grid
Based on Trend Direction & Force Index - TDFI by Causecelebre, the TDFI Grid is a multi-timeframe momentum indicator that builds on the original TDFI concept. It calculates TDFI across three user-selectable timeframes using three different lookback periods, creating a 3×3 consensus grid (9 readings total).
Each cell is classified as bullish, bearish, or neutral based on configurable upper and lower thresholds. When a majority of the 9 readings align in the same direction (default 65%), the indicator triggers a directional signal — either GRID UP or GRID DOWN. Alerts fire automatically on new signals so you never miss a shift.
How it works
The indicator uses a smoothed EMA-based momentum calculation, normalises the output against its recent highest absolute value, and then maps it across your chosen timeframes and lookback lengths. The results are displayed in a clean on-chart table showing the state of each timeframe/lookback combination at a glance.
Settings:
Timeframe 1, 2, 3 — Choose any three timeframes (defaults to 1m, 5m, 15m).
LB1, LB2, LB3 — Lookback periods for each TDFI calculation.
UP / DOWN thresholds — Controls how far the TDFI must move before a cell registers as bullish or bearish.
Majority — The percentage of the 9 cells that must agree to trigger a signal.
Table position — Place the grid anywhere on your chart.
Best used for
Trading setups where you need to confirm momentum alignment across multiple timeframes before entering or scaling a position. Works well on forex and metals.
Pine Script® indicator
PineStats█ OVERVIEW
PineStats is a comprehensive statistical analysis library for Pine Script v6, providing 104 functions across 6 modules. Built for quantitative traders, researchers, and indicator developers who need professional-grade statistics without reinventing the wheel.
For building mean-reversion strategies, analyzing return distributions, measuring correlations, or testing for market regimes.
█ MODULES
CORE STATISTICS (20 functions)
• Central tendency: mean, median, WMA, EMA
• Dispersion: variance, stdev, MAD, range
• Standardization: z-score, robust z-score, normalize, percentile
• Distribution shape: skewness, kurtosis
PROBABILITY DISTRIBUTIONS (17 functions)
• Normal: PDF, CDF, inverse CDF (quantile function)
• Power-law: Hill estimator, MLE alpha, survival function
• Exponential: PDF, CDF, rate estimation
• Normality testing: Jarque-Bera test
ENTROPY (9 functions)
• Shannon entropy (information theory)
• Tsallis entropy (non-extensive, fat-tail sensitive)
• Permutation entropy (ordinal patterns)
• Approximate entropy (regularity measure)
• Entropy-based regime detection
PROBABILITY (21 functions)
• Win rates and expected value
• First passage time estimation
• TP/SL probability analysis
• Conditional probability and Bayes updates
• Streak and drawdown probabilities
REGRESSION (19 functions)
• Linear regression: slope, intercept, forecast
• Goodness of fit: R², adjusted R², standard error
• Statistical tests: t-statistic, p-value, significance
• Trend analysis: strength, angle, acceleration
• Quadratic regression
CORRELATION (18 functions)
• Pearson, Spearman, Kendall correlation
• Covariance, beta, alpha (Jensen's)
• Rolling correlation analysis
• Autocorrelation and cross-correlation
• Information ratio, tracking error
█ QUICK START
import HenriqueCentieiro/PineStats/1 as stats
// Z-score for mean reversion
z = stats.zscore(close, 20)
// Test if returns are normally distributed
returns = (close - close ) / close
isGaussian = stats.is_normal(returns, 100, 0.05)
// Regression channel
= stats.linreg_channel(close, 50, 2.0)
// Correlation with benchmark
spyReturns = request.security("SPY", timeframe.period, close/close - 1)
beta = stats.beta(returns, spyReturns, 60)
█ USE CASES
✓ Mean Reversion — z-scores, percentiles, Bollinger-style analysis
✓ Regime Detection — entropy measures, correlation regimes
✓ Risk Analysis — drawdown probability, VaR via quantiles
✓ Strategy Evaluation — expected value, win rates, R:R analysis
✓ Distribution Analysis — normality tests, fat-tail detection
✓ Multi-Asset — beta, alpha, correlation, relative strength
█ NOTES
• All functions return `na` on invalid inputs
• Designed for Pine Script v6
• Fully documented in the library header
• Part of the Pine ecosystem: PineStats, PineQuant, PineCriticality, PineWavelet
█ REFERENCES
• Abramowitz & Stegun — Normal CDF approximation
• Acklam's algorithm — Inverse normal CDF
• Hill estimator — Power-law tail estimation
• Tsallis statistics — Non-extensive entropy
Full documentation in the library header.
mean(src, length)
Calculates the arithmetic mean (simple moving average) over a lookback period
Parameters:
src (float) : Source series
length (simple int) : Lookback period (must be >= 1)
Returns: Arithmetic mean of the last `length` values, or `na` if inputs invalid
wma_custom(src, length)
Calculates weighted moving average with linearly decreasing weights
Parameters:
src (float) : Source series
length (simple int) : Lookback period (must be >= 1)
Returns: Weighted moving average, or `na` if inputs invalid
ema_custom(src, length)
Calculates exponential moving average
Parameters:
src (float) : Source series
length (simple int) : Lookback period (must be >= 1)
Returns: Exponential moving average, or `na` if inputs invalid
median(src, length)
Calculates the median value over a lookback period
Parameters:
src (float) : Source series
length (simple int) : Lookback period (must be >= 1)
Returns: Median value, or `na` if inputs invalid
variance(src, length)
Calculates population variance over a lookback period
Parameters:
src (float) : Source series
length (simple int) : Lookback period (must be >= 1)
Returns: Population variance, or `na` if inputs invalid
stdev(src, length)
Calculates population standard deviation over a lookback period
Parameters:
src (float) : Source series
length (simple int) : Lookback period (must be >= 1)
Returns: Population standard deviation, or `na` if inputs invalid
mad(src, length)
Calculates Median Absolute Deviation (MAD) - robust dispersion measure
Parameters:
src (float) : Source series
length (simple int) : Lookback period (must be >= 1)
Returns: MAD value, or `na` if inputs invalid
data_range(src, length)
Calculates the range (highest - lowest) over a lookback period
Parameters:
src (float) : Source series
length (simple int) : Lookback period (must be >= 1)
Returns: Range value, or `na` if inputs invalid
zscore(src, length)
Calculates z-score (number of standard deviations from mean)
Parameters:
src (float) : Source series
length (simple int) : Lookback period for mean and stdev calculation (must be >= 2)
Returns: Z-score, or `na` if inputs invalid or stdev is zero
zscore_robust(src, length)
Calculates robust z-score using median and MAD (resistant to outliers)
Parameters:
src (float) : Source series
length (simple int) : Lookback period (must be >= 2)
Returns: Robust z-score, or `na` if inputs invalid or MAD is zero
normalize(src, length)
Normalizes value to range using min-max scaling
Parameters:
src (float) : Source series
length (simple int) : Lookback period (must be >= 1)
Returns: Normalized value in , or `na` if inputs invalid or range is zero
percentile(src, length)
Calculates percentile rank of current value within lookback window
Parameters:
src (float) : Source series
length (simple int) : Lookback period (must be >= 1)
Returns: Percentile rank (0 to 100), or `na` if inputs invalid
winsorize(src, length, lower_pct, upper_pct)
Winsorizes values by clamping to percentile bounds (reduces outlier impact)
Parameters:
src (float) : Source series
length (simple int) : Lookback period (must be >= 1)
lower_pct (simple float) : Lower percentile bound (0-100, e.g., 5 for 5th percentile)
upper_pct (simple float) : Upper percentile bound (0-100, e.g., 95 for 95th percentile)
Returns: Winsorized value clamped to bounds
skewness(src, length)
Calculates sample skewness (measure of distribution asymmetry)
Parameters:
src (float) : Source series
length (simple int) : Lookback period (must be >= 3)
Returns: Skewness value (negative = left tail, positive = right tail), or `na` if invalid
kurtosis(src, length)
Calculates excess kurtosis (measure of distribution tail heaviness)
Parameters:
src (float) : Source series
length (simple int) : Lookback period (must be >= 4)
Returns: Excess kurtosis (>0 = heavy tails, <0 = light tails), or `na` if invalid
count_valid(src, length)
Counts non-na values in lookback window (useful for data quality checks)
Parameters:
src (float) : Source series
length (simple int) : Lookback period (must be >= 1)
Returns: Count of valid (non-na) values
sum(src, length)
Calculates sum over lookback period
Parameters:
src (float) : Source series
length (simple int) : Lookback period (must be >= 1)
Returns: Sum of values, or `na` if inputs invalid
cumsum(src)
Calculates cumulative sum (running total from first bar)
Parameters:
src (float) : Source series
Returns: Cumulative sum
change(src, length)
Returns the change (difference) from n bars ago
Parameters:
src (float) : Source series
length (simple int) : Number of bars to look back (must be >= 1)
Returns: Current value minus value from `length` bars ago
roc(src, length)
Calculates Rate of Change (percentage change from n bars ago)
Parameters:
src (float) : Source series
length (simple int) : Number of bars to look back (must be >= 1)
Returns: Percentage change as decimal (0.05 = 5%), or `na` if invalid
normal_pdf_standard(x)
Calculates the standard normal probability density function (PDF)
Parameters:
x (float) : The value to evaluate
Returns: PDF value at x for standard normal N(0,1)
normal_pdf(x, mu, sigma)
Calculates the normal probability density function (PDF)
Parameters:
x (float) : The value to evaluate
mu (float) : Mean of the distribution (default: 0)
sigma (float) : Standard deviation (default: 1, must be > 0)
Returns: PDF value at x for normal N(mu, sigma²)
normal_cdf_standard(x)
Calculates the standard normal cumulative distribution function (CDF)
Parameters:
x (float) : The value to evaluate
Returns: Probability P(X <= x) for standard normal N(0,1)
@description Uses Abramowitz & Stegun approximation (formula 7.1.26), accurate to ~1.5e-7
normal_cdf(x, mu, sigma)
Calculates the normal cumulative distribution function (CDF)
Parameters:
x (float) : The value to evaluate
mu (float) : Mean of the distribution (default: 0)
sigma (float) : Standard deviation (default: 1, must be > 0)
Returns: Probability P(X <= x) for normal N(mu, sigma²)
normal_inv_standard(p)
Calculates the inverse standard normal CDF (quantile function)
Parameters:
p (float) : Probability value (must be in (0, 1))
Returns: x such that P(X <= x) = p for standard normal N(0,1)
@description Uses Acklam's algorithm, accurate to ~1.15e-9
normal_inv(p, mu, sigma)
Calculates the inverse normal CDF (quantile function)
Parameters:
p (float) : Probability value (must be in (0, 1))
mu (float) : Mean of the distribution
sigma (float) : Standard deviation (must be > 0)
Returns: x such that P(X <= x) = p for normal N(mu, sigma²)
power_law_alpha(src, length, tail_pct)
Estimates power-law exponent (alpha) using Hill estimator
Parameters:
src (float) : Source series (typically absolute returns or drawdowns)
length (simple int) : Lookback period (must be >= 10 for reliable estimates)
tail_pct (simple float) : Percentage of data to use for tail estimation (default: 0.1 = top 10%)
Returns: Estimated alpha (tail index), typically 2-4 for financial data
@description Alpha < 2 indicates infinite variance (very heavy tails)
@description Alpha < 3 indicates infinite kurtosis
@description Alpha > 4 suggests near-Gaussian behavior
power_law_alpha_mle(src, length, x_min)
Estimates power-law alpha using maximum likelihood (Clauset method)
Parameters:
src (float) : Source series (positive values expected)
length (simple int) : Lookback period (must be >= 20)
x_min (float) : Minimum threshold for power-law behavior
Returns: Estimated alpha using MLE
power_law_pdf(x, alpha, x_min)
Calculates power-law probability density (Pareto Type I)
Parameters:
x (float) : Value to evaluate (must be >= x_min)
alpha (float) : Power-law exponent (must be > 1)
x_min (float) : Minimum value / scale parameter (must be > 0)
Returns: PDF value
power_law_survival(x, alpha, x_min)
Calculates power-law survival function P(X > x)
Parameters:
x (float) : Value to evaluate (must be >= x_min)
alpha (float) : Power-law exponent (must be > 1)
x_min (float) : Minimum value / scale parameter (must be > 0)
Returns: Probability of exceeding x
power_law_ks(src, length, alpha, x_min)
Tests if data follows power-law using simplified Kolmogorov-Smirnov
Parameters:
src (float) : Source series
length (simple int) : Lookback period
alpha (float) : Estimated alpha from power_law_alpha()
x_min (float) : Threshold value
Returns: KS statistic (lower = better fit, typically < 0.1 for good fit)
is_power_law(src, length, tail_pct, ks_threshold)
Simple test if distribution appears to follow power-law
Parameters:
src (float) : Source series
length (simple int) : Lookback period
tail_pct (simple float) : Tail percentage for alpha estimation
ks_threshold (simple float) : Maximum KS statistic for acceptance (default: 0.1)
Returns: true if KS test suggests power-law fit
exp_pdf(x, lambda)
Calculates exponential probability density function
Parameters:
x (float) : Value to evaluate (must be >= 0)
lambda (float) : Rate parameter (must be > 0)
Returns: PDF value
exp_cdf(x, lambda)
Calculates exponential cumulative distribution function
Parameters:
x (float) : Value to evaluate (must be >= 0)
lambda (float) : Rate parameter (must be > 0)
Returns: Probability P(X <= x)
exp_lambda(src, length)
Estimates exponential rate parameter (lambda) using MLE
Parameters:
src (float) : Source series (positive values)
length (simple int) : Lookback period
Returns: Estimated lambda (1/mean)
jarque_bera(src, length)
Calculates Jarque-Bera test statistic for normality
Parameters:
src (float) : Source series
length (simple int) : Lookback period (must be >= 10)
Returns: JB statistic (higher = more deviation from normality)
@description Under normality, JB ~ chi-squared(2). JB > 6 suggests non-normality at 5% level
is_normal(src, length, significance)
Tests if distribution is approximately normal
Parameters:
src (float) : Source series
length (simple int) : Lookback period
significance (simple float) : Significance level (default: 0.05)
Returns: true if Jarque-Bera test does not reject normality
shannon_entropy(src, length, n_bins)
Calculates Shannon entropy from a probability distribution
Parameters:
src (float) : Source series
length (simple int) : Lookback period (must be >= 10)
n_bins (simple int) : Number of histogram bins for discretization (default: 10)
Returns: Shannon entropy in bits (log base 2)
@description Higher entropy = more randomness/uncertainty, lower = more predictability
shannon_entropy_norm(src, length, n_bins)
Calculates normalized Shannon entropy
Parameters:
src (float) : Source series
length (simple int) : Lookback period
n_bins (simple int) : Number of histogram bins
Returns: Normalized entropy where 0 = perfectly predictable, 1 = maximum randomness
tsallis_entropy(src, length, q, n_bins)
Calculates Tsallis entropy with q-parameter
Parameters:
src (float) : Source series
length (simple int) : Lookback period (must be >= 10)
q (float) : Entropic index (q=1 recovers Shannon entropy)
n_bins (simple int) : Number of histogram bins
Returns: Tsallis entropy value
@description q < 1: emphasizes rare events (fat tails)
@description q = 1: equivalent to Shannon entropy
@description q > 1: emphasizes common events
optimal_q(src, length)
Estimates optimal q parameter from kurtosis
Parameters:
src (float) : Source series
length (simple int) : Lookback period
Returns: Estimated q value that best captures the distribution's tail behavior
@description Uses relationship: q ≈ (5 + kurtosis) / (3 + kurtosis) for kurtosis > 0
tsallis_q_gaussian(x, q, beta)
Calculates Tsallis q-Gaussian probability density
Parameters:
x (float) : Value to evaluate
q (float) : Tsallis q parameter (must be < 3)
beta (float) : Width parameter (inverse temperature, must be > 0)
Returns: q-Gaussian PDF value
@description q=1 recovers standard Gaussian
permutation_entropy(src, length, order)
Calculates permutation entropy (ordinal pattern complexity)
Parameters:
src (float) : Source series
length (simple int) : Lookback period (must be >= 20)
order (simple int) : Embedding dimension / pattern length (2-5, default: 3)
Returns: Normalized permutation entropy
@description Measures complexity of temporal ordering patterns
@description 0 = perfectly predictable sequence, 1 = random
approx_entropy(src, length, m, r)
Calculates Approximate Entropy (ApEn) - regularity measure
Parameters:
src (float) : Source series
length (simple int) : Lookback period (must be >= 50)
m (simple int) : Embedding dimension (default: 2)
r (simple float) : Tolerance as fraction of stdev (default: 0.2)
Returns: Approximate entropy value (higher = more irregular/complex)
@description Lower ApEn indicates more self-similarity and predictability
entropy_regime(src, length, q, n_bins)
Detects market regime based on entropy level
Parameters:
src (float) : Source series (typically returns)
length (simple int) : Lookback period
q (float) : Tsallis q parameter (use optimal_q() or default 1.5)
n_bins (simple int) : Number of histogram bins
Returns: Regime indicator: -1 = trending (low entropy), 0 = transition, 1 = ranging (high entropy)
entropy_risk(src, length)
Calculates entropy-based risk indicator
Parameters:
src (float) : Source series (typically returns)
length (simple int) : Lookback period
Returns: Risk score where 1 = maximum divergence from Gaussian 1
hit_rate(src, length)
Calculates hit rate (probability of positive outcome) over lookback
Parameters:
src (float) : Source series (positive values count as hits)
length (simple int) : Lookback period
Returns: Hit rate as decimal
hit_rate_cond(condition, length)
Calculates hit rate for custom condition over lookback
Parameters:
condition (bool) : Boolean series (true = hit)
length (simple int) : Lookback period
Returns: Hit rate as decimal
expected_value(src, length)
Calculates expected value of a series
Parameters:
src (float) : Source series
length (simple int) : Lookback period
Returns: Expected value (mean)
expected_value_trade(win_prob, take_profit, stop_loss)
Calculates expected value for a trade with TP and SL levels
Parameters:
win_prob (float) : Probability of hitting TP (0-1)
take_profit (float) : Take profit in price units or %
stop_loss (float) : Stop loss in price units or % (positive value)
Returns: Expected value per trade
@description EV = (win_prob * TP) - ((1 - win_prob) * SL)
breakeven_winrate(take_profit, stop_loss)
Calculates breakeven win rate for given TP/SL ratio
Parameters:
take_profit (float) : Take profit distance
stop_loss (float) : Stop loss distance
Returns: Required win rate for breakeven (EV = 0)
reward_risk_ratio(take_profit, stop_loss)
Calculates the reward-to-risk ratio
Parameters:
take_profit (float) : Take profit distance
stop_loss (float) : Stop loss distance
Returns: R:R ratio
fpt_probability(src, length, target, max_bars)
Estimates probability of price reaching target within N bars
Parameters:
src (float) : Source series (typically returns)
length (simple int) : Lookback for volatility estimation
target (float) : Target move (in same units as src, e.g., % return)
max_bars (simple int) : Maximum bars to consider
Returns: Probability of reaching target within max_bars
@description Based on random walk with drift approximation
fpt_mean(src, length, target)
Estimates mean first passage time to target level
Parameters:
src (float) : Source series (typically returns)
length (simple int) : Lookback for volatility estimation
target (float) : Target move
Returns: Expected number of bars to reach target (can be infinite)
fpt_historical(src, length, target)
Counts historical bars to reach target from each point
Parameters:
src (float) : Source series (typically price or returns)
length (simple int) : Lookback period
target (float) : Target move from each starting point
Returns: Array of first passage times (na if target not reached within lookback)
tp_probability(src, length, tp_distance, sl_distance)
Estimates probability of hitting TP before SL
Parameters:
src (float) : Source series (typically returns)
length (simple int) : Lookback for estimation
tp_distance (float) : Take profit distance (positive)
sl_distance (float) : Stop loss distance (positive)
Returns: Probability of TP being hit first
trade_probability(src, length, tp_pct, sl_pct)
Calculates complete trade probability and EV analysis
Parameters:
src (float) : Source series (typically returns)
length (simple int) : Lookback period
tp_pct (float) : Take profit percentage
sl_pct (float) : Stop loss percentage
Returns: Tuple:
cond_prob(condition_a, condition_b, length)
Calculates conditional probability P(B|A) from historical data
Parameters:
condition_a (bool) : Condition A (the given condition)
condition_b (bool) : Condition B (the outcome)
length (simple int) : Lookback period
Returns: P(B|A) = P(A and B) / P(A)
bayes_update(prior, likelihood, false_positive)
Updates probability using Bayes' theorem
Parameters:
prior (float) : Prior probability P(H)
likelihood (float) : P(E|H) - probability of evidence given hypothesis
false_positive (float) : P(E|~H) - probability of evidence given hypothesis is false
Returns: Posterior probability P(H|E)
streak_prob(win_rate, streak_length)
Calculates probability of N consecutive wins given win rate
Parameters:
win_rate (float) : Single-trade win probability
streak_length (simple int) : Number of consecutive wins
Returns: Probability of streak
losing_streak_prob(win_rate, streak_length)
Calculates probability of experiencing N consecutive losses
Parameters:
win_rate (float) : Single-trade win probability
streak_length (simple int) : Number of consecutive losses
Returns: Probability of losing streak
drawdown_prob(src, length, dd_threshold)
Estimates probability of drawdown exceeding threshold
Parameters:
src (float) : Source series (returns)
length (simple int) : Lookback period
dd_threshold (float) : Drawdown threshold (as positive decimal, e.g., 0.10 = 10%)
Returns: Historical probability of exceeding drawdown threshold
prob_to_odds(prob)
Calculates odds from probability
Parameters:
prob (float) : Probability (0-1)
Returns: Odds (prob / (1 - prob))
odds_to_prob(odds)
Calculates probability from odds
Parameters:
odds (float) : Odds ratio
Returns: Probability (0-1)
implied_prob(decimal_odds)
Calculates implied probability from decimal odds (betting)
Parameters:
decimal_odds (float) : Decimal odds (e.g., 2.5 means $2.50 return per $1 bet)
Returns: Implied probability
logit(prob)
Calculates log-odds (logit) from probability
Parameters:
prob (float) : Probability (must be in (0, 1))
Returns: Log-odds
inv_logit(log_odds)
Calculates probability from log-odds (inverse logit / sigmoid)
Parameters:
log_odds (float) : Log-odds value
Returns: Probability (0-1)
linreg_slope(src, length)
Calculates linear regression slope
Parameters:
src (float) : Source series
length (simple int) : Lookback period (must be >= 2)
Returns: Slope coefficient (change per bar)
linreg_intercept(src, length)
Calculates linear regression intercept
Parameters:
src (float) : Source series
length (simple int) : Lookback period (must be >= 2)
Returns: Intercept (predicted value at oldest bar in window)
linreg_value(src, length)
Calculates predicted value at current bar using linear regression
Parameters:
src (float) : Source series
length (simple int) : Lookback period
Returns: Predicted value at current bar (end of regression line)
linreg_forecast(src, length, offset)
Forecasts value N bars ahead using linear regression
Parameters:
src (float) : Source series
length (simple int) : Lookback period for regression
offset (simple int) : Bars ahead to forecast (positive = future)
Returns: Forecasted value
linreg_channel(src, length, mult)
Calculates linear regression channel with bands
Parameters:
src (float) : Source series
length (simple int) : Lookback period
mult (simple float) : Standard deviation multiplier for bands
Returns: Tuple:
r_squared(src, length)
Calculates R-squared (coefficient of determination)
Parameters:
src (float) : Source series
length (simple int) : Lookback period
Returns: R² value where 1 = perfect linear fit
adj_r_squared(src, length)
Calculates adjusted R-squared (accounts for sample size)
Parameters:
src (float) : Source series
length (simple int) : Lookback period
Returns: Adjusted R² value
std_error(src, length)
Calculates standard error of estimate (residual standard deviation)
Parameters:
src (float) : Source series
length (simple int) : Lookback period
Returns: Standard error
residual(src, length)
Calculates residual at current bar
Parameters:
src (float) : Source series
length (simple int) : Lookback period
Returns: Residual (actual - predicted)
residuals(src, length)
Returns array of all residuals in lookback window
Parameters:
src (float) : Source series
length (simple int) : Lookback period
Returns: Array of residuals
t_statistic(src, length)
Calculates t-statistic for slope coefficient
Parameters:
src (float) : Source series
length (simple int) : Lookback period
Returns: T-statistic (slope / standard error of slope)
slope_pvalue(src, length)
Approximates p-value for slope t-test (two-tailed)
Parameters:
src (float) : Source series
length (simple int) : Lookback period
Returns: Approximate p-value
is_significant(src, length, alpha)
Tests if regression slope is statistically significant
Parameters:
src (float) : Source series
length (simple int) : Lookback period
alpha (simple float) : Significance level (default: 0.05)
Returns: true if slope is significant at alpha level
trend_strength(src, length)
Calculates normalized trend strength based on R² and slope
Parameters:
src (float) : Source series
length (simple int) : Lookback period
Returns: Trend strength where sign indicates direction
trend_angle(src, length)
Calculates trend angle in degrees
Parameters:
src (float) : Source series
length (simple int) : Lookback period
Returns: Angle in degrees (positive = uptrend, negative = downtrend)
linreg_acceleration(src, length)
Calculates trend acceleration (second derivative)
Parameters:
src (float) : Source series
length (simple int) : Lookback period for each regression
Returns: Acceleration (change in slope)
linreg_deviation(src, length)
Calculates deviation from regression line in standard error units
Parameters:
src (float) : Source series
length (simple int) : Lookback period
Returns: Deviation in standard error units (like z-score)
quadreg_coefficients(src, length)
Fits quadratic regression and returns coefficients
Parameters:
src (float) : Source series
length (simple int) : Lookback period (must be >= 4)
Returns: Tuple: for y = a*x² + b*x + c
quadreg_value(src, length)
Calculates quadratic regression value at current bar
Parameters:
src (float) : Source series
length (simple int) : Lookback period
Returns: Predicted value from quadratic fit
correlation(x, y, length)
Calculates Pearson correlation coefficient between two series
Parameters:
x (float) : First series
y (float) : Second series
length (simple int) : Lookback period (must be >= 3)
Returns: Correlation coefficient
covariance(x, y, length)
Calculates sample covariance between two series
Parameters:
x (float) : First series
y (float) : Second series
length (simple int) : Lookback period (must be >= 2)
Returns: Covariance value
beta(asset, benchmark, length)
Calculates beta coefficient (slope of regression of y on x)
Parameters:
asset (float) : Asset returns series
benchmark (float) : Benchmark returns series
length (simple int) : Lookback period
Returns: Beta coefficient
@description Beta = Cov(asset, benchmark) / Var(benchmark)
alpha(asset, benchmark, length, risk_free)
Calculates alpha (Jensen's alpha / intercept)
Parameters:
asset (float) : Asset returns series
benchmark (float) : Benchmark returns series
length (simple int) : Lookback period
risk_free (float) : Risk-free rate (default: 0)
Returns: Alpha value (excess return not explained by beta)
spearman(x, y, length)
Calculates Spearman rank correlation coefficient
Parameters:
x (float) : First series
y (float) : Second series
length (simple int) : Lookback period (must be >= 3)
Returns: Spearman correlation
@description More robust to outliers than Pearson correlation
kendall_tau(x, y, length)
Calculates Kendall's tau rank correlation (simplified)
Parameters:
x (float) : First series
y (float) : Second series
length (simple int) : Lookback period (must be >= 3)
Returns: Kendall's tau
correlation_change(x, y, length, change_period)
Calculates change in correlation over time
Parameters:
x (float) : First series
y (float) : Second series
length (simple int) : Lookback period for correlation
change_period (simple int) : Period over which to measure change
Returns: Change in correlation
correlation_regime(x, y, length, ma_length)
Detects correlation regime based on level and stability
Parameters:
x (float) : First series
y (float) : Second series
length (simple int) : Lookback period for correlation
ma_length (simple int) : Moving average length for smoothing
Returns: Regime: -1 = negative, 0 = uncorrelated, 1 = positive
correlation_stability(x, y, length, stability_length)
Calculates correlation stability (inverse of volatility)
Parameters:
x (float) : First series
y (float) : Second series
length (simple int) : Lookback for correlation
stability_length (simple int) : Lookback for stability calculation
Returns: Stability score where 1 = perfectly stable
relative_strength(asset, benchmark, length)
Calculates relative strength of asset vs benchmark
Parameters:
asset (float) : Asset price series
benchmark (float) : Benchmark price series
length (simple int) : Smoothing period
Returns: Relative strength ratio (normalized)
tracking_error(asset, benchmark, length)
Calculates tracking error (standard deviation of excess returns)
Parameters:
asset (float) : Asset returns
benchmark (float) : Benchmark returns
length (simple int) : Lookback period
Returns: Tracking error (annualize by multiplying by sqrt(252) for daily data)
information_ratio(asset, benchmark, length)
Calculates information ratio (risk-adjusted excess return)
Parameters:
asset (float) : Asset returns
benchmark (float) : Benchmark returns
length (simple int) : Lookback period
Returns: Information ratio
capture_ratio(asset, benchmark, length, up_capture)
Calculates up/down capture ratio
Parameters:
asset (float) : Asset returns
benchmark (float) : Benchmark returns
length (simple int) : Lookback period
up_capture (simple bool) : If true, calculate up capture; if false, down capture
Returns: Capture ratio
autocorrelation(src, length, lag)
Calculates autocorrelation at specified lag
Parameters:
src (float) : Source series
length (simple int) : Lookback period
lag (simple int) : Lag for autocorrelation (default: 1)
Returns: Autocorrelation at specified lag
partial_autocorr(src, length)
Calculates partial autocorrelation at lag 1
Parameters:
src (float) : Source series
length (simple int) : Lookback period
Returns: PACF at lag 1 (equals ACF at lag 1)
autocorr_test(src, length, max_lag)
Tests for significant autocorrelation (Ljung-Box inspired)
Parameters:
src (float) : Source series
length (simple int) : Lookback period
max_lag (simple int) : Maximum lag to test
Returns: Sum of squared autocorrelations (higher = more autocorrelation)
cross_correlation(x, y, length, lag)
Calculates cross-correlation at specified lag
Parameters:
x (float) : First series
y (float) : Second series (lagged)
length (simple int) : Lookback period
lag (simple int) : Lag to apply to y (positive = y leads x)
Returns: Cross-correlation at specified lag
cross_correlation_peak(x, y, length, max_lag)
Finds lag with maximum cross-correlation
Parameters:
x (float) : First series
y (float) : Second series
length (simple int) : Lookback period
max_lag (simple int) : Maximum lag to search (both directions)
Returns: Tuple:
Pine Script® library
EL OJO DE DIOS - FINAL (ORDEN CORREGIDO)//@version=6
indicator("EL OJO DE DIOS - FINAL (ORDEN CORREGIDO)", overlay=true, max_boxes_count=500, max_lines_count=500, max_labels_count=500)
// --- 1. CONFIGURACIÓN ---
grpEMA = "Medias Móviles"
inpShowEMA = input.bool(true, "Mostrar EMAs", group=grpEMA)
inpEMA21 = input.int(21, "EMA 21", minval=1, group=grpEMA)
inpEMA50 = input.int(50, "EMA 50", minval=1, group=grpEMA)
inpEMA200 = input.int(200, "EMA 200", minval=1, group=grpEMA)
grpStrategy = "Estrategia"
inpTrendTF = input.string("Current", "Timeframe Señal", options= , group=grpStrategy)
inpADXFilter = input.bool(true, "Filtro ADX", group=grpStrategy)
inpADXPeriod = input.int(14, "Período ADX", group=grpStrategy)
inpADXLimit = input.int(20, "Límite ADX", group=grpStrategy)
inpRR = input.float(2.0, "Riesgo:Beneficio", group=grpStrategy)
grpVisuals = "Visuales"
inpShowPrevDay = input.bool(true, "Máx/Mín Ayer", group=grpVisuals)
inpShowNY = input.bool(true, "Sesión NY", group=grpVisuals)
// --- 2. VARIABLES ---
var float t1Price = na
var bool t1Bull = false
var bool t1Conf = false
var line slLine = na
var line tpLine = na
// Variables Prev Day
var float pdH = na
var float pdL = na
var line linePDH = na
var line linePDL = na
// Variables Session
var box nySessionBox = na
// --- 3. CÁLCULO ADX MANUAL ---
f_calcADX(_high, _low, _close, _len) =>
// True Range Manual
tr = math.max(_high - _low, math.abs(_high - _close ), math.abs(_low - _close ))
// Directional Movement
up = _high - _high
down = _low - _low
plusDM = (up > down and up > 0) ? up : 0.0
minusDM = (down > up and down > 0) ? down : 0.0
// Smoothed averages
atr = ta.rma(tr, _len)
plus = 100.0 * ta.rma(plusDM, _len) / atr
minus = 100.0 * ta.rma(minusDM, _len) / atr
// DX y ADX
sum = plus + minus
dx = sum == 0 ? 0.0 : 100.0 * math.abs(plus - minus) / sum
adx = ta.rma(dx, _len)
adx
// --- 4. CÁLCULO DE DATOS ---
ema21 = ta.ema(close, inpEMA21)
ema50 = ta.ema(close, inpEMA50)
ema200 = ta.ema(close, inpEMA200)
// MTF Logic
targetTF = inpTrendTF == "Current" ? timeframe.period : inpTrendTF == "15m" ? "15" : "60"
// CORRECCIÓN AQUÍ: Uso de argumentos nominales (gaps=, lookahead=) para evitar errores de orden
f_getSeries(src, tf) =>
tf == timeframe.period ? src : request.security(syminfo.tickerid, tf, src, gaps=barmerge.gaps_on, lookahead=barmerge.lookahead_off)
tf_close = f_getSeries(close, targetTF)
tf_high = f_getSeries(high, targetTF)
tf_low = f_getSeries(low, targetTF)
tf_ema21 = ta.ema(tf_close, inpEMA21)
tf_ema50 = ta.ema(tf_close, inpEMA50)
// Calcular ADX
float tf_adx = f_calcADX(tf_high, tf_low, tf_close, inpADXPeriod)
// Cruces
bool crossUp = ta.crossover(tf_ema21, tf_ema50)
bool crossDown = ta.crossunder(tf_ema21, tf_ema50)
bool crossSignal = crossUp or crossDown
bool adxOk = inpADXFilter ? tf_adx > inpADXLimit : true
// --- 5. LÓGICA DE SEÑALES ---
if crossSignal and adxOk and barstate.isconfirmed
t1Price := tf_ema21
t1Bull := tf_ema21 > tf_ema50
t1Conf := false
if not na(slLine)
line.delete(slLine)
slLine := na
if not na(tpLine)
line.delete(tpLine)
tpLine := na
label.new(bar_index, high + (ta.atr(14)*0.5), text="CRUCE T1", color=t1Bull ? color.green : color.red, textcolor=color.white, size=size.small)
bool touch = false
if not na(t1Price) and not t1Conf
if t1Bull
touch := low <= t1Price and close >= t1Price
else
touch := high >= t1Price and close <= t1Price
if touch and barstate.isconfirmed
t1Conf := true
float atr = ta.atr(14)
float sl = t1Bull ? low - (atr*0.1) : high + (atr*0.1)
float dist = math.abs(t1Price - sl)
float tp = t1Bull ? t1Price + (dist * inpRR) : t1Price - (dist * inpRR)
label.new(bar_index, t1Price, text="ENTRADA", color=color.yellow, textcolor=color.black, size=size.small)
slLine := line.new(bar_index, sl, bar_index + 15, sl, color=color.red, style=line.style_dashed, width=2)
tpLine := line.new(bar_index, tp, bar_index + 15, tp, color=color.green, style=line.style_dashed, width=2)
// --- 6. GRÁFICO ---
col21 = ema21 > ema21 ? color.teal : color.maroon
col50 = ema50 > ema50 ? color.aqua : color.fuchsia
col200 = ema200 > ema200 ? color.blue : color.red
plot(inpShowEMA ? ema21 : na, "EMA21", color=col21, linewidth=2)
plot(inpShowEMA ? ema50 : na, "EMA50", color=col50, linewidth=2)
plot(inpShowEMA ? ema200 : na, "EMA200", color=col200, linewidth=2)
bgcolor(ema50 > ema200 ? color.new(color.green, 95) : color.new(color.red, 95))
// --- 7. SESIÓN NY ---
isNYSummer = (month(time) == 3 and dayofmonth(time) >= 14) or (month(time) > 3 and month(time) < 11)
hourOffset = isNYSummer ? 4 : 5
nyHour = (hour - hourOffset) % 24
bool isSession = nyHour >= 6 and nyHour < 11
if isSession and inpShowNY
if na(nySessionBox)
nySessionBox := box.new(bar_index, high, bar_index, low, bgcolor=color.new(color.blue, 92), border_color=color.new(color.white, 0))
else
box.set_right(nySessionBox, bar_index)
box.set_top(nySessionBox, math.max(high, box.get_top(nySessionBox)))
box.set_bottom(nySessionBox, math.min(low, box.get_bottom(nySessionBox)))
if not isSession and not na(nySessionBox)
box.delete(nySessionBox)
nySessionBox := na
// --- 8. MÁX/MÍN AYER ---
hCheck = request.security(syminfo.tickerid, "D", high , lookahead=barmerge.lookahead_on)
lCheck = request.security(syminfo.tickerid, "D", low , lookahead=barmerge.lookahead_on)
if not na(hCheck)
pdH := hCheck
if not na(lCheck)
pdL := lCheck
if barstate.islast and inpShowPrevDay
line.delete(linePDH)
line.delete(linePDL)
if not na(pdH)
linePDH := line.new(bar_index - 50, pdH, bar_index, pdH, color=color.green)
if not na(pdL)
linePDL := line.new(bar_index - 50, pdL, bar_index, pdL, color=color.red)
alertcondition(crossSignal, "Cruce T1", "Cruce Tendencia 1")
alertcondition(touch, "Entrada Confirmada", "Entrada Confirmada")
Pine Script® indicator


