Volume Profile 3D (Zeiierman)█ Overview
Volume Profile 3D (Zeiierman) is a next-generation volume profile that renders market participation as a 3D-style profile directly on your chart. Instead of flat histograms, you get a depth-aware profile with parallax, gradient transparency, and bull/bear separation, so you can see where liquidity stacked up and how it shifted during the move.
Highlights:
3D visual effect with perspective and depth shading for clarity.
Bull/Bear separation to see whether up bars or down bars created the volume.
Flexible colors and gradients that highlight where the most significant trading activity took place.
This is a state-of-the-art volume profile — visually powerful, highly flexible, and unlike anything else available.
█ How It Works
⚪ Profile Construction
The price range (from highest to lowest) is divided into a number of levels (buckets). Each bar’s volume is added to the correct level, based on its average price. This builds a map of where trading volume was concentrated.
You can choose to:
Aggregate all volume at each level, or
Split bullish vs. bearish volume , slightly offset for clarity.
This creates a clear view of which price zones matter most to the market.
⚪ 3D Effect Creation
The unique part of this indicator is how the 3D projection is built. Each volume block’s width is scaled to its relative size, then tilted with a slope factor to create a depth effect.
maxVol = bins.bu.max() + bins.be.max()
width = math.max(1, math.floor(bucketVol / maxVol * ((bar_index - start) * mult)))
slope = -(step * dev) / ((bar_index - start) * (mult/2))
factor = math.pow(math.min(1.0, math.abs(slope) / step), .5)
width → determines how far the volume extends, based on relative strength.
slope → creates the angled projection for the 3D look.
factor → adjusts perspective to make deeper areas shrink naturally.
The result is a 3D-style volume profile where large areas pop forward and smaller areas fade back, giving you immediate visual context.
█ How to Use
⚪ Support & Resistance Zones (HVNs and Value Area)
Regions where a lot of volume traded tend to act like walls:
If price approaches a high-volume area from above, it may act as support.
From below, it may act as resistance.
Traders often enter or exit near these zones because they represent strong agreement among market participants.
⚪ POC Rejections & Mean Reversions
The Point of Control (POC) is the single price level with the highest volume in the profile.
When price returns to the POC and rejects it, that’s often a signal for reversal trades.
In ranging markets, price may bounce between edges of the Value Area and revert to POC.
⚪ Breakouts via Low-Volume Zones (LVNs)
Low volume areas (gaps in the profile) offer path of least resistance:
Price often moves quickly through these thin zones when momentum builds.
Use them to spot breakouts or continuation trades.
⚪ Directional Insight
Use the bull/bear separation to see whether buyers or sellers dominated at key levels.
█ Settings
Use Active Chart – Profile updates with visible candles.
Custom Period – Fixed number of bars.
Up/Down – Adjust tilt for the 3D angle.
Left/Right – Scale width of the profile.
Aggregated – Merge bull/bear volume.
Bull/Bear Shift – Separate bullish and bearish volume.
Buckets – Number of price levels.
Choose from templates or set custom colors.
POC Gradient option makes high volume bolder, low volume lighter.
-----------------
Disclaimer
The content provided in my scripts, indicators, ideas, algorithms, and systems is for educational and informational purposes only. It does not constitute financial advice, investment recommendations, or a solicitation to buy or sell any financial instruments. I will not accept liability for any loss or damage, including without limitation any loss of profit, which may arise directly or indirectly from the use of or reliance on such information.
All investments involve risk, and the past performance of a security, industry, sector, market, financial product, trading strategy, backtest, or individual's trading does not guarantee future results or returns. Investors are fully responsible for any investment decisions they make. Such decisions should be based solely on an evaluation of their financial circumstances, investment objectives, risk tolerance, and liquidity needs.
Search in scripts for "Up down"

LA - Opening Price based Previous day Range PivotThis "LA - Opening Price based Previous day Range Pivot" indicator is a custom technical analysis tool designed for Trading View charts. It plots support and resistance levels (often referred to as pivots or ranges) based on the current opening price combined with the previous period's trading range. The "previous period" can be daily, weekly, or monthly, making it a multi-timeframe tool. These levels are projected using Fibonacci-inspired multipliers to create potential breakout or reversal zones.
The core idea is inspired by concepts like the Opening Range Breakout (ORB) strategy or Fibonacci pivots, but it's customized here to use a dynamic range calculation (the maximum of several absolute price differences) rather than a simple high-low range. This makes it more robust for volatile markets. Levels are symmetric above (resistance) and below (support) the opening price, helping traders identify potential entry/exit points, stop-losses, or targets. This will be useful when there is a gap-up/down as in Nifty/Sensex .
Purpose of the Indicator:
To visualize potential support/resistance zones for the current trading session based on the opening price and historical range data. This helps traders anticipate price movements, such as breakouts above resistance or bounces off support
Use Cases:
Intraday Trading: On lower timeframes (e.g., 5-min or 15-min charts), it shows daily levels for short-term trades.
Swing Trading: On higher timeframes (e.g., hourly or daily), it displays weekly/monthly levels for longer holds.
Range Identification: The filled bands highlight "zones" where price might consolidate or reverse.
Conditional Display: Levels only appear on appropriate timeframes (e.g., daily levels on intraday charts <60min), preventing clutter.
Theoretical Basis: It builds on pivot point theory, where the opening price acts as a central pivot. Multipliers (e.g., 0.618 for Fibonacci golden ratio) project levels, assuming price often respects these ratios due to market psychology.
How Calculations Work
Let's dive into the math with examples. Assume a stock with:
Current daily open (cdo) = $100
Previous daily high (pdh) = $105, low (pdl) = $95, close (pdc) = $102, close 2 days ago (pdc2) = $98
Step 1: Dynamic Range Calculation (var_d2):
This is the max of:
|pdh - pdc2| = |105 - 98| = 7
|pdl - pdc2| = |95 - 98| = 3
|pdh - pdl| = |105 - 95| = 10 (previous day range)
|pdh - cdo| = |105 - 100| = 5
|pdl - cdo| = |95 - 100| = 5
|pdc - cdo| = |102 - 100| = 2
|pdc2 - cdo| = |98 - 100| = 2
Max = 10 (so range = 10). This ensures the range accounts for gaps and extended moves, not just high-low.
Step 2: Level Projections:
Resistance (above open): Open + (Range * Multiplier)
dre6 = 100 + (10 * 1.5) = 115
dre5 = 100 + (10 * 1.27) ≈ 112.7
... down to dre0 = 100 + (10 * 0.1) = 101
dre50 = 100 + (10 * 0.5) = 105 (midpoint)
Support (below open): Open - (Range * Multiplier)
dsu0 = 100 - (10 * 0.1) = 99
... up to dsu6 = 100 - (10 * 1.5) = 85
Without Indicator
With Indicator
Pros and Cons
Pros:
Multi-Timeframe Flexibility: Seamlessly integrates daily, weekly, and monthly levels, useful for aligning short-term trades with longer trends (e.g., intraday breakout confirmed by weekly support).
Dynamic Range Calculation: Unlike standard pivots (just (H+L+C)/3), it uses max of multiple diffs, capturing gaps/volatility better—great for stocks with overnight moves.
Customizable via Inputs: Users can toggle levels, adjust multipliers, or change timeframes without editing code. Inline inputs keep the UI clean.
Visual Aids: Filled bands make zones obvious; conditional colors highlight "tight" vs. "wide" ranges (e.g., for volatility assessment).
Fibonacci Integration: Levels based on proven ratios, appealing to technical traders. Symmetric supports/resistances simplify strategy building (e.g., buy at support, sell at resistance).
No Repainting: Uses historical data with lookahead, so levels are fixed once calculated—reliable for back-testing.
Cons:
Chart Clutter: With all toggles on, 50+ plots/fills can overwhelm the chart, especially on mobile or small screens. Requires manual disabling.
Complexity for Beginners: Many inputs and calculations; without understanding fib ratios or range logic, it might confuse new users.
Performance Overhead: On low timeframes (e.g., 1-min), fetching higher TF data multiple times could lag, especially with many symbols or back-tests.
Assumes Volatility Persistence: Relies on previous range projecting future moves; in low-vol markets (e.g., sideways trends), levels may be irrelevant or too wide/narrow.
No Alerts or Signals: Purely visual; no built-in buy/sell alerts or crossover conditions—users must add separately.
Hardcoded Styles/Colors: Limited customization without code edits (e.g., can't change line styles via inputs).
Also, not optimized for non-stock assets (e.g., forex with 24/7 trading).
In summary, this is a versatile pivot tool for range-based trading based on Opening price, excelling in volatile markets but requiring some setup. If you're using it, start with defaults on a daily chart and toggle off unnecessary levels.

BayesStack RSI [CHE]BayesStack RSI — Stacked RSI with Bayesian outcome stats and gradient visualization
Summary
BayesStack RSI builds a four-length RSI stack and evaluates it with a simple Bayesian success model over a rolling window. It highlights bull and bear stack regimes, colors price with magnitude-based gradients, and reports per-regime counts, wins, and estimated win rate in a compact table. Signals seek to be more robust through explicit ordering tolerance, optional midline gating, and outcome evaluation that waits for events to mature by a fixed horizon. The design focuses on readable structure, conservative confirmation, and actionable context rather than raw oscillator flips.
Motivation: Why this design?
Classical RSI signals flip frequently in volatile phases and drift in calm regimes. Pure threshold rules often misclassify shallow pullbacks and stacked momentum phases. The core idea here is ordered, spaced RSI layers combined with outcome tracking. By requiring a consistent order with a tolerance and optionally gating by the midline, regime identification becomes clearer. A horizon-based maturation check and smoothed win-rate estimate provide pragmatic feedback about how often a given stack has recently worked.
What’s different vs. standard approaches?
Reference baseline: Traditional single-length RSI with overbought and oversold rules or simple crossovers.
Architecture differences:
Four fixed RSI lengths with strict ordering and a spacing tolerance.
Optional requirement that all RSI values stay above or below the midline for bull or bear regimes.
Outcome evaluation after a fixed horizon, then rolling counts and a prior-smoothed win rate.
Dispersion measurement across the four RSIs with a percent-rank diagnostic.
Gradient coloring of candles and wicks driven by stack magnitude.
A last-bar statistics table with counts, wins, win rate, dispersion, and priors.
Practical effect: Charts emphasize sustained momentum alignment instead of single-length crosses. Users see when regimes start, how strong alignment is, and how that regime has recently performed for the chosen horizon.
How it works (technical)
The script computes RSI on four lengths and forms a “stack” when they are strictly ordered with at least the chosen tolerance between adjacent lengths. A bull stack requires a descending set from long to short with positive spacing. A bear stack requires the opposite. Optional gating further requires all RSI values to sit above or below the midline.
For evaluation, each detected stack is checked again after the horizon has fully elapsed. A bull event is a success if price is higher than it was at event time after the horizon has passed. A bear event succeeds if price is lower under the same rule. Rolling sums over the training window track counts and successes; a pair of priors stabilizes the win-rate estimate when sample sizes are small.
Dispersion across the four RSIs is measured and converted to a percent rank over a configurable window. Gradients for bars and wicks are normalized over a lookback, then shaped by gamma controls to emphasize strong regimes. A statistics table is created once and updated on the last bar to minimize overhead. Overlay markers and wick coloring are rendered to the price chart even though the indicator runs in a separate pane.
Parameter Guide
Source — Input series for RSI. Default: close. Tips: Use typical price or hlc3 for smoother behavior.
Overbought / Oversold — Guide levels for context. Defaults: seventy and thirty. Bounds: fifty to one hundred, zero to fifty. Tips: Narrow the band for faster feedback.
Stacking tolerance (epsilon) — Minimum spacing between adjacent RSIs to qualify as a stack. Default: zero point twenty-five RSI points. Trade-off: Higher values reduce false stacks but delay entries.
Horizon H — Bars ahead for outcome evaluation. Default: three. Trade-off: Longer horizons reduce noise but delay success attribution.
Rolling window — Lookback for counts and wins. Default: five hundred. Trade-off: Longer windows stabilize the win rate but adapt more slowly.
Alpha prior / Beta prior — Priors used to stabilize the win-rate estimate. Defaults: one and one. Trade-off: Larger priors reduce variance with sparse samples.
Show RSI 8/13/21/34 — Toggle raw RSI lines. Default: on.
Show consensus RSI — Weighted combination of the four RSIs. Default: on.
Show OB/OS zones — Draw overbought, oversold, and midline. Default: on.
Background regime — Pane background tint during bull or bear stacks. Default: on.
Overlay regime markers — Entry markers on price when a stack forms. Default: on.
Show statistics table — Last-bar table with counts, wins, win rate, dispersion, priors, and window. Default: on.
Bull requires all above fifty / Bear requires all below fifty — Midline gate. Defaults: both on. Trade-off: Stricter regimes, fewer but cleaner signals.
Enable gradient barcolor / wick coloring — Gradient visuals mapped to stack magnitude. Defaults: on. Trade-off: Clearer regime strength vs. extra rendering cost.
Collection period — Normalization window for gradients. Default: one hundred. Trade-off: Shorter values react faster but fluctuate more.
Gamma bars and shapes / Gamma plots — Curve shaping for gradients. Defaults: zero point seven and zero point eight. Trade-off: Higher values compress weak signals and emphasize strong ones.
Gradient and wick transparency — Visual opacity controls. Defaults: zero.
Up/Down colors (dark and neon) — Gradient endpoints. Defaults: green and red pairs.
Fallback neutral candles — Directional coloring when gradients are off. Default: off.
Show last candles — Limit for gradient squares rendering. Default: three hundred thirty-three.
Dispersion percent-rank length / High and Low thresholds — Window and cutoffs for dispersion diagnostics. Defaults: two hundred fifty, eighty, and twenty.
Table X/Y, Dark theme, Text size — Table anchor, theme, and typography. Defaults: right, top, dark, small.
Reading & Interpretation
RSI stack lines: Alignment and spacing convey regime quality. Wider spacing suggests stronger alignment.
Consensus RSI: A single line that summarizes the four lengths; use as a smoother reference.
Zones: Overbought, oversold, and midline provide context rather than standalone triggers.
Background tint: Indicates active bull or bear stack.
Markers: “Bull Stack Enter” or “Bear Stack Enter” appears when the stack first forms.
Gradients: Brighter tones suggest stronger stack magnitude; dull tones suggest weak alignment.
Table: Count and Wins show sample size and successes over the window. P(win) is a prior-stabilized estimate. Dispersion percent rank near the high threshold flags stretched alignment; near the low threshold flags tight clustering.
Practical Workflows & Combinations
Trend following: Enter only on new stack markers aligned with structure such as higher highs and higher lows for bull, or lower lows and lower highs for bear. Use the consensus RSI to avoid chasing into overbought or oversold extremes.
Exits and stops: Consider reducing exposure when dispersion percent rank reaches the high threshold or when the stack loses ordering. Use the table’s P(win) as a context check rather than a direct signal.
Multi-asset and multi-timeframe: Defaults travel well on liquid assets from intraday to daily. Combine with higher-timeframe structure or moving averages for regime confirmation. The script itself does not fetch higher-timeframe data.
Behavior, Constraints & Performance
Repaint and confirmation: Stack markers evaluate on the live bar and can flip until close. Alert behavior follows TradingView settings. Outcome evaluation uses matured events and does not look into the future.
HTF and security: Not used. Repaint paths from higher-timeframe aggregation are avoided by design.
Resources: max bars back is two thousand. The script uses rolling sums, percent rank, gradient rendering, and a last-bar table update. Shapes and colored wicks add draw overhead.
Known limits: Lag can appear after sharp turns. Very small windows can overfit recent noise. P(win) is sensitive to sample size and priors. Dispersion normalization depends on the collection period.
Sensible Defaults & Quick Tuning
Start with the shipped defaults.
Too many flips: Increase stacking tolerance, enable midline gates, or lengthen the collection period.
Too sluggish: Reduce stacking tolerance, shorten the collection period, or relax midline gates.
Sparse samples: Extend the rolling window or increase priors to stabilize P(win).
Visual overload: Disable gradient squares or wick coloring, or raise transparency.
What this indicator is—and isn’t
This is a visualization and context layer for RSI stack regimes with simple outcome statistics. It is not a complete trading system, not predictive, and not a signal generator on its own. Use it with market structure, risk controls, and position management that fit your process.
Metadata
- Pine version: v6
- Overlay: false (price overlays are drawn via forced overlay where applicable)
- Primary outputs: Four RSI lines, consensus line, OB/OS guides, background tint, entry markers, gradient bars and wicks, statistics table
- Inputs with defaults: See Parameter Guide
- Metrics and functions used: RSI, rolling sums, percent rank, dispersion across RSI set, gradient color mapping, table rendering, alerts
- Special techniques: Ordered RSI stacking with tolerance, optional midline gating, horizon-based outcome maturation, prior-stabilized win rate, gradient normalization with gamma shaping
- Performance and constraints: max bars back two thousand, rendering of shapes and table on last bar, no higher-timeframe data, no security calls
- Recommended use-cases: Regime confirmation, momentum alignment, post-entry management with dispersion and recent outcome context
- Compatibility: Works across assets and timeframes that support RSI
- Limitations and risks: Sensitive to parameter choices and market regime changes; not a standalone strategy
- Diagnostics: Statistics table, dispersion percent rank, gradient intensity
Disclaimer
The content provided, including all code and materials, is strictly for educational and informational purposes only. It is not intended as, and should not be interpreted as, financial advice, a recommendation to buy or sell any financial instrument, or an offer of any financial product or service. All strategies, tools, and examples discussed are provided for illustrative purposes to demonstrate coding techniques and the functionality of Pine Script within a trading context.
Any results from strategies or tools provided are hypothetical, and past performance is not indicative of future results. Trading and investing involve high risk, including the potential loss of principal, and may not be suitable for all individuals. Before making any trading decisions, please consult with a qualified financial professional to understand the risks involved.
By using this script, you acknowledge and agree that any trading decisions are made solely at your discretion and risk.
Best regards and happy trading
Chervolino.
Do not use this indicator on Heikin-Ashi, Renko, Kagi, Point-and-Figure, or Range charts, as these chart types can produce unrealistic results for signal markers and alerts.

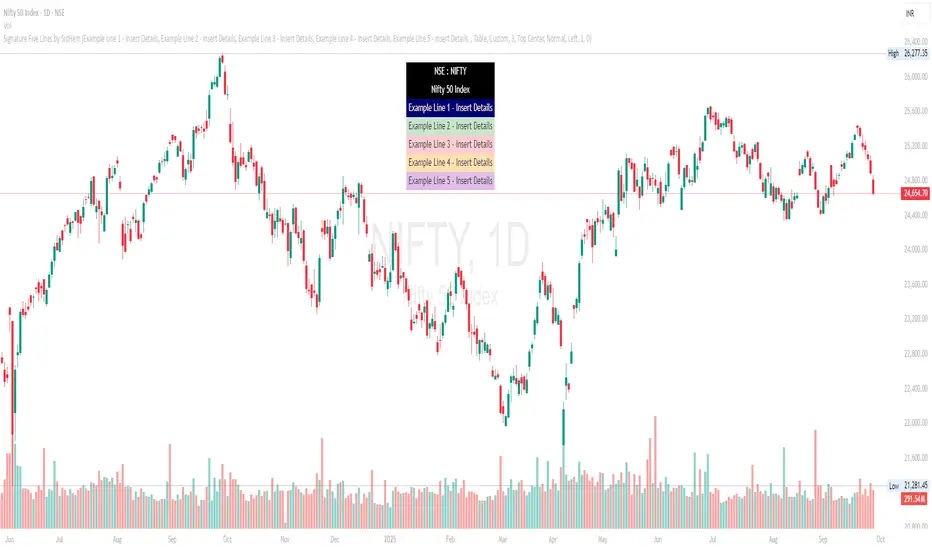
Signature Five Lines by SidHemSignature Five Lines by SidHem
Overview:
Signature Five Lines by SidHem is a chart overlay tool that lets traders and analysts display a fully customizable multi-line signature or text annotation directly on TradingView charts. It allows up to five user-defined lines, optional logo or emoji on the first line, and automatic inclusion of the symbol and instrument description. The display can be shown either as a table or a label, with complete control over fonts, colors, spacing, and positioning.
If you’re tired of adding your details manually on every new chart, Signature Five Lines by SidHem helps you display your standard information automatically on any chart you open.
This script is useful for traders who want to keep key information visible, add personal notes, or include contextual text on charts without manually adding labels or text boxes.
Inputs and How to Use Them
1. Multi-Line Signature
Enable Line 1–5: Toggle visibility of each signature line. Show or hide this line on the chart.
Line 1–5 Text: Enter the custom text for each line. Line 1 can include a logo or emoji if enabled.
2. Logo / Emoji
Show Emoji / Text in Line 1: Enable an emoji or small text to appear before Line 1 of the signature for personalization.
Logo Text: Enter the emoji or symbol to display at the start of Line 1 when enabled.
3. Symbol / Instrument
Show Symbol Row: Display the chart’s symbol (e.g., NSE:INFY) above your custom lines.
Show Name / Description Row: Display the instrument’s name or description below the symbol.
Combine Symbol & Name in 1 Row: Merge the symbol and description into a single row for compact display.
4. Display Mode
Display Mode: Choose how the signature is displayed: Table (row-based) or Label (near price).
Theme Skin: Select a prebuilt color theme or choose Custom to define your own colors for text and background.
5. Table Style
Table Vertical Spacer Rows: Number of empty rows added above the signature lines to adjust vertical positioning.
Table Position: Set the location of the table on the chart (Top, Middle, Bottom; Left, Center, Right).
Table Font Size: Set the font size for the signature lines. Options: Tiny, Small, Normal, Large, Huge.
6. Table Custom Line Colors
Lines 1–5 Background & Text Colors: Customize the background and text color for each signature line individually.
Symbol Row (line6) Background & Text Colors: Customize background and text colors for the symbol row.
Name/Description Row (line7) Background & Text Colors: Customize background and text colors for the description row.
7. Label Style (for Label Mode)
Label Text Color: Color of text when using Label mode.
Label Background Color: Background color of the label; supports transparency.
Label Style: Position of the label pointer relative to the bar (Left, Right, Up, Down, Center).
Label X Offset: Horizontal shift of the label in bars relative to the current bar.
Label Y Offset: Vertical shift of the label in price points; allows precise positioning above or below the price.
How it Works:
The script dynamically builds a display array combining the chart symbol, instrument description, and your custom signature lines.
Long text is automatically wrapped to ensure readability without overlapping chart elements.
Users can choose Table mode (row-based display) or Label mode (floating near price), with customizable X/Y offsets for precise placement.
Predefined color themes make it easy to match the chart’s style, or you can select Custom to fully control background and text colors for each line.
An optional logo/emoji can appear at the start of Line 1 for personalization.
Advantages:
Keeps key chart information visible at all times.
Adds a professional annotation layer to charts for notes or commentary.
Multi-line support allows clear separation of different information (symbol, description, personal notes, optional emoji).
Dynamic wrapping ensures text remains readable on different timeframes or zoom levels.
Works with any TradingView chart or instrument.
Recommended Use:
Add Prefixed notes or annotations directly on charts - simply calling it a Signature
Display symbol and description alongside personal commentary.
Combine multiple lines of information in a clean and readable overlay.
Tesla 3-6-9 Highlight (NY) 45-15 + Vertical Line- proTesla 3-6-9 Pro/Free Demo (NY) – User Guide
Overview
This indicator is designed to detect the Tesla 3-6-9 numeric patterns based on hour + minute or minute-only sums in New York time. It helps traders visually spot key moments on the chart with colored candles, symbols, vertical lines, and daily statistics.
Free Version: Shows minute-only signals 🔻.
Paid Version: Adds Hour+Minute signals 🔺, vertical line at minute 45, daily stats table, and customizable visuals.
Features
Tesla 3-6-9 Calculations
Hour + Minute: Calculates sum of digits of current hour + minute, reduces to 3, 6, or 9.
Minute-only: Calculates sum of digits of current minute only.
Candlestick Coloring
Up/Down candles are colored by default (green/bearish black).
Tesla patterns change the candle color (customizable).
Option to prioritize Hour+Minute over Minute-only.
Symbols
🔺 Hour+Minute Tesla signal.
🔻 Minute-only Tesla signal.
Can enable/disable independently.
Vertical Line
Appears at minute 45 for Paid Version.
Customizable color, width, and transparency.
Alerts
Optional sound alerts for both signal types.
Daily Statistics
Table showing number of Tesla signals per type for the day (Paid Version).
Settings Explained
Setting Description
Ignore zero digits when summing Whether 0 is ignored in digit sums.
Bullish Candle Color Color for up candles (default green).
Bearish Candle Color Color for down candles (default black).
Tesla Color (Hour+Minute) Candle color when Hour+Minute Tesla pattern is active.
Tesla Color (Minute-only) Candle color when Minute-only Tesla pattern is active.
Show 🔺 Hour+Minute Symbols Toggle visibility of 🔺 symbols.
Show 🔻 Minute-only Symbols Toggle visibility of 🔻 symbols.
Symbol Size Adjusts the size of the symbols.
Enable Sound Alerts Plays sound alerts when Tesla patterns occur.
Show Vertical Line at Minute 45 Toggle visibility of vertical line at 45th minute.
Vertical Line Color Color of the vertical line.
Vertical Line Transparency 0–255 transparency level for vertical line.
Vertical Line Width Width of the vertical line.
Hour+Minute priority over Minute-only Determines if Hour+Minute signals override Minute-only signals visually.
Paid Version Features Enabled Enables all Paid Version features (table, vertical line, Hour+Minute signals).
How to Use
Add the script to your TradingView chart.
Set Paid Version Features Enabled to true if you have access to the full version.
Customize colors, symbols, and alerts to your preference.
Watch for:
🔺 Hour+Minute signals
🔻 Minute-only signals
Candlestick color changes
Vertical line at minute 45
Daily Tesla statistics table (Paid Version)
Monetization Tips
If you plan to sell or share the Paid Version:
Publish on TradingView: Paid version requires publishing as a protected indicator.
Subscription Model: Offer monthly access to Paid Version.
Free Version as Teaser: Let users try minute-only signals for free.
Marketing: Highlight unique features:
Accurate Tesla 3-6-9 pattern detection
Customizable visuals and alerts
Daily statistics table
Vertical line for key minutes
Features
Feature Free Version Paid Version
Minute-only Tesla signals 🔻 ✅ ✅
Hour+Minute Tesla signals 🔺 ❌ ✅
Candlestick coloring ✅ ✅ (customizable colors)
Vertical line at minute 45 ❌ ✅
Sound alerts ✅ ✅
Daily statistics table ❌ ✅
Symbol size & color customization ✅ ✅
Ignore zero digits option ✅ ✅
Installation
Open TradingView
Click Indicators → Invite-Only Scripts
Search for Tesla 3-6-9 Indicator (NY)
Add it to your chart and configure settings
Subscription & Pricing Suggestions
Free Version: Access to minute-only signals 🔻 as a teaser
Paid Version: Full feature set (🔺 signals, vertical line, daily stats)
Monthly Subscription: $10/month
Offer trial period to attract new users
Usage Tips
Best used on 1-minute or 5-minute charts
Works with any market symbol
Track patterns visually without manual calculation
Use the daily statistics table to analyze Tesla signal frequency

PSAR+EMA+Hull+BBDescription
This all-in-one indicator combines four proven tools:
Parabolic SAR (Everget) — trend direction and potential reversals.
Exponential Moving Averages (20/50/100/200) — customizable lengths, colors, and offsets.
Hull Suite (InSilico) — smooth trend detection with multiple variations (HMA, THMA, EHMA).
Bollinger Bands — volatility and dynamic support/resistance.
Features
Toggle each module on/off in settings.
Fully configurable inputs (lengths, colors, offsets, multipliers).
Optional PSAR labels, highlights, and state fill.
Hull can color candles, draw band fills, and pull from higher timeframes.
Bollinger Bands include multiple basis types, stdev multipliers, and fill transparency.
Built-in alerts: PSAR direction change, Hull trending up/down.
Category
Trend Analysis (with Volatility as secondary).

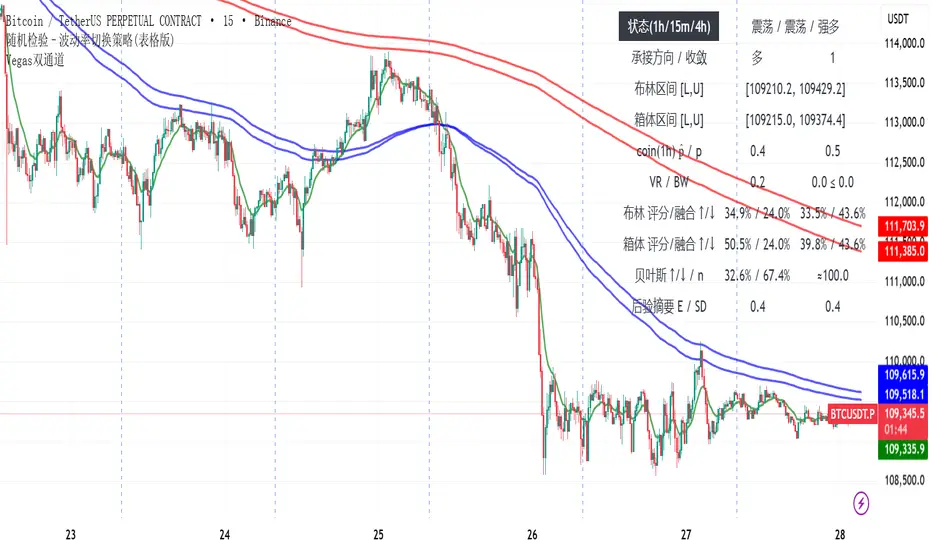
随机检验–波动率切换策略(表格版)随机检验 – 波动率切换策略(表格版)
模型原理
本指标基于统计学与波动率研究方法,结合多周期(15m / 1h / 4h)的市场数据,构建出一个“趋势-震荡”状态切换的分析框架。
核心思想:
通过 成交量加权的随机检验(coin test) 判断趋势方向及强弱;
使用 布林带带宽(Bandwidth)与方差比率(Variance Ratio) 识别波动收敛与扩张;
引入 贝叶斯统计(Beta 后验分布) 构造上涨概率背景,并对冲单一频段噪声;
在 布林视角与箱体视角 下生成右侧概率评分,最终融合多源概率形成市场状态评估。
关键假设
市场价格在短期内可视为“抛硬币检验”的结果,上涨/下跌概率并非完全均等,而是受成交量加权影响;
波动率在收敛后往往伴随趋势突破,布林带带宽可作为先行指标;
1h 周期的贝叶斯后验概率能够提供稳健的背景多空倾向;
多周期之间的关系符合“主判(1h)→承接(4h/15m)”的层级逻辑。
输出与功能
在图表右侧显示表格化仪表盘:
趋势状态(1h / 15m / 4h)
布林/箱体区间与收敛信号
各视角下的概率评分与融合结果
贝叶斯多空概率与后验分布摘要(E、SD、有效样本量)
同时绘制 1h 布林带,直观观察波动结构。
使用说明
该指标为 辅助决策工具,不直接生成交易信号。用户应结合自身策略和风险控制使用。
该版本为公开的测试版本。
Randomized Test – Volatility Switching Strategy (Dashboard Version)
Model Principle
This indicator is built on statistical and volatility analysis methods, combining multi-timeframe market data (15m / 1h / 4h) to construct a framework for switching between “trend” and “range” states.
Core ideas:
Use a volume-weighted randomized test (coin test) to determine trend direction and strength;
Apply Bollinger Bandwidth (BW) and Variance Ratio (VR) to detect volatility contraction and expansion;
Introduce Bayesian statistics (Beta posterior distribution) to build the bullish probability background and reduce single-frequency noise;
Generate right-side probability scores under both Bollinger view and Box view, and fuse them into a comprehensive market state evaluation.
Key Assumptions
In the short term, market prices can be modeled as outcomes of a “coin test,” where up/down probabilities are not perfectly equal but weighted by volume;
After volatility contraction, markets often break into trends, and Bollinger Bandwidth serves as a leading indicator;
The 1h Bayesian posterior probability provides a stable background bias for bullish/bearish tendencies;
Multi-timeframe relationships follow a hierarchical logic: main judgment (1h) → confirmation (4h/15m).
Outputs and Features
A dashboard-style table displayed on the right side of the chart, including:
Trend states (1h / 15m / 4h)
Bollinger/Box ranges and convergence signals
Probability scores and fusion results from different perspectives
Bayesian bullish probability and posterior summary (E, SD, effective sample size)
Visualization of the 1h Bollinger Bands for direct observation of volatility structure.
Usage
This indicator is an auxiliary decision-making tool. It does not generate trading signals directly. Users should apply it in combination with their own strategies and risk management.
This version is released as a public test version.
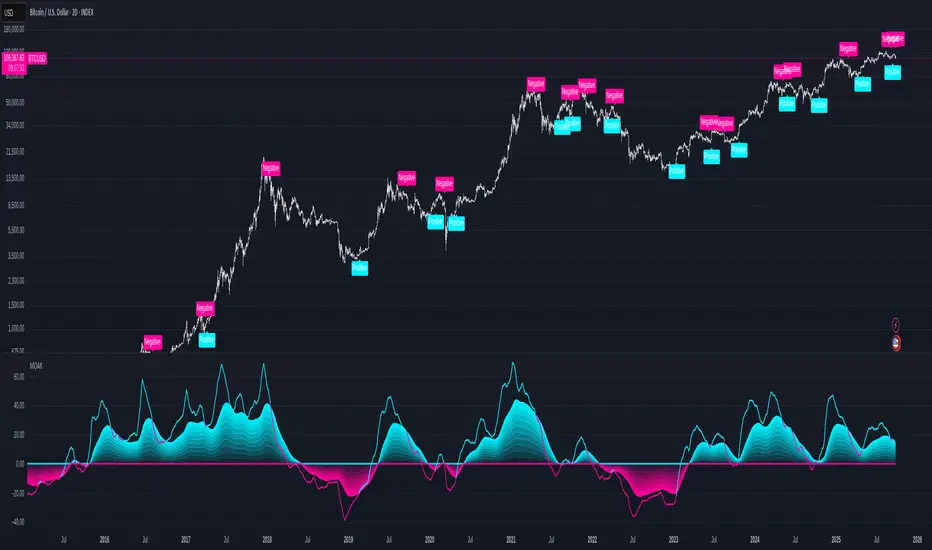
Multi-Oscillator Adaptive Kernel with MomentumMulti-Oscillator Adaptive Kernel w. Momentum
An adaptation of the indicator by AlphaAlgos : Multi-Oscillator-Adaptive-Kernel (MOAK) with Divergence . Please find the description of the indicator in the above link.
Apart from adding labels to show trend/momentum changes, the following changes have been made to the original script:
1. Sensitivity is used in the computation to scale the fast MOAK signal,
2. Selection between two indicator modes:
Trending - (the original script method) assesses whether smoothed MOAK is above/below 0 - for up/down trends respectively.
Momentum - assesses whether the fast MOAK signal is above/below the smoothed MOAK, and can be used to indicate potential trend reversals as momentum of current trend fades.
Momentum Volume Analyzer [CHE] Momentum Volume Analyzer — Adaptive momentum with volume-gated signals and expressive visual cues
Summary
This indicator combines a normalized momentum oscillator with a volume Z-score gate and adaptive gradient visuals. The oscillator centers around a midline and scales between a lower and an upper bound. Intensity is derived from the distance to the midline and is normalized inside a rolling window, which helps keep contrast consistent across regimes. Volume pressure is compressed to a discrete level between one and ten and is used to qualify momentum flips and extremes. Layered “burst” markers and optional background gradients provide immediate visual emphasis without adding new data sources. Pine version is v6. The script runs in a separate pane.
Motivation: Why this design?
Common oscillators flip rapidly during noisy conditions or flatten during calm periods, which obscures actionable shifts. A rolling normalization keeps the visual intensity stable across different regimes, and a volume gate reduces reactions when participation is weak. The goal is clearer momentum shifts that are supported by measurable activity rather than cosmetic smoothing alone.
What’s different vs. standard approaches?
Baseline reference: Classical RSI-style oscillators or simple filtered momentum without volume gating.
Architecture differences:
Local window normalization with gamma control for contrast.
Volume converted to a Z-score and compressed into a discrete level between one and ten with a configurable cap.
Directional color gradients that intensify with distance from the midline.
Layered glow markers with optional trail and an internal label budget to avoid UI overload.
Practical effect: Signals are visually stronger only when both momentum and volume align; background and line colors convey regime strength at a glance.
How it works (technical)
Momentum core: A high-pass path with automatic gain control produces a bounded oscillator centered around a midline. A simple moving average smooths the result over a short window.
Normalization and contrast: The absolute distance from the midline is scaled inside a rolling window and limited between zero and one. Two gamma parameters separately shape contrast for the line and for labels.
Coloring: When the oscillator is above the midline, a green gradient is used; below the midline, a red gradient is used. Intensity increases with normalized distance. Optional area fill to the midline and a background gradient reinforce strength.
Volume levels: Volume is standardized over a lookback window, clipped by a user cap, and mapped to a level between one and ten. Only positive excursions are considered; non-positive values map to zero.
Event markers: When the oscillator reaches extreme zones and the volume level is positive, the script spawns layered circular labels at fixed y-positions. A small trail can extend behind the event. An internal queue discards the oldest labels when a user-defined maximum is exceeded.
Alerts: Alerts fire on overbought and oversold spikes, midline shifts with minimum intensity and volume, and continuation patterns inside strong zones.
Parameter Guide
TFRSI length (default six): Core momentum lookback. Shorter values react faster but are less stable.
Signal SMA (default two): Light smoothing of the oscillator. Larger values reduce jitter.
Gradient window (default one hundred): Normalization window for intensity. Longer values produce steadier contrast but slower adaptation.
Line/marker transparency (default zero): Visual prominence of drawings. Higher values reduce dominance.
Background on and BG transparency (defaults true and eighty-five): Enables and tunes the pane background gradient.
Area fill to fifty and Fill transparency (defaults true and eighty): Fills between the oscillator and the midline.
Gamma bars/labels and Gamma plot (defaults zero point seven and zero point eight): Contrast shapers for markers and line. Higher values compress low intensities.
Bottom marker and Show last N (defaults true and three hundred thirty-three): Optional compact heat markers with a display cap.
Up/Down colors: Dark and neon pairs for positive and negative regimes.
Lookback (default two hundred) and Z cap (default five): Volume standardization window and clipping level before scaling to one through ten.
Enable bursts, Layers, Trail, Trail transparency, Max live labels, Size scale: Control the layered glow effect, trail length, opacity, label budget, and size multiplier. Reducing the size scale lowers visual dominance.
Spike min level, Shift min level, Min intensity, Rise/Fall length: Gates for alerts; adjust to balance sensitivity and false positives.
Reading & Interpretation
Line color and intensity: Green shades above the midline indicate bullish pressure; red shades below indicate bearish pressure. Stronger color corresponds to stronger normalized distance.
Background and fill: Reinforce regime strength; consider reducing transparency when the pane feels too busy.
Bursts and trails: Emphasize volume-backed extremes. Larger bursts reflect stronger volume levels or scaling choices.
Volume level: Internal level between one and ten. Levels near the upper bound signal exceptional activity.
Practical Workflows & Combinations
Trend following: Use midline cross upward with minimum shift level and intensity as a trigger. Confirm with structure such as higher highs and higher lows. For shorts, reverse the conditions.
Exits and risk: Fade exposure when intensity weakens toward the midline or when volume level drops below the shift threshold. Consider disabling bursts when monitoring many symbols.
Multi-asset and multi-timeframe: Defaults are designed to travel across liquid futures, large-cap equities, and major crypto pairs. For higher timeframes, increase the lookback window and consider reducing the Z cap.
Behavior, Constraints & Performance
Repaint and confirmation: Signals are evaluated on the live bar. They can appear and withdraw before bar close. For confirmed signals, require closed-bar alerts or manual confirmation.
Higher-timeframe sources: Not used. No `security` calls.
Resources: `max_bars_back` is two thousand. The script uses arrays and label objects, including loops for trails. The label budget mitigates clutter.
Known limits: Very illiquid symbols with unstable volume can reduce the usefulness of the Z-score. Sharp regime changes can still produce brief flips.
Sensible Defaults & Quick Tuning
Starting point: TFRSI length six, Signal two, Gradient window one hundred, Z cap five, Spike level six, Shift level four, Min intensity zero point four, Rise length three, Size scale zero point five.
Too many flips: Increase Signal, increase Gradient window, or raise Shift level.
Too sluggish: Decrease TFRSI length or reduce Gradient window.
Bursts too dominant: Lower Size scale or reduce Layers; increase Trail transparency or set Trail length to zero.
What this indicator is—and isn’t
This is a visualization and signal layer that couples momentum with a volume gate and adaptive visuals. It is not a complete trading system, optimizer, or predictor. Use it together with market structure, risk controls, and position management.
Disclaimer
The content provided, including all code and materials, is strictly for educational and informational purposes only. It is not intended as, and should not be interpreted as, financial advice, a recommendation to buy or sell any financial instrument, or an offer of any financial product or service. All strategies, tools, and examples discussed are provided for illustrative purposes to demonstrate coding techniques and the functionality of Pine Script within a trading context.
Any results from strategies or tools provided are hypothetical, and past performance is not indicative of future results. Trading and investing involve high risk, including the potential loss of principal, and may not be suitable for all individuals. Before making any trading decisions, please consult with a qualified financial professional to understand the risks involved.
By using this script, you acknowledge and agree that any trading decisions are made solely at your discretion and risk.
Best regards and happy trading
Chervolino

Mystic Pulse V2.0 [CHE] Mystic Pulse V2.0 — Adaptive DI streaks with gradient intensity for clearer trend persistence
Summary
Mystic Pulse V2.0 measures directional persistence by counting how often the positive or negative directional index strengthens and dominates. These counts drive gradient colors for bars, wicks, and helper plots, so intensity reflects local momentum rather than absolute values. A windowed normalization and gamma control adapt the visuals to recent conditions, preventing one regime from overpowering the next. The result is an immediate, at-a-glance read of trend direction and stamina without relying on crossovers alone.
Motivation: Why this design?
Classical DI and ADX signals can flip during choppy phases or feel sluggish in calm regimes. This script focuses on persistence: it increments a positive or negative streak only when the corresponding directional pressure both strengthens compared with the prior bar and dominates the other side. Simple OHLC pre-smoothing reduces micro-noise, and local normalization keeps the scale relevant to the last segment of data, not a distant past.
What’s different vs. standard approaches?
Reference baseline: Traditional DI and ADX lines with crossovers and fixed-scale thresholds.
Architecture differences:
Wilder-style recursive smoothing on true range and directional movement.
Streak counters for positive and negative pressure that advance only on strengthening and dominance.
Windowed normalization and gamma shaping for visual intensity.
Wick coloring via `plotcandle` with forced overlay from a pane indicator.
Practical effect: Bars and wicks grow more vivid during sustained pressure and fade during indecision. The column plots show streak depth directly, which helps filter one-bar flips.
How it works (technical)
1. Pre-smoothing: Open, high, low, and close are averaged over a short simple moving window to dampen micro-ticks.
2. Directional inputs: True range and directional movement are formed from the smoothed prices, then recursively smoothed using a Wilder-style update that carries prior state forward.
3. DI comparison: The script derives positive and negative directional ratios relative to smoothed range. A side advances its streak when it increases compared with the previous bar and exceeds the opposite side. The other streak resets.
4. Trend score and color base: The difference between positive and negative streaks defines the active side.
5. Normalization and gamma: The absolute streak magnitude and each side’s streak are normalized within a rolling window. Gamma parameters reshape intensity so mid-range values are either compressed or emphasized.
6. Rendering:
Two column plots show positive and negative streak counts in the pane with gradient colors.
A square marker at the bottom uses the global gradient as a compact heat cue.
Bar colors on the main chart use either the gradient, neutral trend colors, or no paint depending on toggles.
Wick, border, and candle overlays are colored via `plotcandle` with forced overlay.
7. State handling: Smoothed values and counters persist across bars; initialization uses first available values without lookahead. No higher-timeframe requests are used, so repaint risk is limited to normal live-bar evolution.
Parameter Guide
Show neutral candles (fallback) — Paints main-chart bars in plain up or down colors when gradients are disabled — Default false — Use when you prefer simple up/down coloring.
Show last N shapes — Limits bottom square markers — Default 333 — Reduce if your chart gets cluttered.
ADX smoothing length — Controls the Wilder smoothing window for range and directional movement — Default 9 — Larger values increase stability but respond later.
OHLC SMA length — Pre-smoothing for inputs — Default 1 — Increase slightly on noisy assets to reduce flip risk.
Gradient barcolor — Enables gradient bar paint on the main chart — Default true — Turn off to use wicks only or neutral bars.
Wick coloring — Colors wicks, borders, and bodies via overlay — Default true — Disable if it conflicts with other overlays.
Gradient window — Lookback for local normalization — Default 100 — Shorter windows adapt faster; longer windows provide steadier intensity.
Gradient transparency — Overall transparency for gradient paints — Default 0 — Increase to make gradients subtler.
Gamma bars/shapes — Contrast for bar and shape intensity — Default 0.70 — Lower values brighten mid-tones; higher values compress them.
Gamma plots — Contrast for the column plots — Default 0.80 — Tune separately from bar intensity.
Wick transparency — Transparency for wick coloring — Default 0 — Raise to let price action show through.
Up/Down colors (dark and neon) — Base and accent colors for both directions — Defaults as provided — Adjust to match your chart theme.
Reading & Interpretation
Pane columns: The green column represents the positive streak count; the red column represents the negative streak count. Taller columns signal stronger persistence.
Gradient marker: The bottom square indicates the active side and persistence strength at a glance.
Main-chart bars and wicks: Color direction shows the dominant side; intensity reflects the normalized and gamma-shaped streak magnitude. Faded tones suggest weak or fading pressure.
Practical Workflows & Combinations
Trend following: Enter in the direction of the active side when the corresponding column expands over several bars. Confirm with structure such as higher highs and higher lows or lower highs and lower lows.
Exits and stops: Consider scaling out when intensity fades toward mid-range while structure stalls. Tighten stops after extended streaks or when wicks lose intensity.
Multi-asset/Multi-TF: Use defaults for liquid assets on intraday to swing timeframes. For highly volatile instruments, raise smoothing and the normalization window. For calm markets, lower them to regain sensitivity.
Behavior, Constraints & Performance
Repaint/confirmation: Values update during the live bar and stabilize after bar close. No historical repaint beyond normal live-bar updates.
security()/HTF: Not used; cross-timeframe repaint paths do not apply.
Resources: Declared `max_bars_back` two thousand; no explicit loops or arrays; plot and label limits are generous.
Known limits: Streak counters can remain elevated during slow reversals. Very short normalization windows can cause rapid intensity swings. Gaps or extreme spikes may temporarily distort intensity until the window adapts.
Sensible Defaults & Quick Tuning
Start with: ADX smoothing nine, OHLC SMA one, normalization window one hundred, gradient and wick coloring enabled, gamma around zero point seven to zero point eight.
Too many flips: Increase ADX smoothing and the normalization window; consider a small bump in OHLC SMA.
Too sluggish: Decrease ADX smoothing and the normalization window.
Colors overpower chart: Increase gradient and wick transparency or raise gamma to compress mid-tones.
What this indicator is—and isn’t
This is a visualization and signal layer that represents directional persistence and intensity. It does not issue trade entries or exits on its own and is not predictive. Use it alongside market structure, volume, and risk controls.
Disclaimer
The content, including any code, is for educational and informational purposes only and does not constitute financial advice or a recommendation to buy or sell any instrument. Trading involves substantial risk, including the possible loss of principal. Past performance is not indicative of future results. Always do your own research and consider consulting a qualified professional.

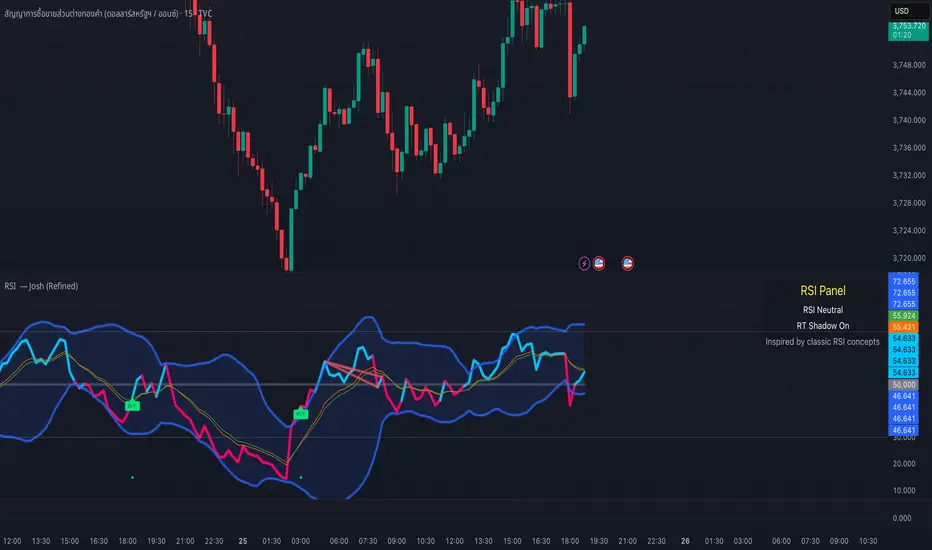
RSI — Josh (Refined)RSI Buy/Sell Pro — Josh (Refined)
Overview
This study enhances the classic RSI (Relative Strength Index) by adding multiple visualization layers and research tools. It helps users see overbought/oversold conditions, divergence patterns, and momentum shifts more clearly — in a way that is visually intuitive.
⚠️ Disclaimer: This script is for educational and research purposes only. It does not provide financial advice or trading recommendations. Past signals are not indicative of future results. Users remain fully responsible for their own decisions and risk management.
Key Features
Custom RSI Signals
Flexible signal modes (Strict 30/70, Loose, Aggressive 50-cross)
Optional “BUY/SELL” visual text or compact labels
Adjustable cooldown between signals
RSI Divergence Detection
Classic bullish/bearish divergence with pivot confirmation
Real-time “Shadow Divergence” preview (may repaint, by design)
Visual waterline and shaded shadow effects
MA Cross on RSI
Overlay fast/slow moving averages directly on the RSI scale
Crossovers highlighted with markers and alerts
Bollinger Aura (Glow Effect)
Bollinger Bands applied to RSI with customizable color modes
Single color, Upper/Lower, or Zone-driven bull/bear tint
Optional soft fill between bands for clarity
Guidance Panel
On-chart panel summarizing RSI state (OB/OS/Neutral), real-time shadow status, and credits
Alerts Included
RSI BUY / SELL cross conditions
RSI MA cross up / down
Divergence signals (classic & real-time)
Usage Notes
Designed to visualize RSI dynamics and assist in technical research
The “BUY/SELL” markers are visual study tags only — not trade calls
For best practice, combine with higher timeframe context, support/resistance, or volume analysis
Always validate ideas in a demo environment before applying to live trading
Compliance & Credits
Built in Pine Script® v5 on TradingView
Indicator name and labels are for visualization only — not investment advice
Credits: Inspired by classic RSI concepts, refined with additional visualization methods
✅ This description keeps your script compliant:
No performance guarantees
No marketing language like “make profit fast”
Clear disclaimer & educational framing
ICT Turtle Soup (Riz)The ICT Turtle Soup Complete System is an advanced implementation of the Inner Circle Trader's interpretation of the classic Turtle Soup pattern, designed to identify and trade liquidity sweeps at key market levels. This strategy capitalizes on the systematic stop-loss hunting behavior of institutional traders by detecting when price temporarily breaches significant support/resistance levels to trigger retail stop-losses, then quickly reverses direction.
Core Trading Logic
Liquidity Sweep Detection Method
The strategy monitors five critical liquidity pools where retail traders commonly place stop-loss orders:
⦁ Yesterday's High/Low: Previous daily session extremes
⦁ Daily High/Low: Rolling 20-day period extremes
⦁ 4-Hour High/Low: 30-period extremes on 4H timeframe
⦁ 1-Hour High/Low: 50-period extremes on hourly timeframe
⦁ Recent High/Low: Current timeframe extremes (20-40 bars based on trading mode)
Entry Signal Generation Process
Buy Signal (Sell-Side Liquidity Sweep):
1. Price penetrates below a key support level by a minimum threshold (5-15 ticks depending on signal quality settings)
2. The penetration bar must show strong rejection with at least 30-50% of the candle's range closing back above the swept level
3. Multi-timeframe confirmation checks for structure shift on lower timeframe (break of recent swing high)
4. Confluence scoring system evaluates 7 factors, requiring minimum 3 confirmations:
⦁ Liquidity sweep detected (weighted 2x)
⦁ Higher timeframe bullish market structure
⦁ Lower timeframe bullish break of structure
⦁ Bullish Fair Value Gap presence
⦁ Bullish Order Block formation
⦁ ICT Kill Zone timing alignment
Sell Signal (Buy-Side Liquidity Sweep):
Mirror opposite of buy signal logic, detecting sweeps above resistance levels with bearish rejection.
Risk Management & Position Sizing
Stop Loss Placement:
⦁ Calculated using ATR (Average True Range) multiplied by an adaptive factor
⦁ Base multipliers: Scalping (1.0x), Day Trading (1.5x), Swing Trading (2.0x)
⦁ Further adjusted by signal quality: Conservative (-20%), Balanced (0%), Aggressive (+20%)
⦁ Positioned beyond the liquidity sweep point to avoid re-sweeping
Take Profit Targets:
⦁ TP1: 2.0R (Risk-Reward ratio)
⦁ TP2: 3.5R
⦁ TP3: 5.0R
⦁ All levels rounded to tick precision for accurate order placement
Advanced Features & Filters
Multi-Timeframe Structure Analysis
The system performs top-down analysis across three timeframes:
⦁ Higher Timeframe (HTF): Determines primary trend bias
⦁ Medium Timeframe (MTF): Confirms intermediate structure
⦁ Lower Timeframe (LTF): Identifies precise entry triggers
ICT Kill Zones
Incorporates time-based filtering for optimal trading sessions:
⦁ Asian Session (8PM-12AM UTC)
⦁ London Session (2AM-5AM UTC)
⦁ New York Session (7AM-10AM UTC)
⦁ London Close (10AM-12PM UTC)
Smart Money Concepts Integration
⦁ Fair Value Gaps (FVG): Identifies and displays price inefficiencies that act as magnets
⦁ Order Blocks: Marks institutional accumulation/distribution zones
⦁ Mitigation Detection: Automatically removes FVGs and Order Blocks when price fills them
⦁ Duplicate Sweep Prevention: 10-bar lookback prevents multiple signals at same level
Adaptive Trading Modes
Three pre-configured modes automatically adjust all parameters:
⦁ Scalping: Tight stops, quick targets, 15-minute to 1-hour focus
⦁ Day Trading: Balanced approach, 4-hour to daily analysis
⦁ Swing Trading: Wide stops, extended targets, daily to weekly perspective
⦁ Custom Mode: Full manual control of all parameters
Signal Quality Management
⦁ Conservative: Requires 5/7 confluence factors, tighter sweep threshold (5 ticks), 50% minimum rejection
⦁ Balanced: Standard 3/7 confluence, moderate threshold (10 ticks), 30% rejection
⦁ Aggressive: Only 2/7 confluence needed, wider threshold (15 ticks), 20% rejection
Visual Components & Dashboard
Real-Time Information Panel
Displays current market conditions including:
⦁ Active trading mode and quality settings
⦁ Timeframe configuration (HTF/MTF/LTF)
⦁ Market bias from higher timeframes
⦁ Current kill zone status
⦁ Liquidity sweep detection status
⦁ Confluence scoring for both directions
⦁ Risk parameters and targets
Trade Visualization
⦁ Entry, stop-loss, and three take-profit levels with precise price labels
⦁ Automatic cleanup when targets are hit or new signals appear
⦁ Maximum of one active setup displayed for chart clarity
⦁ Color-coded boxes for Fair Value Gaps and Order Blocks
How to Use This Indicator
Recommended Timeframes
⦁ Scalping Mode: 1-minute to 5-minute charts
⦁ Day Trading Mode: 5-minute to 15-minute charts
⦁ Swing Trading Mode: 1-hour to 4-hour charts
Optimal Market Conditions
⦁ Works best in ranging or trending markets with clear support/resistance levels
⦁ Most effective during high-liquidity sessions (London/New York overlap)
⦁ Avoid using during major news events unless specifically targeting news-driven sweeps
Signal Interpretation
1. Wait for triangle signal (up/down) with confluence score
2. Verify the swept level shown in the dashboard
3. Confirm risk-reward ratios match your trading plan
4. Enter at market or set limit order at indicated entry level
5. Place stop-loss and take-profit orders at displayed levels
Customization Tips
⦁ Adjust Signal Quality based on market volatility (Conservative for volatile, Aggressive for quiet)
⦁ Modify sweep threshold if getting too many/few signals
⦁ Toggle individual liquidity levels based on their relevance to your timeframe
⦁ Use Kill Zone filter for session-specific trading
Risk Disclaimer
This indicator identifies potential trade setups based on liquidity sweep patterns but does not guarantee profitable outcomes. Past performance does not indicate future results. Always use proper risk management and never risk more than you can afford to lose. The indicator should be used as part of a comprehensive trading plan that includes your own analysis and risk tolerance assessment.

Strong Trend Suite — Clean v6A clean, rules-based trend tool for swing traders. It identifies strong up/down trends by syncing five pillars:
Trend structure: price above/below a MA stack (EMA20 > SMA50 > EMA200 for up; inverse for down).
Momentum: RSI (50 line) and MACD (line > signal and side of zero).
Trend strength: ADX above a threshold and rising.
Volume confirmation: OBV vs its short MA (accumulation/distribution).
Optional higher-TF bias: weekly filter to avoid fighting bigger flows.
When all align, the background tints and the mini-meter flips green/red (UP/DOWN).
It also marks entry cues: pullbacks to EMA20/SMA50 with a MACD re-cross, or breakouts of recent highs/lows on volume.
Built-in alerts for strong trend, pullback, and breakout keep you hands-off; use “Once per bar close” on the Daily chart for best signal quality.
Consecutive Close Colorer (5+ with retroactive coloring)“Spot momentum streaks instantly — highlight runs of consecutive closes with color & boxes.”
“Turn price streaks into clear visuals. See momentum, strength, and exhaustion at a glance.”
“Simple way to track consecutive up/down closes — momentum made obvious.”
“Make market streaks stand out: candle coloring + shaded zones for clear momentum.”
Strong Candle Detector (Candles Close UP/DOWN)The Strong Candle Detector highlights candles that close decisively above or below the previous candle’s range, which means the resting liquidity of the previous candle has been entirely absorbed.
How it works:
A candle is considered Bullish (UP) when its close is higher than the previous candle’s high.
A candle is considered Bearish (DOWN) when its close is lower than the previous candle’s low.
This tool helps traders:
Spot strong breakouts or breakdowns.
Know when a liquidity sweep of a previous candle's extremes has failed
Quickly identify potential momentum continuation or reversal points.
Improve chart clarity by emphasizing only significant candles.
⚠️ Note: This indicator does not provide buy/sell signals. It is meant as a visual aid to support your trading strategy.

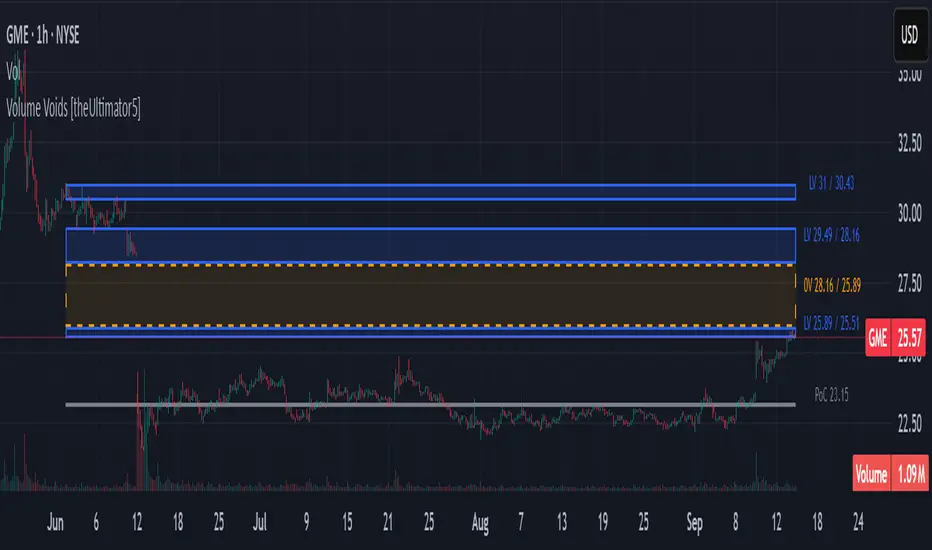
Volume Voids [theUltimator5]Volume Voids highlights price regions with no or unusually thin participation over a chosen lookback. It bins the lookback’s full price range into equal steps, assigns each bar’s close to a bin, and accumulates volume per bin. Contiguous runs of zero-volume bins are shown as “voids,” while low-volume runs (below a dynamic threshold) mark thin-liquidity “corridors” where price often traverses quickly when revisited.
An optional PoC (Point of Control) line marks the mid-price of the highest-volume bin—commonly treated as a recent “value” area that price may revisit.
What it draws on your chart
Histogram (optional): Right-anchored horizontal volume-by-price bars built from your lookback and bin count. Bars tint green→red via a simple delta proxy (up-bar volume minus down-bar volume) to hint at directional participation inside each price band.
Point of Control (optional): A horizontal line at the highest-volume bin’s mid-price (the PoC).
Zero-Volume Voids: Translucent boxes where no bin volume printed within the window (detected between the first and last non-empty bins ).
Low-Volume Zones: Translucent boxes where bin volume is below a dynamic threshold (see formula below), often acting like low-friction corridors.
How it works
Slice the lookback’s high→low into N equal price bins.
Assign each bar’s closing price to a bin and add that bar’s volume to the bin total. A simple up/down-bar delta proxy drives the histogram’s tinting.
PoC = bin with the maximum accumulated volume.
Zero-Volume Voids = contiguous runs of bins with exactly zero volume (bounded by the first/last occupied bins).
Low-Volume Zones = contiguous runs of bins with volume below:
threshold = total_window_volume ÷ (divisor × number_of_bins)
Lower divisor → more LV boxes; higher divisor → stricter/fewer boxes.
Note: This is a lightweight, chart-native approximation of a volume profile. Volume is binned by bar close (not by tick-level prints or intrabar distribution), so “voids”/“thin” areas reflect this approximation.
Key inputs
Lookback Period: Window for calculations.
Number of Volume Boxes (bins): Histogram resolution.
PoC / Show Histogram / Anchor to Right Side: Visibility and layout controls.
Low-Volume Threshold Divisor: Sensitivity for LV detection.
Colors & Labels: Customize zero-volume / low-volume box colors and optional labels with offsets.
How to use (educational, not signals)
Context: High-volume = acceptance; thin/zero-volume = inefficiency. Price often rotates near acceptance and moves faster through thin areas.
Revisits: On returns to prior voids/LV zones, watch for accelerated moves or fills; PoC can serve as a balance reference.
Confluence: Pair with trend tools (e.g., ADX), VWAP/session markers, or structure levels for timing and risk.
Limitations & performance
Bins use closing price only; intrabar distribution is not modeled.
Detections refresh on the live bar; visuals can be heavy on large lookbacks/high bin counts—reduce bins/lookback or hide labels if needed.
Weighted Sector ADD (sign-weighted)What it is
A true, cap-weighted advances/declines (ADD) proxy for the S&P 500 using sector ETFs. Each sector contributes +1 if it’s up on the bar, −1 if it’s down, 0 if flat. Those signals are then weighted by your sector weights (auto-normalized to 100%) and summed into a single breadth line. The result is a fast, low-noise read of how much of the S&P (by sector weight) is advancing vs. declining right now.
- Tracks participation, not price magnitude—perfect for spotting “broad vs. narrow” moves
- Heavily weighted sectors (e.g., Tech) matter proportionally more, reflecting real index impact
- Simple scale: ~−1 to +1 (all weight down → all weight up)
Chart Elements
- Green/Red Columns – “Weighted ADD”: Current bar’s weighted breadth (sign-based by default)
- Blue Line – “Weighted MA”: SMA of the weighted ADD (regime filter)
- Zero/Guide Lines (optional): 0.0, ±0.2 (mild), ±0.6 (strong)
- Labels (optional): Text markers at those guide levels
- Advancing Weight % (optional): Label showing ((ADD+1)/2)*100 → share of total sector weight advancing
How to Read (Quick Guide)
- +0.60 to +1.00 → Broad, one-sided risk-on (most sector weight advancing)
- +0.20 to +0.60 → Moderate, supportive breadth
- −0.20 to +0.20 → Mixed/choppy; rotation
- −0.60 to −1.00 → Broad, one-sided risk-off
- MA above/below zero → Simple regime indicator; zero-crosses could be potential alert triggers
- Divergence: Strong price move with a weak/flat ADD could potentially warn of narrow participation
Inputs & settings
Calculation
- Use returns instead of up/down sign?
OFF (default): true weighted participation (+1/−1/0)
ON: weighted sector returns (winsor-capped). Use if you want magnitude, not just direction
- Winsor cap (returns mode): Caps per-sector contribution in returns mode (e.g., 0.02 = ±2%)
- Smoothing MA length: SMA period for the blue “Weighted MA” line
- Source timeframe: Compute signals on another TF (e.g., “60”) but plot on your chart TF
Visibility
- Show Weighted ADD (bars): Toggle the green/red columns
- Show Weighted ADD MA: Toggle the blue SMA line
- Show Zero Line (0): Toggle the 0.0 reference line
- Show ±0.2 / ±0.6 guide lines: Toggle the helper levels
- Show guide labels: Draw small text labels at 0, ±0.2, ±0.6
- Guide label offset (bars left): Move labels left if they overlap the right edge values
- Show Advancing Weight % label: Toggle the % of sector weight currently advancing
Sector Symbols (ETF proxies)
- XLK, XLY, XLF, XLV, XLC, XLI, XLP, XLE, XLB, XLU, XLRE: Defaults to the SPDR sector ETFs. You can swap for alternative proxies if desired.
Sector Weights (auto-normalize)
- Weight inputs for each sector (e.g., Tech 0.30, Financials 0.13…). These auto-normalize to 1.0 so you can paste rough numbers; the script scales them.
- Keep weights fresh. GICS sector weights drift; update periodically (e.g., quarterly).
Alerts included
- “Weighted ADD crossed above 0”
- “Weighted ADD crossed below 0”
Version
v1.0 – Initial release (weighted sign-based ADD + SMA, zero/guide lines & labels, Adv % label, alerts).

Iani SMC Sniper XAU v2.2 (Long+Short + News Countdown, v6)Iani SMC Sniper v2.6 — Anytime • Auto Pip • FVG 50% • OB • News Panel
Smart-Money Concepts made simple for intraday XAU/USD (works on any symbol).
Finds BOS, 50% FVG “sniper” entries, optional Order Blocks, London H/L, news countdown, and a mini info panel.
What it does
BOS (Break of Structure): detects bullish/bearish BOS after London sweep logic.
FVG 50% entries: plots precise long/short entry dots at the midpoint of the gap.
Auto TP/SL: TP = RR × risk, SL below/above recent swing with a small buffer.
Order Blocks (optional): marks the last opposite candle after BOS and alerts on OB revisit.
London High/Low: tracks session range; session filter is optional.
News countdown: shows next event time and minutes left (user-selectable timezone).
Mini Panel: top-left table with Trend (last BOS), Next news, R:R, Pip size.
Inputs (key)
Auto pip size: uses syminfo.mintick. Manual override available.
Risk:Reward (RR): default 2.0.
Pivot length: swing sensitivity.
Sessions: enable if you want signals only 12:00–20:00 (symbol timezone). Off = anytime.
News timezone: pick your own (e.g., Europe/Brussels, America/New_York).
Absolute & daily times: add your events (strings like 2025-09-17 20:00 or 14:30,16:00…).
Show labels/levels/OBs: toggle on/off.
Alerts included
BOS Bullish / BOS Bearish
BUY Entry / SELL Entry (return to 50% FVG)
Bullish OB revisit / Bearish OB revisit
TP Long/Short reached, SL Long/Short hit
NEWS WARNING (warning window only; does not block signals)
To use: Add Alert → Condition: this indicator → choose any of the alertconditions.
Best use
Bias: H1 for structure.
Execution: M15 (standard) or M5 (aggressive).
Works great on XAUUSD, but is symbol-agnostic (auto pip adapts).
Notes
News times display in the timezone you pick in settings.
OBs are a simple implementation meant for quick visual guidance.
Labels: BUY/SELL near entries, TP/SL on set and when hit, BOS up/down.
Risk disclaimer
This tool is for education only. Not financial advice. Backtest and manage risk.

EMA 200 MultiTF G/R + Cross Alerts by LifeHack Trader1. Indicator Setup
The script starts by defining the version of Pine Script (v5) and creating an indicator called "EMA 200 MultiTF G/R + Cross Alerts by LifeHack Trader."
The overlay=true parameter ensures that the indicator is plotted directly on the price chart.
2. Function to Get EMA200
A custom function getEma200 is defined to retrieve the 200-period Exponential Moving Average (EMA) for a specified timeframe (tf).
This function uses the request.security function to fetch the close price's EMA from different timeframes.
3. Calculate EMA200 for Multiple Timeframes
The script calculates the EMA200 for four timeframes: 15 minutes ("15"), 1 hour ("60"), 4 hours ("240"), and 1 day ("D").
These values are stored in variables (ema15, ema1h, ema4h, ema1d) and represent the EMA for each timeframe.
4. Determine Price Above or Below EMA200 (G/R)
For each timeframe, the script checks whether the closing price is above or below the EMA200.
It uses boolean checks to determine if the price is above the EMA200, assigning the status "G" (Green) for above and "R" (Red) for below.
5. Cross Signal Detection (Up/Down)
The script detects crossovers and crossunders between the price and EMA200 for each timeframe.
A crossover signal is detected when the price crosses above the EMA200 (bullish), and a crossunder signal is detected when the price crosses below the EMA200 (bearish).
These signals are stored in separate variables (crossUp, crossDown).
6. Display a Table with G/R Status and Cross Alerts
A table is created and displayed in the top-right corner of the chart. The table shows the status (G or R) for each timeframe and the cross signal (▲ for crossover, ▼ for crossunder, or - for no cross event).
The table is updated with the respective values for each timeframe every time a new bar is formed.
7. Alert Conditions
The script defines alert conditions based on the crossovers and crossunders.
When a price crosses above the EMA200 (cross-up), an alert is triggered for a potential buy opportunity. When the price crosses below the EMA200 (cross-down), an alert is triggered for a potential sell opportunity.
Alerts are configured for each timeframe (15 minutes, 1 hour, 4 hours, and 1 day).
This script provides a comprehensive system for monitoring price action relative to the EMA200 on multiple timeframes, highlighting crossovers, and delivering visual feedback and alerts based on the price's relationship with the EMA.

Pipnotic HTF BarsDescription:
Pipnotic HTF Bars projects higher-timeframe (HTF) candles to the right of current price so you can “peek ahead” with clean, fixed-width silhouettes. The latest HTF bar updates live until it closes; completed HTF bars are frozen and kept in a tidy row to the right. Bodies inherit up/down colours, wicks sit on the body edge (no line through the body), and transparency/borders are configurable for a lightweight, elegant overlay.
How It Works:
The script reads true HTF opens via request.security and detects new HTF boundaries precisely.
Completed HTF bars are captured with look ahead off and stored; they never repaint.
The current HTF bar uses look ahead on and updates tick-by-tick until the next HTF bar begins.
Each candle is drawn as a fixed bar-index width box and wick, anchored a set number of bars to the right of the chart, then spaced evenly.
Visualization and Management:
Candles are rendered as boxes (bodies) plus edge-wicks (coloured to match the body).
You choose how many completed HTF candles to keep visible; older ones are automatically pruned.
Width, spacing, transparency, and borders make the projection readable without cluttering price.
Designed to stay performant and within TradingView’s shape limits.
Key Features & Inputs:
Higher Timeframe (HTF): W, D, 240, 120, 60, 30, 15.
Live Current Bar: The most recent HTF candle updates until it closes (no duplicate static bar).
Number of Candles: Keep the last N completed HTF candles to the right.
Fixed Projection Geometry:
Projected width (bars) : set a constant visual width per candle.
Gap (bars) : spacing between projected candles.
Right shift : anchor the projection a fixed distance beyond the latest bar.
Styling : Up/Down colours, body transparency, optional borders, wicks coloured same as body and drawn from body edge → high/low (never through the body).
Overlay : Works on any symbol and chart timeframe.
Enhanced Visualization:
Edge-wicks align visually with the close side of the body, producing a crisp, unobstructed read of range (H–L) and direction (O→C).
Fixed widths and even spacing create a timeline-like panel to the right of price, ideal for multi-timeframe context without compressing your main chart.
Transparency lets you “ghost” the projection so LTF price action remains visible beneath.
Benefits of Using the Pipnotic HTF Script:
Instant HTF context without switching charts or compressing the main view.
Non-repainting history: Completed HTF candles are locked the moment a new one starts.
Cleaner decision surface: Edge-wicks and soft transparency reduce visual noise.
Time-saving workflow: Scan upcoming HTF structure at a glance (range, bias, progress).
Configurable & lightweight: Tune width, spacing, and count to fit any layout.
Tip: Using the daily HTF on an hourly or less timeframe and watching as price tests the open of the current day, especially if prices e.g. traded below the open, can provide some great trades as prices move above and retest the open.

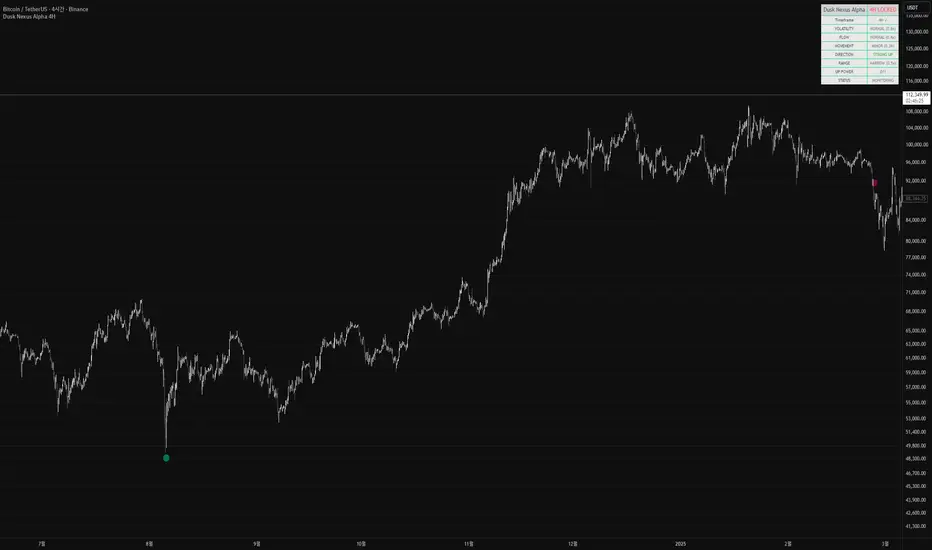
Dusk Nexus Alpha 4HDusk Nexus Alpha 4H (After Dark Main)
개요
기반 기술: 시장 에너지 폭발 감지 시스템
최적 시간대: 4시간봉 전용
신호 특성: 극희귀, 고품질
용도: 큰 움직임 초기 포착
테이블 설명
DUSK NEXUS ALPHA 4H | 4H LOCKED
├─ Timeframe: 4H 시간대 확인
├─ VOLATILITY: 변동성 폭발 상태 (Critical/High/Normal)
├─ FLOW: 거래량 급증 상태 (Surge/High/Normal)
├─ MOVEMENT: 가격 변화 크기 (Major/Minor)
├─ DIRECTION: 강한 방향성 확인 (Strong Up/Down/Weak)
├─ RANGE: 가격 범위 비율 (Wide/Narrow)
├─ UP POWER: 상승 연속성 강도 (숫자/최대값)
└─ STATUS: 최종 넥서스 신호 상태
핵심 개념
시장 내 잠재 에너지가 폭발적으로 방출되는 순간 포착
변동성, 거래량, 가격 움직임의 동시 급증 패턴 분석
연속성 확인을 통해 일시적 노이즈와 진짜 신호 구분
Dusk Nexus Alpha 4H (After Dark Main)
Overview
Core Technology: Market energy explosion detection system
Optimal Timeframe: 4-hour charts exclusively
Signal Characteristics: Extremely rare, high quality
Purpose: Early capture of major movements
Dashboard Explanation
DUSK NEXUS ALPHA 4H | 4H LOCKED
├─ Timeframe: 4H timeframe verification
├─ VOLATILITY: Volatility explosion status (Critical/High/Normal)
├─ FLOW: Volume surge status (Surge/High/Normal)
├─ MOVEMENT: Price change magnitude (Major/Minor)
├─ DIRECTION: Strong directional confirmation (Strong Up/Down/Weak)
├─ RANGE: Price range ratio (Wide/Narrow)
├─ UP POWER: Upward continuity strength (number/maximum value)
└─ STATUS: Final nexus signal status
Core Concept
Capturing moments when latent market energy explosively releases
Analysis of simultaneous surge patterns in volatility, volume, and price movement
Distinguishing between temporary noise and genuine signals through continuity verification
RSI Pivots with Divergence Overlay█ OVERVIEW
The RSI Pivots with Divergence Overlay indicator is an advanced tool based on RSI, displaying dynamic bands on the price chart to simplify the identification of overbought and oversold conditions. Pivot points and divergences between them are derived from these bands, providing a comprehensive view of the market and enabling the creation of various trading strategies based on this single indicator.
█ CONCEPTS
Areas where RSI exits the bands are often reversal points in the market. The concept of this indicator is to highlight places where the probability of a trend reversal increases. Therefore, pivots and divergences have been added to better identify these key moments. Additionally, the bands allow viewing the market context in relation to the RSI indicator, facilitating analysis of momentum and volatility.
█ KEY FEATURES
Dynamic Bands and RSI Signals: The bands are calculated based on the closing price and RSI value, with dynamic scaling adjusted to market volatility. The upper band corresponds to overbought levels, the lower to oversold, and the midline is their average. The price level relative to the bands serves as a visual RSI signal, indicating potential overbought or oversold conditions.
Pivot Points: The indicator identifies local price highs and lows in relation to RSI levels. The pivot level is taken from the high/low of the candle. A high pivot is detected when the high of the candle reaches a local maximum after crossing the upper RSI level (overbought), signaling a potential reversal. A low pivot appears after a local price minimum following a drop below the lower RSI level (oversold), indicating a possible uptrend reversal. The pivot length (default 2 bars) defines the search range for these extremes, meaning that with a length of 2, a potential divergence signal will appear with a 2-candle delay, as this is the minimum time required to confirm a local pivot. Pivot lines are drawn on the chart, and labels display the RSI value (from the close of the candle) and price at the detection moment. Pivot lines disappear after the detection of the next low pivot for lower lines and high pivot for upper lines, but unbreached lines or those with high volume may still serve as support or resistance levels.
Divergence Detection: The indicator automatically detects divergences to predict trend changes. Bearish divergence occurs when the price forms a higher high pivot, but the RSI (from the close of the candle) is lower than in the previous pivot, indicating weakening upward momentum and a potential bearish reversal. Bullish divergence appears when the price forms a lower low pivot, but the RSI is higher, suggesting building momentum and a possible bullish reversal. Divergences are marked in pivot labels (e.g., "Bear Div" or "Bull Div") and supported by alerts upon detection.
Return Signals: The indicator generates buy and sell signals based on RSI (price) returning to the bands after extreme conditions, independently of pivots and divergences. A buy signal is triggered when RSI (price) crosses above the lower level (exiting oversold), suggesting a potential price rise toward the midline or upper band. A sell signal occurs when RSI (price) falls below the upper level (exiting overbought), indicating a possible price drop toward the lower band. Signals are visualized as arrows (up/down triangles) on the chart, with customizable colors.
█ CONFIGURATION
The indicator offers extensive customization options:
RSI Length (rsiLength): Sets the number of periods used to calculate RSI (default 14).
RSI Upper Level (rsiUpper): Defines the overbought threshold (default 70).
RSI Lower Level (rsiLower): Defines the oversold threshold (default 30).
Band Scaling (scale): Determines the scaling multiplier for bands based on market volatility (default 15.0).
SMA Length for Candle Midpoint (length): Number of periods for calculating the moving average of candle midpoints (default 200). This parameter is used to smooth price data, enabling more accurate volatility assessment and band width adjustment to market dynamics.
Pivot Length (pivotLength): Sets the range (in bars) for detecting local price extremes (default 2).
Pivot Label Offset (pivotLabelOffset): Multiplier for the candle range to position pivot labels (default 0.3).
Show Bands (showBands): Enables/disables the display of bands on the chart.
Show Fill (showFill): Enables/disables the fill between bands and the midline.
Show Pivot Lines (showPivotLines): Enables/disables pivot lines on the chart.
Show Pivot Labels (showPivotLabels): Enables/disables labels with RSI and price values at pivots.
Show Return Signals (showReturnSignals): Enables/disables the display of buy and sell signals.
Colors and Style: Customizable colors for bands, fills, pivot lines, labels, and line widths (default 1).
█ USAGE
The indicator performs best when combined with other technical analysis tools, such as Fibonacci levels, moving averages, or trendlines, to confirm pivot, divergence, and return signals. It enables traders to identify key reversal points, detect hidden trend weaknesses through divergences, and confirm trade entries with return signals.
Usage Examples:
Price bounces off a previous pivot with high volume – this increases the probability of a trend change or correction.
A similar situation when RSI is outside the bands strengthens the signal.
If divergence occurs in addition, we have further confirmation.
This can be combined with Fibonacci levels to check if Fibo zones overlap with pivot lines – this may increase the chance of a strong price reaction.
█ ALERTS
The indicator supports alerts for:
Buy and sell signals (RSI returning to bands).
Detection of bearish and bullish divergences.

Wyckoff Smart Money Pro [MTF]Wyckoff Smart Money Pro detects trading ranges, phases, and events from the Wyckoff method and confirms them with VSA (Volume Spread Analysis), divergence checks, and a composite “smart money” strength index. It generates optional buy/sell signals only when multiple conditions align (phase, VSA, CO strength, effort vs. result, time/volume filters). The dashboard, POC/Value Area, and MTF backdrop help you manage context and risk in real time.
What this indicator does
Wyckoff Smart Money Pro is a multi-timeframe Wyckoff tool that:
⦁ Finds accumulation/distribution ranges and tracks Phases A–E.
⦁ Labels Wyckoff events (PS, SC, AR, ST, Spring/Test, SOS, LPS, UTAD, SOW, LPSY, TS…) and VSA patterns (No Demand/Supply, Stopping Volume, Upthrust, etc.).
⦁ Computes a Composite Operator (CO) Strength score from price/volume behavior to approximate “smart money” bias.
⦁ Adds divergence, effort vs. result, and a volume profile (POC & 70% value area) inside the detected range.
⦁ Provides buy/sell signals only when a configurable confluence is present (events + VSA + CO + EVR + phase + filters).
⦁ Supports MTF context (with a safe HTF resolver and fallbacks) and an Info Dashboard to summarize the current state.
It is designed to make the Wyckoff workflow visual and rules-based without promising results or automating decisions.
How it works (methods & calculations)
1) Range & Phase model
⦁ A sliding lookback searches for a valid range (recent highest high/lowest low), requiring width within 2–10× ATR(14) and a minimum bar count inside the bounds.
⦁ Once a range is active, the script derives Creek/Ice/Mid/Quartiles and classifies bars into Wyckoff Phases A–E using event recency (barssince) and where price sits relative to the range.
⦁ The background color reflects the current Phase; optional MTF events (from the chosen HTF) tint the background lightly for higher-timeframe context.
2) Wyckoff & VSA event engine
⦁ Events include PS, SC, AR, ST, Spring, Test, SOS, LPS, PSY, BC, UTAD, SOW, LPSY, TS, plus minor/multiple variants and Creek/Ice jumps.
⦁ VSA patterns detect No Demand/No Supply, Stopping Volume, Buying/Selling Climax, Upthrust/Pseudo Upthrust, Bag Holding, Shake-Out, Volume Dry-Up, etc., from spread vs. average spread and volume vs. average volume with tunable thresholds.
3) Smart-money (CO) Strength
⦁ CO Strength (0–100) blends: relative volume on up/down bars, professional accumulation/distribution, no-supply/no-demand, stopping volume, Springs/UTADs and Tests, SOS/SOW, price’s position inside the range, and volume-delta vs. its MA.
⦁ Persistent accumCount / distCount counters smooth temporary noise.
4) Divergence & Effort-vs-Result
⦁ Price vs. cum volume-delta divergence highlights weakening pushes.
⦁ EVR flags “High effort / no result” and potential Bullish/Bearish reversals, or “Low effort / high result” moves that are often unsustainable.
5) Volume Profile (inside range)
⦁ A 50-bin profile accumulates volume across the detected range to derive POC, VAH/VAL (70% value area). Lines update as the active range evolves.
6) Multi-Timeframe (MTF) safety
⦁ getHTF() converts your multiplier to a valid Pine timeframe string (e.g., 60, 240, 2D, 1W), and the script falls back to current timeframe values if an HTF request returns na.
⦁ If you enter a Custom HTF, it must be strictly higher than the chart’s timeframe (validated at runtime).
7) Signals & risk model
⦁ Signals are not tied to any single pattern. A buy may require Spring/Test/Shake-out/Creek Jump or SOS plus confirmation (VSA, CO>60, Phase C/D, divergence/EVR context).
⦁ Sell is symmetrical (UTAD/Failed Spring/SOW/Ice Jump + VSA + CO<40 + Phase C/D).
⦁ Minimum confidence is configurable; SL/TP and R:R lines are drawn from range edges or recent bar extremes.
⦁ Filters: trading hours, weekend avoidance, and a minimum volume threshold (relative to average) are available to suppress low-quality contexts.
⦁ Alerts include all major events, divergences, structure/phase changes, and the gated Buy/Sell signals (with a cooldown to reduce alert spam).
Inputs (key ones you’ll actually use)
⦁ Display Settings: toggle ranges, phases, events, VSA, signals, dashboard.
⦁ MTF: Enable HTF, set Multiplier or a Custom HTF (must be higher than current).
⦁ Range Detection: period / min bars / pivot strength.
⦁ VSA: volume sensitivity & climax multiplier.
⦁ Signal Settings: minimum confidence, risk/reward labels.
⦁ Advanced Filters: trading hours, weekend avoidance, and Min Volume Filter (× avg).
⦁ Colors: phase backgrounds, structure colors, and line styling.
How to use (practical flow)
1. Choose a symbol & timeframe you normally analyze (e.g., 5–60m for entries, 4H/D for context).
2. If using MTF, pick a multiplier (e.g., 5×) or a Custom HTF (e.g., 240/4H).
3. Wait for a range to form; watch Phase and CO Strength on the Dashboard.
4. When events (e.g., Spring/Test in Phase C or UTAD in distribution) appear with favorable VSA, CO, EVR, and volume/time filters, consider the signal and review R:R lines.
5. Use POC/VA and Creek/Ice/Mid as structure references; manage risk around the range edge that generated the setup.
On-chart legend (what the letters mean)
Wyckoff events (labels)
⦁ PS Preliminary Support, SC Selling Climax, AR Automatic Rally, ST Secondary Test
⦁ Spring Spring; Test Test of Spring
⦁ SOS Sign of Strength; LPS Last Point of Support
⦁ PSY Preliminary Supply, BC Buying Climax
⦁ UTAD Upthrust After Distribution; SOW Sign of Weakness; LPSY Last Point of Supply
⦁ TS Terminal Shakeout; MS Multiple Spring
⦁ CJ Creek Jump; IJ Ice Jump
⦁ mSOS / mSOW Minor Sign of Strength/Weakness
VSA patterns (tiny labels)
⦁ ND No Demand, NS No Supply, SV Stopping Volume, BC/SC Buying/Selling Climax
⦁ PA/PD Professional Accumulation/Distribution, BH Bag Holding, DU Volume Dry-Up
⦁ SO Shake-Out, TS Test for Supply (VSA test), UT Upthrust, PUT Pseudo Upthrust
Other visuals
⦁ Range box with Creek (upper third), Ice (lower third), Mid, Quartiles
⦁ POC/VAH/VAL: yellow solid (POC), purple dotted (value area)
⦁ VWAP and Dynamic S/R (stepline)
⦁ Green/Red triangles: gated Buy/Sell signals (only if min confidence & filters are met)
⦁ Risk label near the triangle: confidence /10 and R:R
Alerts included
⦁ Core events (Spring/Test/UTAD/SOS/SOW/TS), secondary events (SC/AR/BC/LPS/LPSY), VSA patterns, EVR states, Hidden Accumulation/Distribution, HTF events, Divergences, Phase/Structure changes, and the constrained Buy/Sell signals with a cooldown.
Notes, limits & best practices
⦁ This is not a buy/sell system; it’s a context & confirmation tool. Combine with your plan, risk limits, and execution criteria.
⦁ Long, illiquid, or news-driven bars can distort volume/spread logic; filters help but cannot eliminate this.
⦁ For MTF, if an exchange doesn’t support a specific HTF, the script falls back safely to current TF values to avoid na-propagation.
⦁ Dashboard rows/size/position are user-configurable to keep charts uncluttered.
Changelog (what’s new in this version)
⦁ MTF safety & validation (Custom HTF must be above current; graceful fallbacks for request.security() na results).
⦁ Performance caching for close position & up/down bar flags; drawing cleanup to stay under label/line limits.
⦁ Volume Profile upgraded to 50 bins; VA algorithm adjusted accordingly.
⦁ Signal gating with time/day/volume filters and alert cooldown to reduce noise.
⦁ Bug guards for parameter conflicts (e.g., rangeMinBars cannot exceed rangePeriod).
Disclaimer
This script is for educational and research purposes only and does not constitute financial advice or a recommendation to buy or sell any asset. Market risk is real; always test on a demo and trade at your own discretion.
