Volume Spread Analysis [AlgoAlpha]Unleash the power of Volume Spread Analysis (VSA) with our state-of-the-art indicator designed to detect market divergences and convergences, helping you make informed trading decisions. 📈
Key Features:
Detects bullish and bearish divergences based on volume and price movements. 📊🔍
Identifies bullish and bearish convergences, signaling potential trend continuations or reversals. 🔄📉
Customizable parameters for period length, volume SMA period, and outlier reduction factor. ⚙️🔧
Visual highlights for detected effects, with color-coded boxes and labels. 🟩🟥
Provides alerts for divergences and convergences, keeping you updated on market conditions. 🔔📬
📚 Introduction to Volume Spread Analysis (VSA) :
Volume Spread Analysis is a method used to interpret the relationship between volume and price to identify the intentions of market participants. By analyzing the spread (range) of a price bar and its corresponding volume, VSA helps traders discern market strength and potential reversals.
In VSA, harmony occurs when price and volume move in sync, such as when increasing prices(aka "Effect" in the script) are accompanied by increasing volume. This indicates a strong and healthy trend. Conversely, divergence happens when price and volume move in opposite directions. For example, if prices are rising lesser but volume is still high, it may signal a weakening trend and a potential reversal. Identifying these patterns helps traders understand market dynamics and make more informed trading decisions.
🛠 Quick Guide to Using the Volume Spread Analysis Indicator
⭐ Add the Indicator: Add the indicator to favorites by pressing the star icon. Customize settings such as period length, volume SMA period, and outlier reduction factor to fit your trading style.
📊 Market Analysis: Watch for color-coded boxes indicating effects and labels showing effort values. Look for divergences and convergences to identify potential trading opportunities. A higher work done suggests that the markets are needing to work harder to move the price and users can use that information as displayed below each trend impulse box to analyze the likely hood of trend continuation/reversals.
🔔 Alerts: Enable alerts for divergences and convergences to stay informed of critical market conditions without constant chart monitoring.
🔍 How It Works:
Our indicator meticulously analyzes volume and price data to detect significant market movements. It identifies periods where volume is above or below a moving average, marks these points, and tracks the price effect over a user-defined range. By calculating the effort (volume) and effect (price movement), it distinguishes between divergences and convergences based on predefined conditions. Bullish and bearish conditions are visually represented with color-coded boxes and labels, making it easy to spot trading opportunities. Alerts can be set to notify you of critical market conditions, ensuring you never miss a potential trade setup.
Happy trading! 📈🚀
Search in scripts for "Volume"

Volumetric Volatility Blocks [UAlgo]The Volumetric Volatility Blocks indicator is designed to identify significant volatility blocks based on price and volume data. It utilizes a combination of the Average True Range (ATR) and Simple Moving Average (SMA) to determine the volatility level and identify periods of heightened market activity. The indicator highlights these volatility blocks, providing traders with visual cues for potential trading opportunities. It differentiates between bullish and bearish volatility by analyzing price movement and volume, offering a nuanced view of market sentiment. This tool is particularly useful for traders looking to capitalize on periods of high volatility and momentum shifts.
🔶 Key Features
Volatility Measurement Length: Controls the period used to calculate the ATR.
Smooth Length of Volatility: Defines the period for the SMA used to smooth the ATR.
Multiplier of SMA: Sets the minimum threshold for the ATR to be considered a "high volatility" block.
Show Last X Volatility Blocks: Determines how many of the most recent volatility blocks are displayed on the chart.
Mitigation Method: Choose between "Close" or "Wick" price to filter volatility blocks based on price action. This helps avoid highlighting blocks broken by the chosen price level.
Volume Info: Displaying the volume associated with each block.
Up/Down Block Color: Sets the color for bullish and bearish volatility blocks.
🔶 Usage
The Volumetric Volatility Blocks indicator visually represents periods of high volatility with blocks on the chart. Green blocks indicate bullish volatility, while red blocks indicate bearish volatility.
Bullish Volatility Blocks: When the ATR surpasses the smoothed ATR multiplied by the set multiplier, and the price closes higher than it opened, a bullish block is formed. These blocks are generally used to identify potential buying opportunities as they indicate upward momentum.
Bearish Volatility Blocks: Conversely, bearish blocks form under the same conditions, but when the price closes lower than it opened. These blocks can signal potential selling opportunities as they highlight downward momentum.
Volume Information: Each block can display volume data, providing insight into the strength of the market movement. The percentage shown on the block indicates the relative volume contribution of that block, helping traders assess the significance of the volatility.
The volume percentages in the Volumetric Volatility Blocks indicator are calculated based on the total volume of the most recent volatility blocks. For each of the most recent volatility blocks, the percentage of the total volume is calculated by dividing the block's volume by the total volume:
🔶 Disclaimer
Use with Caution: This indicator is provided for educational and informational purposes only and should not be considered as financial advice. Users should exercise caution and perform their own analysis before making trading decisions based on the indicator's signals.
Not Financial Advice: The information provided by this indicator does not constitute financial advice, and the creator (UAlgo) shall not be held responsible for any trading losses incurred as a result of using this indicator.
Backtesting Recommended: Traders are encouraged to backtest the indicator thoroughly on historical data before using it in live trading to assess its performance and suitability for their trading strategies.
Risk Management: Trading involves inherent risks, and users should implement proper risk management strategies, including but not limited to stop-loss orders and position sizing, to mitigate potential losses.
No Guarantees: The accuracy and reliability of the indicator's signals cannot be guaranteed, as they are based on historical price data and past performance may not be indicative of future results.

Enhanced Cumulative Volume Delta [NariCapitalTrading]Enhanced Cumulative Volume Delta (eCVD) Technical Guide
Introduction
The Enhanced Cumulative Volume Delta (eCVD) is a technical indicator in trading that measures the cumulative difference between buying and selling volume over a user-defined period. It helps in understanding market sentiment by showing whether buyers or sellers dominate.
Calculation
Inputs
Period : Number of bars for cumulative volume calculation (default: 14).
MA Period : Period for the moving average of eCVD (default: 20).
Volume Delta Calculation
Buying Volume (buyVolChange) : Counted as buying volume if the current close is greater than the previous.
Selling Volume (sellVolChange) : Counted as selling volume if the current close is less than the previous.
Cumulative Volume Delta (CVD)
Cumulative buying ( cumBuyVol ) and selling volumes ( cumSellVol ) are calculated.
Every period bars, these cumulative volumes are reset.
eCVD is the difference between cumulative buying and selling volumes.
CVD Moving Average
Simple Moving Average (SMA) of eCVD calculated over maPeriod .
Interpretation
eCVD Histogram
Plotted as a histogram.
Color Coding :
Green : Positive eCVD (more buying volume).
Red : Negative eCVD (more selling volume).
Black : No significant difference between buying and selling volume.
CVD Moving Average
Moving average line (yellow) indicates eCVD trend direction and strength.
Application
Trend Confirmation : Rising eCVD suggests an uptrend; falling eCVD suggests a downtrend.
Divergence : Opposite movements in price and eCVD can indicate potential reversals.
Volume Analysis : High eCVD values signal high trading activity, significant at market extremes.
Conclusion
The eCVD can be used to analyze buyer/seller dynamics through volume. It should be used alongside other methods for informed trading decisions.

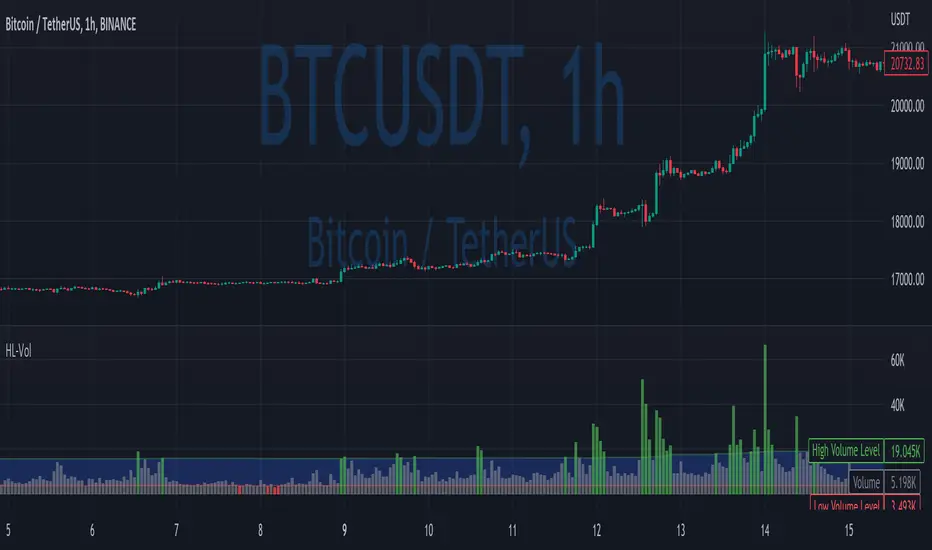
High/Low VolumeIn this indicator, I show you a better way to define high/low values of volume (or any other indicator).
Quite often, I get requests from my clients that an indicator level should be “high” or that it should be above a certain absolute level.
The first request is hard to interpret mathematically, but traders can easily spot it on the chart. The second one is not flexible, and it might not make sense in another market regime.
To solve that, you can compute dynamic high/low levels that represent unexpected extreme values that are adaptable to recent conditions.
There are two pretty simple methods I’m using quite often in my scripts percentiles and sigma (standard deviations).
Percentile looks back at X bars and computes the value under which a certain % of data points are located. So, for example, if we’re computing 90%tile and we’re looking at 100 bars, we’ll get a value under which we have values of precisely 90 bars for this indicator. It’s a good idea to use something like 5%tile for low level and 95%tile for high level.
Sigma(σ) is related to standard deviation. If we assume that our data is normally distributed, then 68% of data points should be in the range of mean +-1σ, 95% → mean +-2σ. So we can assume that something above 2σ is a pretty rare and extreme event.
In this script, I give you an example of how to compute both on volume, but you can easily change this to another indicator.
The issue with volume is that it’s not normally distributed, and your low level will be quite often too low to detect any low levels. Ideally, we have to use a more sophisticated formula that fits volume distribution better.
In this indicator, you can set the following parameters:
Choose type: Percentile or Sigma
Lookback Period
High/Low Percentiles
Sigmas #
You can also receive alerts for high/low volume events.
Disclaimer
Please remember that past performance may not indicate future results.
Due to various factors, including changing market conditions, the strategy may no longer perform as well as in historical backtesting.
This post and the script don’t provide any financial advice.
Adaptive Window Volume ProfileThe indicator builds a rolling volume profile over a chosen time window (1, 3, 12 months or lower), finds POC, VAH/VAL, RH/RL, HVN/LVN, and then overlays volume-driven bar colors (climax, initiative, absorption) filtered by a 30-day RVWAP trend, so you can see where big volume traded and who is winning there right now.
Example Use Case:
How to use it on 4H with 3-month and 12-month rolling profiles:
On a 4H chart, you run two copies of the indicator, both in Rolling Lookback mode, both using the Full (Overlap) engine:
Instance A – 12-month rolling profile (macro map):
-Rolling Unit: Months
-Rolling Length: 12
This gives you the 1-year composite:
-12M RH / RL → outer range of where almost all yearly volume traded (macro high/low “rails”).
-12M VAH / VAL → yearly value area: where the market has been comfortable doing business over the last year.
-12M POC → the single most traded price of the last 12 months (macro gravity).
-12M HVNs/LVNs → long-term shelves (acceptance) and gaps (knife-edges).
Use this instance to answer:
Where are we in the last year’s distribution, and are we approaching macro extremes or living in fair value?
-Combine it with the 30-day RVWAP regime the script computes:
-Above RVWAP and RVWAP rising → macro bull tilt.
-Below RVWAP and RVWAP falling → macro bear tilt.
For example:
-Price near 12M RL with RVWAP bull → potential deep-discount accumulation zone.
-Price near 12M RH with RVWAP bear → potential exhaustion / distribution zone.
Instance B – 3-month rolling profile (tactical map)
-Rolling Unit: Months
-Rolling Length: 3
This builds a 3-month composite on top of your 4H chart:
-3M RH / RL → extremes of the current quarter’s trading.
-3M VAH / VAL → current “fair value box” for the last 90-ish days.
-3M POC → where recent volume concentrates most heavily.
-3M HVNs/LVNs → fresh shelves and gaps inside the bigger yearly structure.
You use this instance for actual trade locations and management:
-Pullbacks into 3M VAL / RL that still sit inside the 12M value and in a bull RVWAP regime → high-probability dip-buy zones; you then look for bull initiative/absorption bar colors to confirm entry.
-Rallies into 3M VAH / RH that line up near 12M VAH / RH in a bear RVWAP regime → good areas to look for shorts, especially when you see bear climax/initiative bars there.
-3M LVNs that coincide with 12M LVNs or VA edges act as sharp decision points: acceptance through often means expansion; rejection often means reversal.
How it all fits together
On your 4H chart, with both instances active:
-12M profile = macro context and big terrain (where the yearly battlefield is).
-3M profile = tactical zones (where to actually trade inside that terrain).
-Bar colors (climax / initiative / absorption) filtered by 30-day RVWAP = timing + confirmation at those levels, favoring the side that has trend and effort behind it.
So the indicator, used this way, becomes:
-one instance to tell you where the big war is being fought (12M)
-one instance to tell you where the current campaign inside that war is concentrated (3M)
-bar colors to tell you whether the team you want to back is actually showing up with size when price hits those levels.

Advanced Weis Wave Volume [Afnan]Advanced Weis Wave Volume is an enhanced upgrade of the classic Weis Wave concept. It measures accumulated volume within price swings to show where buying and selling pressure truly shift — but with one major edge: optional consolidation detection.
Most wave volume indicators simply plot bullish and bearish waves. Advanced Weis Wave Volume goes further by giving you the choice to highlight sideways or low-momentum consolidation phases, making it easy to spot when the market lacks real momentum. This helps traders instantly filter out weak, low-probability setups and focus only on the high-energy waves that truly matter.
⚙️ Key Features
Weis Wave Method – Uses ATR-based wave calculation to identify directional volume accumulation with precision.
Optional Consolidation Highlighting – You control it. Enable or disable consolidation detection based on your trading style. When enabled, it visually marks low-momentum or range-bound conditions, helping you instantly recognize when the market is consolidating.
Smart Volume Alignment – Choose to include or exclude the reversal candle's volume in new waves for more accurate readings.
Clear Visuals – Color-coded waves for Bullish (Green), Bearish (Red), and optional Consolidation (Orange) phases.
Compact Status Table – Displays the current market condition (Bullish, Bearish, or Consolidation) directly on your chart.
Flexible Display Options – Plot all waves above zero line, customize colors, and control what information you see.
💡 Why This Indicator Is Superior
✅ vs. Other Wave Volume Indicators:
Others only show waves; they can't identify consolidation. Advanced Weis Wave Volume gives you the option to enable consolidation detection — saving you time by automatically filtering weak market phases when you need it.
✅ vs. Standard Volume Bars:
Regular volume bars show isolated candle data. Advanced Weis Wave Volume shows accumulated directional pressure, revealing true trend strength and institutional activity.
✅ vs. Basic Weis Wave Indicators:
Standard Weis Wave indicators lack consolidation awareness. This indicator adds that layer of intelligence while keeping the classic wave calculation intact.
Bottom Line:
This is the only Weis Wave volume indicator that gives you control over consolidation filtering. Others show every move equally — Advanced Weis Wave Volume shows what actually matters, when you want it to.
📈 How to Use
Trading with the Waves:
🟢 Green Waves (Bullish): Building buying pressure — look for long setups.
🔴 Red Waves (Bearish): Rising selling pressure
🟠 Orange Zones (Consolidation): (When enabled) Market is ranging — avoid new trades .
Large waves: Strong trends and high-probability continuations.
Shrinking waves: Weakening momentum or possible reversal ahead.
Critical Insight - Avoiding False Volume Signals:
Large waves aren't always reliable. If you see a wave colored in orange (consolidation), it means the market was moving sideways but no real directional momentum.
This is crucial because:
❌ A big green wave in consolidation ≠ strong upside buying
❌ A big red wave in consolidation ≠ strong downside selling
✅ These are just range-bound volume accumulations that mislead traders
With consolidation detection enabled, you can instantly identify and ignore these deceptive Consolidation waves, focusing only on directional volume that actually reflects true buying or selling pressure. This prevents you from entering trades based on false volume signals during sideways markets.
📌 Practical Applications:
Breakout Confirmation: Real breakouts show expanding volume waves; false breakouts show weak waves or consolidation-marked volume.
Trend Validation: In a healthy trend, waves in the direction of the move are stronger, larger, and show clear directional color (green/red).
Consolidation Avoidance: (When enabled) Orange zones warn you to step aside and preserve capital — even if the wave looks large. Size doesn't matter if momentum is absent.
Filter False Volume: Avoid trading large waves that occur during consolidation — they don't represent genuine directional moves, just sideways accumulation.
Divergence Detection: Price makes new highs/lows, but wave volume shrinks — a sign of exhaustion or reversal.
Analyzing Ranges: During accumulation or distribution, Advanced Weis Wave Volume helps identify how institutional players are participating within the range — revealing when a breakout is likely to occur.
✨ The Competitive Advantage
Many Weis Wave indicators exist on TradingView - they all show volume waves. Only Advanced Weis Wave Volume gives you optional consolidation detection. That single feature transforms wave volume from a pure analysis tool into a flexible trading system that adapts to your style.

Volume Profile AnalysisThe Volume Profile Dashboard is a professional-grade analysis tool built for TradingView. It focuses on displaying a comprehensive volume profile breakdown within a dashboard format directly on the chart. The purpose of this tool is to help traders quickly assess buy versus sell volume dynamics, momentum, and sentiment in order to support informed trading decisions.
Instead of plotting simple bars, this indicator uses a detailed table and visual progress bar to summarize live and historical market activity. By condensing key metrics into a structured format, traders can analyse market behaviour without manually calculating or switching between multiple indicators.
________________________________________
How the Script Works
1. Data Gathering
The script uses lower-timeframe price and volume data to calculate buy volume, sell volume, and total traded volume for the current and previous candles.
2. Volume Allocation
Buy and sell volumes are estimated by looking at the candle’s range (high to low) and how the closing price aligns within that range. The closer the close is to the high, the stronger the buying pressure. The closer the close is to the low, the stronger the selling pressure.
3. Delta and Momentum
o Delta measures the difference between buy and sell volume.
o Volume momentum compares the current candle’s activity to the previous one, showing if interest is rising or fading.
4. Point of Control (POC)
An average of high, low, and close is calculated to give an approximate “point of control” level—an area of balance where buyers and sellers previously agreed on price.
5. Dashboard Visualization
All these calculations are displayed inside a clean dashboard table with separate rows for the current candle, previous candle, and a summary row. Icons, colors, and progress bars make it visually intuitive.
6. On-Chart Progress Indicator
A dynamic horizontal progress bar is plotted on the chart above price, showing the balance between buy and sell volume for the latest activity.
7. Alerts
Built-in alerts trigger when strong buying or selling pressure is detected or when there is a significant spike in total traded volume.
________________________________________
How This Tool Can Be Used
• Intraday Trading: Quickly gauge whether buyers or sellers are in control of the market at any moment.
• Swing Trading: Compare momentum shifts between candles to identify early trend reversals.
• Risk Management: Use delta and sentiment signals to confirm whether to hold or reduce exposure.
• Confirmation: Align the volume profile dashboard with other indicators (such as RSI, MACD, or trendlines) for stronger trading conviction.
________________________________________
Using Mixed Indicators for Decisions
This dashboard alone provides volume insights, but better decisions come when it is combined with other tools:
• Pairing it with an RSI can show whether heavy buying is happening in overbought conditions.
• Combining with a SuperTrend or moving averages can confirm if volume momentum aligns with the price trend.
• Overlaying support/resistance levels can identify whether strong buy/sell signals occur at critical levels.
Mixed indicators prevent relying on one signal alone, reducing false trades.
________________________________________
Importance of This Tool
• Clarity: Condenses complex volume data into a simple, visual format.
• Speed: Traders can react faster with pre-calculated buy/sell percentages.
• Precision: Highlights hidden imbalances that are not obvious from candles alone.
• Professional-grade dashboard: Offers an institutional-style view of market behavior directly within TradingView.
________________________________________
Parameters in the Dashboard Table
• Period: Shows whether the row is for the current or previous candle, along with trend arrows.
• Price Range: The high–low range of the candle.
• Total Volume: The sum of buy and sell activity.
• Buy Volume / Sell Volume: Separated distribution of transactions leaning bullish or bearish.
• Delta: The net difference between buy and sell volumes, highlighting pressure imbalance.
• Buy % / Sell %: The percentage contribution of each side to total volume.
• POC: An average reference level where market consensus was strongest.
• Progress: A graphical bar showing buy vs sell dominance.
• Signal: Simplified output like Strong Buy, Buy, Strong Sell, Sell, Neutral.
• Summary Row: Compares changes between the current and previous candles and gives overall market sentiment.
________________________________________
Stock Market Disclaimer
This tool is for educational and informational purposes only. It does not constitute financial advice, investment advice, or trading recommendations. The stock market and cryptocurrency markets involve high risk. Traders and investors should do their own research and consult licensed financial advisors before making investment decisions. Past performance is not indicative of future results.
________________________________________
Misuse Disclaimer
This script has been developed as per TradingView’s rules and is intended for responsible trading analysis only. Any misuse, redistribution, or modification outside of TradingView’s policies is discouraged. The author and platform are not responsible for financial losses, misinterpretation of signals, or misuse of the code.
________________________________________
Disclaimer
Training & Educational Only — This material and the indicator are provided for educational purposes only. Nothing here is investment advice or a solicitation to buy or sell financial instruments. Past simulated or historical performance does not predict future results. Always perform full back testing and risk management, and consider seeking advice from a qualified financial professional before trading with real capital.
________________________________________

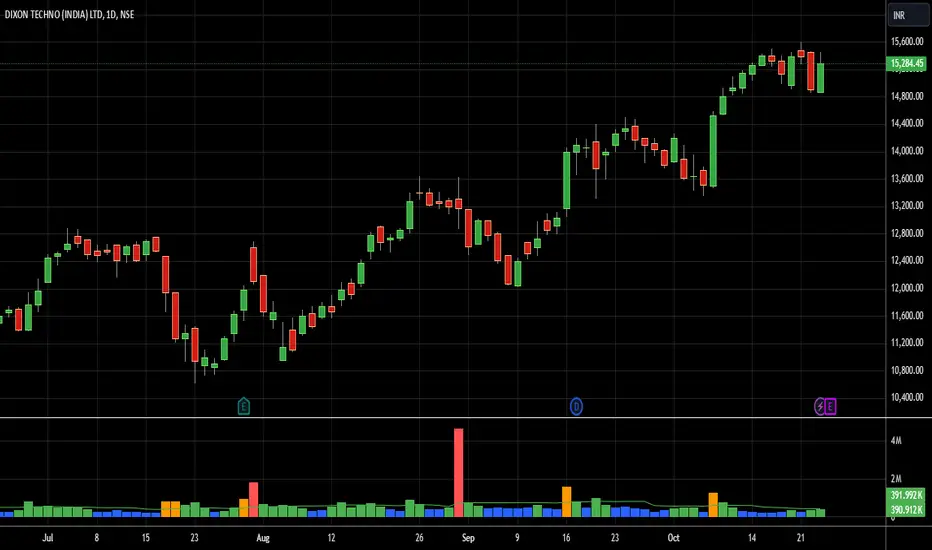
Bharat Jhunjhunwala v2- Volume Color CodingPurpose of the Script
This script is designed for traders in India to visualize and analyze trading volume in the stock market. It colors the volume bars based on how the current trading volume compares to its average over the past 20 periods. This helps traders quickly identify unusual trading activity.
How It Works Step by Step
Setting Up the Indicator
Name & Display: The script is named "Bharat Jhunjhunwala- Volume Color Coding" and it displays below the main stock chart (overlay=false).
Volume Format: It formats the data specifically for volume (format=format.volume).
User Input
Volume Moving Average Period: Users can set how many periods (e.g., days) to consider for calculating the average volume. By default, it's set to 20 periods, and users can adjust this if needed.
Predefined Volume Ratios
The script uses fixed ratios to categorize the current volume:
Ultra High Volume: 3.0 times the average volume.
High Volume: 1.8 times the average volume.
Ultra Low Volume: Between 0.4 and 0.7 times the average volume.
Note: These ratios are hardcoded, meaning users cannot change them.
Calculating the Average Volume
The script calculates the Simple Moving Average (SMA) of the volume over the specified number of periods (default is 20). This average helps determine what "normal" volume looks like.
Determining Volume Levels
Ultra High Volume: If the current volume is 3 times or more the average, it's flagged as ultra high.
High Volume: If the current volume is 1.8 times or more but less than ultra high, it's flagged as high.
Ultra Low Volume: If the current volume is between 0.4 and 0.7 times the average, it's flagged as ultra low.
Normal Volume: Any volume that doesn't fit the above categories is considered normal.
Color Coding the Volume Bars
Based on the volume level determined:
Red: Ultra High Volume
Orange: High Volume
Blue: Ultra Low Volume
Green: Normal Volume
This color coding makes it easy to spot unusual trading activity at a glance.
Plotting on the Chart
Volume Bars: The script plots the actual trading volume as colored bars according to the categories above.
Volume Moving Average Line: It also plots the 20-period moving average of the volume as a green line. This line serves as a reference to compare current volumes against the average.
Why This is Useful
Quick Identification: Traders can instantly see when there's unusually high or low trading activity, which might indicate significant market moves or investor interest.
Trend Analysis: By comparing current volume to the moving average, traders can assess whether the current market behavior is stronger or weaker than usual.
Decision Making: Colored volume bars can help in making informed trading decisions, such as entering or exiting positions based on volume spikes or drops.
Customization
Adjusting the Moving Average: While the volume ratios are fixed, traders can change the number of periods used to calculate the moving average to better fit different trading strategies or time frames.
Summary
This script enhances the standard volume indicator by adding color-coded signals based on predefined volume thresholds relative to a moving average. It's a helpful tool for Indian stock traders to monitor and react to changes in trading volume effectively.
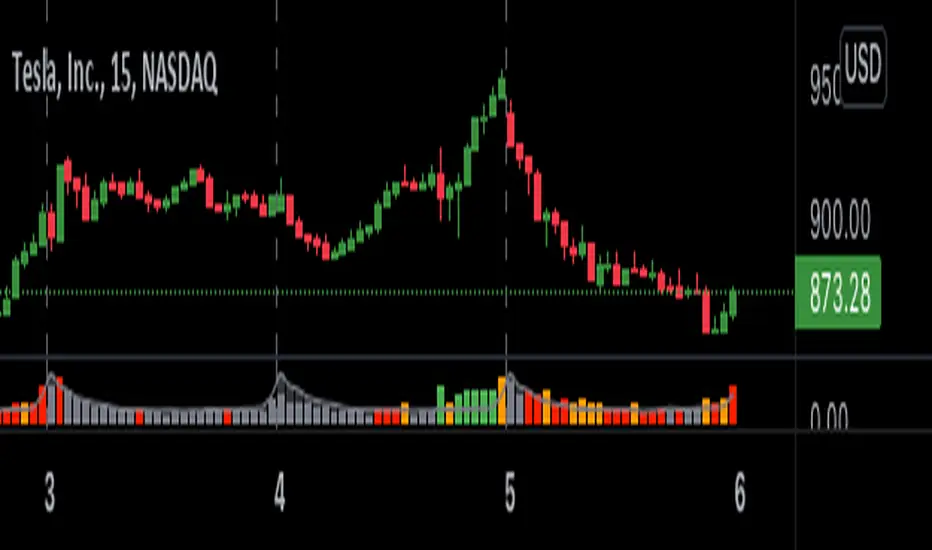
OPINICUS VOLUME DATA - Time Of Day Relative Volume (RVOL)This tool calculates the relative volume (RVOL) based on the normal average volume at that particular time of day.
Relative volume is a powerful piece of information because it offers a gauge as to whether a stock is in play or not. If RVOL is less than 1 it is not in play on this trading day or during this timeframe. If RVOL is above 2, it IS in play and can potentially be traded.
This script allows you to determine if relative volume is average, above average, 2x, or 3x via different color volume bars, at that particular time of day.
There are 2 different settings on this volume indicator.
The first setting is "Gradient." This is the preferred setting, and the one I personally use. Gradient is going to show you different color volume bars based on the RVOL multiple.
The color scheme is as follows:
Gray for average volume
Red if RVOL is between 1.0 and 1.5
Orange if RVOL is between 1.5 and 2
Green if RVOL is between 2.0 and 3.0
Lime green (bright green) if RVOL is greater than 3.
The second setting is "Price." This setting simply shows you the color of the candlestick. This is useful if you find the gradient setting to be too distracting, but still want to see if there is increased relative volume.
There is an alerts setting, which I find to be useful but can also be very distracting. If you leave the "Alert At RVOL %" setting at 0, then alerts will only be triggered if the current candle exceeds the 1.0 (100%) RVOL level. This happens far too frequently, so I prefer to put the alert at 2 or 3. If you change the "Alert At RVOL %" setting then alerts will be triggered if the RVOL percentage (blue number) exceeds your given value. The blue number is a percentage of the average, so if it’s at 1, then it’s 100% of the average.
Note: This tool does not work if you have after-hours or pre-market data displayed. The preferred setting for this tool is the 15' chart, with a 21 day look back period. It is also very useful on the daily chart when doing higher timeframe research.
Price Volume Heatmap [MHA Finverse]Price Volume Heatmap - Advanced Volume Profile Analysis
Unlock the power of institutional-level volume analysis with the Price Volume Heatmap indicator. This sophisticated tool visualizes market structure through volume distribution across price levels, helping you identify key support/resistance zones, high-probability reversal areas, and optimal entry/exit points.
🎯 What Makes This Indicator Unique?
Unlike traditional volume indicators that only show volume over time, this heatmap displays volume distribution across price levels , revealing where the most significant trading activity occurred. The gradient coloring system instantly highlights high-volume nodes (areas of strong interest) and low-volume nodes (potential breakout zones).
📊 Core Features
1. Dynamic Volume Heatmap
- Visualizes volume concentration across 250 customizable price levels
- Gradient color scheme from high volume (white) to low volume (teal/green)
- Adjustable brightness multiplier for enhanced contrast and clarity
- Real-time updates as market conditions evolve
2. Point of Control (POC)
- Automatically identifies the price level with the highest traded volume
- Acts as a magnetic price level where markets often return
- Critical for identifying fair value areas and potential reversal zones
- Customizable line style, width, and color
3. Flexible Lookback Settings
- Lookback Bars: Set any value from 1-5000 bars to control analysis depth
- Visible Range Mode: Analyze only what's currently visible on your chart
- Timeframe-Specific Settings: Different lookback periods for 1m, 5m, 15m, 30m, 1h, Daily, and Weekly charts
- Adapts to your trading style - scalping to position trading
4. Session Separation Analysis
- Tokyo Session: 00:00-09:00 UTC
- London Session: 07:00-16:00 UTC
- New York Session: 13:00-22:00 UTC
- Sydney Session: 21:00-06:00 UTC
- Daily Reset: Analyze each trading day independently
Session separation allows you to understand volume distribution specific to each major trading session, revealing institutional order flow patterns and session-specific support/resistance levels.
5. Profile Width Options
- Dynamic: Profile width adjusts based on lookback period
- Fixed Bars: Set a specific bar count for consistent profile width
- Extend Forward: Project the profile into future bars for planning trades
6. Smart Alerts
- POC crossover/crossunder alerts
- New session start notifications
- Never miss critical price action at high-volume nodes
📈 How to Use This Indicator Professionally
Understanding Market Structure:
High Volume Nodes (HVN):
- Appear as bright/white areas in the heatmap
- Represent price levels where significant trading occurred
- Act as strong support/resistance zones
- Markets often consolidate or bounce from these levels
- Trading Strategy: Look for entries when price tests HVN areas with confluence from other indicators
Low Volume Nodes (LVN):
- Appear as darker/teal areas in the heatmap
- Represent price levels with minimal trading activity
- Price tends to move quickly through these areas
- Often form "gaps" in the volume profile
- Trading Strategy: Expect rapid price movement through LVN zones; avoid placing stop losses here
Point of Control (POC):
- The single most important price level in your analysis window
- Represents the fairest price where maximum volume traded
- Price gravitates toward POC like a magnet
- Trading Strategy:
* When price is above POC: bullish bias, POC acts as support
* When price is below POC: bearish bias, POC acts as resistance
* POC breaks often lead to significant trend changes
Session-Based Analysis:
Use session separation to understand how different market participants trade:
Asian Session (Tokyo/Sydney):
- Typically lower volatility and range-bound
- Volume profiles often show tight, balanced distribution
- Use for identifying overnight ranges and gap fill zones
London Session:
- Highest volume session for forex pairs
- Often shows strong directional bias
- Look for breakouts from Asian ranges during London open
New York Session:
- Maximum participation when overlapping with London
- Institutional order flow most visible
- POC during NY session often becomes key level for following sessions
🎯 Practical Trading Applications
1. Identifying Support & Resistance:
High volume nodes from the heatmap are far more reliable than traditional swing highs/lows. When price approaches an HVN, expect reaction - either a bounce or a significant breakout if breached.
2. Trend Confirmation:
- Healthy uptrend: POC rising over time, HVN forming at higher levels
- Healthy downtrend: POC falling over time, HVN forming at lower levels
- Consolidation: POC relatively flat, volume balanced across range
3. Breakout Trading:
When price breaks through a Low Volume Node with momentum, it often continues to the next High Volume Node. Use LVN areas as measured move targets.
4. Reversal Zones:
Multiple HVN stacking on top of each other creates a "volume shelf" - an extremely strong support/resistance zone where reversals are highly probable.
5. Risk Management:
- Place stops beyond HVN areas (not within LVN zones)
- Size positions based on distance to nearest HVN
- Use POC as trailing stop level in trending markets
⚙️ Recommended Settings
For Day Trading (Scalping/Intraday):
- Lookback: 200-500 bars
- Rows: 200-250
- Enable session separation for your primary trading session
- Profile Width: Dynamic or Fixed Bars (30-50)
For Swing Trading:
- Lookback: 500-1000 bars
- Rows: 250
- Session separation: Daily Reset
- Profile Width: Dynamic
For Position Trading:
- Lookback: 1000-3000 bars
- Rows: 250
- Use timeframe-specific settings
- Profile Width: Extend Forward (20-50 bars)
💡 Pro Tips
1. Combine this indicator with price action analysis - volume confirms what price is telling you
2. Watch for POC convergence with other technical levels (fibonacci, pivot points, moving averages)
3. Volume at extremes (tops/bottoms of heatmap) often indicates exhaustion
4. Session POC from previous sessions often acts as magnet for current session
5. Increase brightness multiplier (1.5-2.5) for clearer visualization on busy charts
6. Use "Number of Sessions to Display" to analyze consistency of volume levels across multiple sessions
🎨 Customization
Fully customizable visual appearance:
- Gradient colors for volume visualization
- POC line thickness, color, and style
- Session line colors and visibility
- All settings organized in intuitive groups
⚠️ Disclaimer
This indicator is a technical analysis tool and should not be used as the sole basis for trading decisions. Always combine volume analysis with proper risk management, fundamental analysis, and other technical indicators. Past performance does not guarantee future results.
---
Support & Updates
Regular updates and improvements are made to enhance functionality. For questions, suggestions, or bug reports, please use the comments section below.
Happy Trading! 📊💹

Volume Sentiment Pro (NTY88)Volume Sentiment Edge: Smart Volume & RSI Trading System
Description:
Unlock the power of volume-driven market psychology combined with precision RSI analysis! This professional-grade indicator identifies high-probability trading opportunities through:
🔥 Key Features
1. Smart Volume Spike Detection
Auto-detects abnormal volume activity with adaptive threshold
Clear spike labels & multi-timeframe confirmation
RSI-Powered Sentiment Analysis
Real-time Bullish/Bearish signals based on RSI extremes
Combined volume-RSI scoring system (Strong Bull/Bear alerts)
2. Professional Dashboard
Instant sentiment status table (bottom-right)
Color-coded momentum strength visualization
Customizable themes for all chart styles
3. Institutional-Grade Tools
HTF (Daily/Weekly) volume confirmation
EMA trend-filtered momentum signals
Spike-to-Threshold ratio monitoring
4. Trade-Ready Alerts
Pre-configured "Bullish Setup" (Spike + Oversold RSI)
"Bearish Setup" (Spike + Overbought RSI)
Why Traders Love This:
✅ Real-Time Visual Alerts - SPIKE markers above bars + table updates
✅ Adaptive Thresholds - Self-adjusting to market volatility
✅ Multi-Timeframe Verification - Avoid false signals with HTF confirmation
✅ Customizable UI - 10+ color settings for perfect chart integration
Usage Scenarios:
Day Traders: Catch volume surges during key sessions
Swing Traders: Confirm reversals with RSI extremes
All Markets: Works equally well on stocks, forex & crypto
Confirmation Tool: Combine with your existing strategy
Sample Setup:
"Enter long when:
5. RED SPIKE label appears
Table shows 'Oversold RSI'
Momentum status turns 'Bullish'
Volume exceeds daily average (Confirmed)"
📈 Try Risk-Free Today!
Perfect for traders who want:
Clean, non-repainting signals
Institutional-level volume analysis
Professional visual feedback
Customizable trading rules
⚠️ Important: Works best on 15m-4h timeframes. Combine with price action for maximum effectiveness.
📜 Legal Disclaimer
By using this indicator, you agree to the following terms:
Not Financial Advice
This tool provides technical analysis only. It does NOT constitute investment advice, financial guidance, or solicitation to trade.
High Risk Warning
Trading financial instruments carries substantial risk. Past performance ≠ future results. Never risk capital you cannot afford to lose.
No Guarantees
Signals are based on historical data and mathematical models. Market conditions may change rapidly, rendering previous patterns ineffective.
User Responsibility
You alone bear 100% responsibility for trading decisions. We expressly disclaim liability for any profit/loss resulting from this tool's use.
Professional Consultation
Always consult a licensed financial advisor before taking positions. This tool should NEVER be used as sole decision-making criteria.
Educational Purpose
This indicator is provided "as is" for informational/educational use only. No representation is made about its accuracy or completeness.
Third-Party Data
We do not verify exchange data accuracy. Use signals at your own discretion after independent verification.

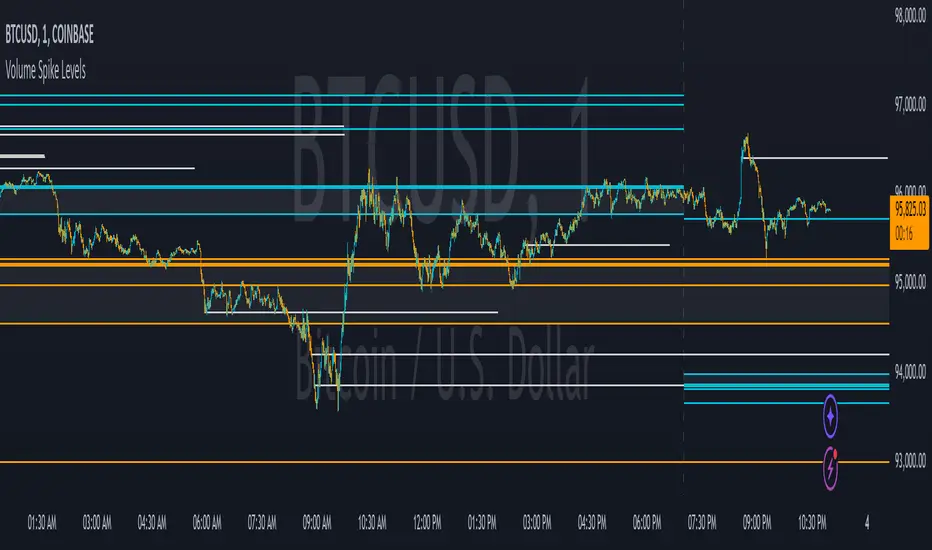
Volume Spike LevelsThis trading indicator finds specific high volume patterns that we have found to be the most likely to act as strong support and resistance levels and plots them on the chart. Using those high probability levels, the indicator will show lines in real time, as well as lines and important zones at the beginning of higher time frames to give you specific levels and areas where price is likely to react.
The most important volume zone for each time frame will have a color fill between the top and bottom lines of that high probability zone so you know to pay extra close attention to that area and look for price reactions there. If you can be patient enough to wait for price to hit these important areas and start to reverse, you will get great entries and help keep yourself from overtrading.
The levels shown can be adjusted to suit your preference, allowing you to get the right amount of levels for your trading strategy, whether that be scalping the 1 minute chart or long term investing via the daily chart.
HOW TO USE
For best results with this indicator, look for 2 types of setups. The first setup is a continuation bounce. You should be looking for these when price has broken out of its recent trading range either to the upside or the downside. When price is extending like this, look to take entries once a volume spike level shows up on the chart and price retraces back to that level. Then take your entry in the same direction as the trend. You can scalp quick wins this way, or you can wait for the next volume spike level to show up and price can’t hold that level any more, then get out. Place your stop loss just beyond the pivot that bounced off of the volume level.
The second type of setup you should look for is a reversal setup. This setup should be used when the market is ranging. Look for the top and bottom of the recent range and find the volume spike levels near the top or bottom of that range and wait for price to reach those levels. Once price hits that level and starts to show a reversal in price, take your entry. You can take quick scalps from those reversals for quick wins, or you can wait for price to reach the next major volume spike level and get out there or just before it. Place your stop loss just beyond the pivot that price made at the volume spike level where you entered your trade.
No matter which setup you are trading, it is never a bad idea to trail your stop loss as price moves towards your take profit level. Whatever volume spike timeframes you are using for your overall trend, you can use a lower time frame volume spike level to give you price points to trail your stop loss to there once price gets supportive at those levels and moves past them.
You should also pay close attention to how price reacts to the important volume zones shown. Many times, price will range inside or near these zones for a while and then form an accumulation just above or below that zone. When this happens, it is likely that price will start to move quickly in the direction that price moved away from that important zone. So when you see the price range inside of these zones and then go just beyond the zone on either side and accumulate, look to trade that breakout of the zone in the same direction that it moved away from the zone.
Note that on lower time frame charts, you will not be able to get some higher time frame levels because Tradingview limits the number of historical bars it can calculate on. So if you are on the 1-5 minute chart, you won’t be able to get yearly or quarterly levels late in the year/quarter due to the number of bars it has to calculate for those levels to populate is beyond the number of allowed bars. You can work around this by manually going to the daily chart and getting the yearly levels and drawing a horizontal line on your chart at the levels shown so that you still have those levels on your lower time frame charts. Unfortunately there is no way for us to work around this with code.
Each setting in the settings panel has a tooltip that will explain that specific setting so you understand how to use it. Just hover your mouse over the “i” icon and it will show a popup with the info. For the non-real time levels, the daily level settings will have the tooltips explaining everything and that info applies to all of the non-real time levels.
MODES
The indicator has two different modes you can use that will affect how the real time levels show up on your chart but will not affect the higher time frame levels. The default mode will give you static horizontal lines only. This means that when a high probability volume spike level comes in, a horizontal line will be drawn and will extend as long as the timeframe that the level is set to. For example a 60 minute volume spike time frame will extend the line for 60 minutes on the chart and then end. These lines will be drawn individually and will not update.
The second mode will give you variable lines and will show a color fill based on where price is in relation to all of the real time levels that are turned on. So if the price is above a level, it will color the background green and if the price is below a level, it will color the background red. This helps identify the trend of price compared to where the high probability volume spike levels came in so you can trade in the direction of the trend. With this mode, the lines for each time frame will update to the new level when a new volume spike for that time frame happens.
ALERTS
The indicator has alerts programmed for each different type of volume spike level that is available to add to your chart. So you can set an alert for when a new volume spike happens on any of the real time volume spike time frames, when price crosses the most recent real time volume spike level for each time frame, alert when any real time volume spike happens, alert when price crosses any of the higher time frame volume levels and also when price has crossed the upper or lower level of any of the important volume zones. Each alert is labeled the same as in the indicator settings so you can easily select which one you want.
For alerts to work properly, you have to have the levels turned on for whatever alerts you use. For example if you want an alert for Realtime 2 Volume Spikes, the Realtime 2 Volume Spike Levels must be turned on and shown on your chart.
Note that when using the alerts for price crossing a level, it will only alert when price crosses the most recent volume spike level. It will not alert when price crosses a previous level of the same time frame.
CUSTOMIZATION
You can customize nearly every feature of this indicator to tailor it to your specific trading style. Some of the customizable features are as follows: turn on or off labels for each time frame, turn on or off the color fills for important volume zones for each time frame, turn on or off the levels for each time frame, adjust the number of previous levels shown for each time frame, change the length of the lines for each time frame, extend the lines right for each time frame, change the color of the lines for each time frame, adjust the color fill colors for important volume zones, adjust the label colors and adjust the label offset length.
We also included some master settings to allow you to control various settings across all time frames with one click. These settings are as follows: turn on or off all labels, turn on or off all realtime levels, remove all lines except the most important volume zone on every time frame, turn on or off all color fills of important zones, adjust the background color fill of the trend coloring when set to variable lines and adjust the background color of all important zones.
There is also a feature that may need to be adjusted when you are looking at charts that do not have a lot of historical data. It will say the index is out of bounds, so look at the index number that the error shows by hovering over the red exclamation point next to the indicator name and adjust the setting labeled “Bar Index Threshold To Fix Errors” to a number that is slightly higher than the index number in the error message. This will fix the error by changing the calculations slightly to adjust for the bar indexes of that specific chart.
MARKETS IT CAN BE USED ON
This indicator can be used on any market that has volume data, including stocks, crypto, futures, forex and more.
TIME FRAMES IT CAN BE USED ON
This indicator has been programmed to work on the following time frames: 15 seconds, 30 seconds, 1 minute, 2 minute, 3 minute, 4 minute, 5 minute, 10 minute, 15 minute, 30 minute, 45 minute, 1 hour, 2 hour, 3 hour, 4 hour, 6 hour, 8 hour, 12 hour, 1 day, 2 day, 3 day, 1 week, 2 week, 1 month, 3 month and 1 year.
If you use a different time frame than shown above, you may get errors or irregular results, so please stick to the time frames that the trading indicator has been programmed to work correctly with.
Follow the Volumes / Path of Least ResistanceThis indicator tracks price movements following significant volume increases. It identifies volume spikes by comparing recent average volume to a longer-term average. After a spike, it monitors price changes over a specified number of bars.
In plain English, the point of this is to “let the market show it’s hand”, vs. other common and preemptive methods of execution.
You can think of it as a better version of a volume up/down indicator which only uses opening and closing prices to identify "bullish" or "bearish" behavior.
To optimize this, I used a very small range chart, hence the small values. You will need to experiment with other values, ESPECIALLY the % change. If you do not do this, the indicator will generate a lot of noise.
The indicator has three main conditions:
1. Significant price increase, bullish: A green triangle appears below the bar.
2. Significant price decrease, bearish: A red triangle appears above the bar.
3. Price change within thresholds: A fuschia triangle appears, pointing up or down based on the overall (short-term) trend. This is common behavior during trends. A spike in volume will appear, and price simply does not budge. Volume/price is essentially declaring a new found value, in which case prices tend to follow the impulse movement (see market profile theory).
The color scheme is intuitive: green for positive moves, red for negative, and fuschia for subtle changes following the existing trend. Blue circles mark volume spikes for reference, which I recommend using only for reference, and disabling to remove unneeded noise.
Because this indicator "lags" in the sense of waiting for the market to show its hand, best opportunities are typically found on retests of the volume spikes themselves. On drives, however, the market will unlikely pullback, which (in my view) is one of its best use cases.
Bottom line, you will need to adjust the parameters to the instrument. This is not a plug and play solution, but far more accurate than those which are.
Settings, and what they mean:
Volume spike average bars: length for identification of high volumes. On smaller timeframes, such as my optimization period, you’ll want several bars. But on something such as a 5 minute or higher, only 1.
Lookback period: for identification of high volumes.
Volume Increase Threshold (%): % which constitutes a jump in volume
Bars After Spike: How long to wait for ensuing price movement. Also sensitive to the timeframe you are using. 1-2 recommended for 5m+, more for smaller range-based.
Negative Price Change Threshold (%): For red arrows (Volume + Price Movement)
Positive Price Change Threshold (%): Inverse of above
WMA Period for Stability Function: When price spikes on high volumes but does not move (price is “trapped” between negative and positive price change thresholds) the indicator marks direction (in fuchsia) in the direction of the underlying trend. This short-term MA identifies that trend.
Finally, because this indicator is volume-based, I recommend using primary instruments only and discourage its use on CFDs or other firm-generated instruments. Just use the primary. I would ignore signals off the open, which is subject to erroneous behavior. Other methods are far more effective for that.
This script is purposely uncomplicated. Feel free to play with settings and change code to suit your needs.

Volume Breakout by Chosen VolumeDescription:
The Volume Breakout indicator (VB) is a technical analysis tool that highlights candles with significant trading volume. It helps traders identify potential breakout periods characterized by high volume activity.
How it Works:
The Volume Breakout indicator compares the volume of each candle with a user-defined minimum volume threshold. If the volume of a candle exceeds or is equal to the specified minimum volume requirement, the indicator identifies it as a volume breakout and marks it accordingly.
Usage:
To effectively utilize the Volume Breakout indicator, follow these steps:
1. Apply the VB indicator to your chart by adding it from the available indicators.
2. Customize the minimum required volume parameter according to your trading preferences. This parameter determines the threshold volume level that a candle must meet or exceed to be considered a breakout candidate.
3. Observe the candles on the chart:
- Candles that meet or exceed the minimum required volume are highlighted with a specific color (yellow by default), indicating potential breakout periods.
4. Pay attention to the volume breakout indications within the candles, as they suggest periods of increased trading activity.
5. Analyze the price action accompanying the volume breakout candles. Breakouts often indicate a surge in buying or selling pressure, potentially leading to significant price moves or trend reversals.
6. Combine the analysis of volume breakout candles with other technical analysis tools, such as trend lines, support and resistance levels, or indicators, to confirm potential trade setups.
7. Implement appropriate risk management strategies, including setting stop-loss orders and position sizing, to manage your trades effectively and protect your capital.
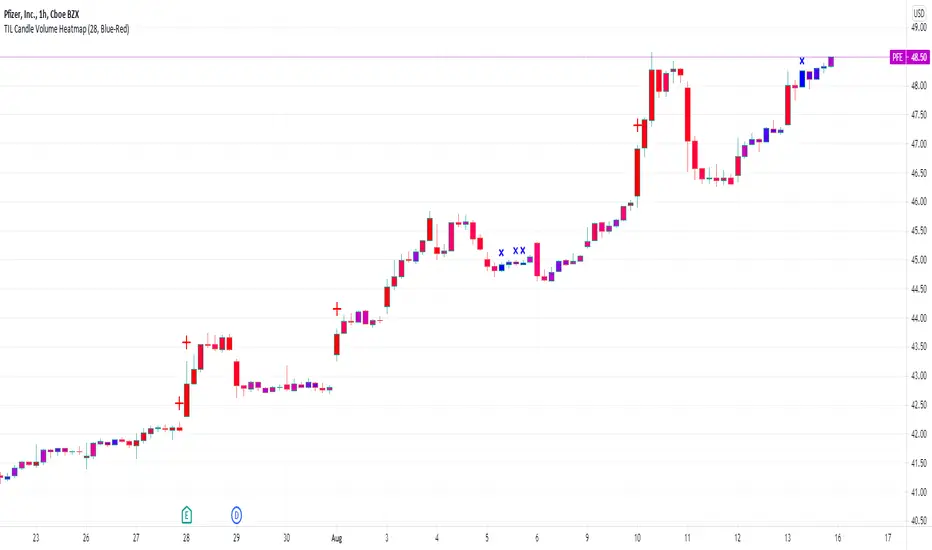
TIL Candle Volume HeatmapTrading Indicator Lab’s Candle Volume Heatmap for TradingView merges volume with price by applying gradient colors in the bars. It can also detect bars that have the most volume and the least volume.
Gradient Coloring
When applied to a chart, the Candle Volume Heatmap indicator applies colors to each bar which may vary according to its number of volume. The chart becomes a heatmap where you can easily spot which parts of the chart that are “hottest” or the bars that had the greatest number of volume and the “coldest” or ones that had the least volume. The indicator uses colors that transitions from BLUE to RED where shades closer to blue are “cold” (low volume) and those that are more in the shade of red are considered “hot” (high volume).
- Blue candlesticks – has low volume
- Red candlesticks – has high volume
High and Low Volume Bars
In addition to bar color changes, the Candle Volume Heatmap indicator also marks bars that have the lowest and highest volume within a certain length. Low and high-volume bars are marked as follows.
- – Low volume bars are marked with a small cross above them signifying a very low volume. Please note that this symbol always appears in new bars which are only starting to accumulate volume.
- – High volume bars are marked with a large plus sign above them signifying a very high volume. These bars along with other red-colored bars are the ones that should be monitored most.
Uses
Identifying low and high-volume bars can be useful in determining whether there is weight or “force” behind the price action that occurs in each bar. High volume bars can be used to validate candlestick reversal patterns and confirm breakouts in support and resistance levels.
Available Alert Conditions
- High Volume – triggers when a high-volume bar (marked with a plus sign) is detected
- Low Volume – triggers when a low-volume bar (marked with a cross sign) is detected
Inputs
- Length – sets the number of bars the indicator analyzes at each execution.
- Color Gradient – sets the color set for applying the heatmap on the chart candlesticks. Choices available are Blue-Red (good for light mode) and Yellow-Red (good for dark mode). Red color always signifies the highest concentration of volume.
- Apply Heatmap Colors – applies the color gradient on the chart candlesticks to indicate the amount of volume in each one
- Display Markers Below – moves the position of the high volume (plus) and low volume (cross) markers below the candlestick
RSI Analytic Volume Matrix [RAVM] Overview
RSI Analytic Volume Matrix is an overlay indicator that turns classic RSI into a multi-layered market-reading engine. Instead of treating RSI 30 and 70 as simple buy/sell lines, RAVM combines RSI geometry (angle and acceleration), statistical volume analysis, and a 5×5 VSA-inspired matrix to describe what is really happening inside each candle.
The script is designed as an educational and analytical tool. It does not generate trading signals. Instead, it helps you read the market context, understand where the pressure is coming from (buyers vs. sellers), and see how price, momentum, and volume interact in real time.
Concept & Philosophy
RAVM is built around a hierarchical logic and a few core ideas:
• Hierarchical State Machine: First, RSI defines a context (where we are in the 0–100 range). Then the geometric engine evaluates the angle-of-turn of RSI using a Z-Score. Only after a meaningful geometric event is detected does the system promote a bar to a potential setup (warning vs. confirmed).
• Geometric Primacy: The angle and acceleration of RSI (RSI geometry) are more important than the raw RSI level itself. RAVM uses a geometric veto: if the geometric trigger is not confirmed, the confidence score is capped below 50%, even if volume looks interesting.
• RSI Beyond 30 and 70: Being above 70 or below 30 is not treated as an automatic overbought/oversold signal. RAVM treats those zones as contextual factors that contribute only a partial portion of the final score, alongside geometry, total volume expansion, buy/sell balance, and delta power.
• Volume Decomposition: Volume is decomposed into total, buy-side, sell-side, and delta components. Each of these is normalized with a Z-Score over a shared statistical window, so RSI geometry and volume live in the same statistical context.
• Educational Scoring Pipeline: RAVM builds a 0–100 "Quantum Score" for each detected setup. The score expresses how strong the story is across four dimensions: geometry (RSI angle-of-turn), total volume expansion, which side is driving that volume (buyers vs. sellers), and the power of delta. The score is designed for learning and weighting, not for mechanical trade entries.
• VSA Matrix Engine: A 5×5 matrix combines momentum states and volume dynamics. Each cell corresponds to an interpreted VSA-style scenario (Absorption, Distribution, No Demand, Stopping Volume, Strong Reversal, etc.), shown both as text and as a heatmap dashboard on the chart.
How RAVM Works
1. RSI Context & Geometry
RAVM starts with a classic RSI, but it does not stop at simple level checks. It computes the velocity and acceleration of RSI and normalizes them via a Z-Score to produce an Angle-of-Turn metric (Z-AoT). This Z-AoT is then mapped into a 0–1 intensity value called MSI (Momentum Shift Intensity).
The script monitors both classic RSI zones (around 30 and 70) and geometric triggers. Entering the lower or upper zone is treated as a contextual event only. A setup becomes "confirmed" when a significant geometric turn is detected (based on Z-AoT thresholds). Otherwise, the bar is at most a warning.
2. Volume & Statistical Engine
The volume engine can work in two modes: a geometric approximation (based on candle structure) or a more precise intrabar mode using up/down volume requests. In both cases, RAVM builds a volume packet consisting of:
• Total volume
• Buy-side volume
• Sell-side volume
• Delta (buy – sell)
Each of these series is normalized using a Z-Score over the same statistical window that is used for RSI geometry. This allows RAVM to answer questions such as: Is total volume exceptional on this bar? Is the expansion mostly coming from buyers or from sellers? Is delta unusually strong or weak compared to recent history?
3. Scoring System (Quantum Score)
For each bar where a setup is active, RAVM computes a 0–100 score intended as an educational confidence measure. The scoring pipeline follows this sequence:
A. RSI Geometry (MSI): Measures the strength of the RSI angle-of-turn via Z-AoT. This has geometric primacy over simple level checks.
B. RSI Zone Context: Being below 30 or above 70 contributes only a partial bonus to the score, reflecting the idea that these zones are context, not automatic signals. Mildly supportive zones (e.g., RSI below 50 for bullish contexts) can also contribute with lower weight.
C. Total Volume Expansion: A normalized Volume Power term expresses how exceptional the total volume is relative to its recent distribution. If there is no meaningful volume expansion, the score remains modest even if RSI geometry looks interesting.
D. Which Side Is Driving the Volume: RAVM then checks whether the expansion is primarily on the buy side or the sell side, using Z-Score statistics for buy and sell volume separately. This stage does not yet rely on delta as a power metric; it simply answers the question: "Is this expansion mostly driven by buyers, sellers, or both?"
E. Delta as Final Power: Only at the final stage does the script bring in delta and its Z-Score as a measure of how one-sided the pressure really is. A strong negative delta during a bullish context, for example, can highlight absorption, while a strong positive delta against a bearish context can highlight distribution or a buying climax.
If a setup is not geometrically confirmed (for example, a simple entry into RSI 30/70 without a strong geometric turn), RAVM caps the final score below 50%. This "Geometric Veto" enforces the idea that RSI geometry must confirm before a scenario can be considered high-confidence.
4. Overlay UI & Smart Labels
RAVM is an overlay indicator: all information is drawn directly on the price chart, not in a separate pane. When a setup is active, a smart label is attached to the bar, together with a vertical connector line. Each label shows:
• Direction of the setup (bullish or bearish)
• Trigger type (classic OS/OB vs. geometric/hidden)
• Status (warning vs. confirmed)
• Quantum Score as a percentage
Confirmed setups use stronger colors and solid connectors, while warnings use softer colors and dotted connectors. The script also manages label placement to avoid overlap, keeping the chart clean and readable.
In addition to labels, a dashboard table is drawn on the chart. It displays the currently active matrix scenario, the dominant bias, a short textual interpretation, the full 5×5 heatmap, and summary metrics such as RSI, MSI, and Volume Power.
RSI Is Not Just 30 and 70
One of the central design decisions in RAVM is to treat RSI 30 and 70 as context, not as fixed buy/sell buttons. Many traders mechanically assume that RSI below 30 means "buy" and RSI above 70 means "sell". RAVM explicitly rejects this simplification.
Instead, the script asks a series of deeper questions: How sharp is the angle-of-turn of RSI right now? Is total volume expanding or contracting? Is that expansion dominated by buyers or sellers? Is delta confirming the move, or is there a hidden absorption or distribution taking place?
In the scoring logic, being in a lower or upper RSI zone contributes only part of the final score. Geometry, volume expansion, the buy/sell split, and delta power all have to align before a high-confidence scenario emerges. This makes RAVM much closer to a structured market-reading tool than a classic overbought/oversold indicator.
Matrix User Manual – Reading the 5×5 Grid
The heart of RAVM is its 5×5 matrix, where the vertical axis represents momentum states (M1–M5) and the horizontal axis represents volume dynamics (V1–V5). Each cell in this grid corresponds to a VSA-style scenario. The dashboard highlights the currently active cell and prints a textual description so you can read the story at a glance.
1. Confirmation Scenarios
These scenarios occur when momentum direction and volume expansion are aligned:
• Bullish Confirmation / Strong Reversal: Momentum is shifting strongly upward (often from a depressed RSI context), and expanded volume is driven mainly by buyers. Often seen as a strong bullish reversal or continuation signal from a VSA perspective.
• Bearish Confirmation / Strong Drop: Momentum is turning decisively downward, and expanded volume is driven mainly by sellers. This maps to strong bearish continuation or sharp reversal patterns.
2. Absorption & Stopping Volume
• Absorption: Total volume expands, but the dominant flow is opposite to the recent price move or the geometric bias. For example, heavy selling volume while the geometric context is bullish. This can indicate smart money quietly absorbing orders from the crowd.
• Stopping Volume: Exceptionally high volume appears near the end of an extended move, while momentum begins to decelerate. Price may still print new extremes, but the effort vs. result relationship signals potential exhaustion and the possibility of a turn.
3. Distribution & Buying Climax
• Distribution: Heavy buying volume appears within a bearish or topping context. Rather than healthy accumulation, this often represents larger players offloading inventory to late buyers. The matrix will typically flag this as a bearish-leaning scenario despite strong upside prints.
• Buying Climax: A surge of buy-side volume near the end of a strong uptrend, with momentum starting to weaken. From a VSA point of view, this is often the last push where retail aggressively buys what smart money is selling.
4. No Demand & No Supply
• No Demand: Price attempts to rise but does so on low, non-expansive volume. The market is not interested in following the move, and the lack of participation often precedes weakness or sideways action.
• No Supply: Price tries to push lower on thin volume. Selling pressure is limited, and the lack of supply can precede stabilization or recovery if buyers step back in.
5. Trend Exhaustion
• Uptrend Exhaustion: Momentum remains nominally bullish, but the quality of volume deteriorates (e.g., more effort, less net result). The matrix marks this as an uptrend losing internal strength, often after a series of aggressive moves.
• Downtrend Exhaustion: Similar logic in the opposite direction: strong prior downtrend, but increasingly inefficient downside progress relative to the volume invested. This can precede accumulation or a relief rally.
6. Effort vs. Result Scenarios
• Bullish Effort, Little Result: Buyers invest notable volume, but price progress is limited. This may reveal hidden selling into strength or a lack of follow-through from the broader market.
• Bearish Effort, Little Result: Sellers push volume, but price does not decline proportionally. This can indicate absorption of selling pressure and potential underlying demand.
7. Neutral, Churn & Thin Markets
• Neutral / Thin Market: Momentum and volume both remain muted. RAVM marks these as neutral cells where aggressive decision-making is usually less attractive and observing the broader structure is more important.
• High Volume Churn / Volatility: Both sides are active with high volume but limited directional progress. This can correspond to battle zones, local ranges, or high volatility rotations where the main message is conflict rather than clear trend.
Inputs & Options
RAVM includes several input groups to adapt the tool to your preferences:
• Localization: Multiple language options for all labels and dashboard text (e.g., English, Farsi, Turkish, Russian).
• RSI Core Settings: RSI length, source, and upper/lower contextual zones (typically around 30 and 70).
• Geometric Engine: Z-AoT sigma thresholds, confirmation ratios, and normalization window multiplier. These control how sensitive the script is to RSI angle-of-turn events.
• Volume Engine: Choice between geometric approximation and intrabar up/down volume, Z-Score thresholds for volume expansion, and related parameters.
• Visual Interface: Toggles for smart labels, dashboard table, font sizes, dashboard position, and color themes for bullish, bearish, and warning states.
Disclaimer
RSI Analytic Volume Matrix is provided for educational and research purposes only. It does not constitute financial advice and is not a signal generator. Any trading decisions you make based on this tool, or any other, are entirely your own responsibility. Always consider your own risk management rules and conduct your own analysis.
