Volume Buy/Sell SplitVisually decompose each bar’s total volume into estimated “buy” and “sell” components, so you can instantly see which side—buyers or sellers—dominated on each candle.
Key Features
Total Volume Base
A solid grey histogram shows the absolute volume on every bar.
Buy vs. Sell Split
Buying Volume is calculated as
```volume × (close – low) / (high – low)```
Selling Volume is calculated as
```volume × (high – close) / (high – low)```
These estimates assume that when price closes near the high, more of that bar’s volume was “aggressive buying,” and vice versa.
Dynamic Stacking
The larger of the two components (buying vs. selling) is plotted directly on top of the grey base, in blue (if buying dominates) or yellow (if selling dominates).
The smaller component is plotted above that, in the complementary color, so the full column still represents total volume.
30‑Bar Average Marker
A thin purple line appears at the 30‑bar simple moving average of volume—but only on bars where volume exceeds that average—helping you spot volume spikes at a glance.
How to Interpret
Tall grey columns = high total volume bars.
Blue‑tinted sections = buying pressure; yellow‑tinted sections = selling pressure.
When the blue (buy) portion is larger, buyers had the upper hand; a larger yellow portion indicates sellers dominated.
Purple markers highlight bars where volume is above its 30‑period average, drawing your eye to unusually active sessions.
Usage Notes
Overlay: false (panel below price)
No external inputs to adjust—plug and play.
Ideal for spotting divergences between price and volume aggression, confirming breakouts, or identifying potential exhaustion moves when one side’s volume spikes.
Add this script to your charts to gain clear, color‑coded insights into buying vs. selling activity on every candle.
Search in scripts for "Volume"

Volume Standard Deviation Alert GusPurpose
The script detects and alerts traders when the volume of a trading asset significantly exceeds a calculated threshold based on the standard deviation of volume over a specified lookback period. It optionally filters these alerts based on whether the price action is bullish or bearish.
Key Components
Inputs
lookback (default: 20)
The number of bars to consider when calculating the moving average and standard deviation of volume.
stdDevFactor (default: 2.0)
The multiplier for the standard deviation to determine the threshold for a volume spike.
alertOnClose (default: true)
Determines whether alerts should only be triggered after the bar has closed.
checkBullBear (default: false)
Enables filtering of alerts based on the bullishness or bearishness of the bar.
Calculations
volSMA
The simple moving average (SMA) of the volume over the lookback period.
volStd
The standard deviation of the volume over the lookback period.
threshold
The alert threshold is calculated as:
Threshold
=
volSMA
+
(
stdDevFactor
×
volStd
)
Threshold=volSMA+(stdDevFactor×volStd)
isBullish & isBearish
Determines whether the current bar is bullish (close > open) or bearish (close < open).
volumeSpikeCondition
A condition that triggers when the current volume exceeds the calculated threshold.
bullishCondition & bearishCondition
Refines the spike condition by requiring the bar to be bullish or bearish when checkBullBear is enabled.
finalCondition
The ultimate alert condition based on the user’s preference for bullish/bearish filtering.
finalTrigger
Ensures the alert only triggers at bar close if alertOnClose is set to true.
Visualization
Plots the SMA of the volume (volSMA) and the threshold line (threshold), helping traders visually understand the conditions.
Histograms the current volume and colors the bars:
Red: Volume exceeds the threshold.
Blue: Volume is below the threshold.
Alerts
The script generates an alert message when the finalTrigger condition is met:
"Bullish Volume Spike!" if the bar is bullish.
"Bearish Volume Spike!" if the bar is bearish.
"High Volume Spike!" if no bull/bear filter is applied.
Alerts are sent using alert() with the message and set to trigger once per bar close.
Usage
Traders can use this script to identify unusual volume activity, which often precedes significant price movements.
Customizability allows traders to tune the lookback period, standard deviation multiplier, and whether to filter for bullish/bearish spikes.
Visual and audible cues help in identifying important market events in real time.
This indicator is particularly useful for spotting market breakouts or breakdowns driven by high trading activity.

Volume TableDisplays a table of volume and short volume.
When chart timeframe is intraday or daily, table will show daily values. If chart is on weekly, table will show weekly values. If chart is on monthly, table will show monthly values.
If a ticker doesn’t have short volume, uncheck “Show Short Volume” in settings for table to work.
Table rows:
Date row (Day/Week/Month) text:
Green when close > open
Red when close < open
White when close equals open
Volume (Vol) row text:
Default: Black
If “Check for inside candles” is checked, when the high and low (or open and close if “Use H/L not O/C” is unchecked) is within the previous time period (day/week/month), text will be white
Volume (Vol) row background:
Default: Gray
Colored based on values and colors set in settings:
>= Very High Volume
>= High Volume
<= Low Volume
<= Very Low Volume
Short Volume (SV) row cell background color:
SV < “Lower Threshold”: Black
“Lower Threshold” <= SV < “Low Threshold”: Gray
“Low Threshold” < SV < First “Short Volume Color Increment”: Silver
“Short Volume Color Increment's (5 million increments by default): purple, blue, teal, green, lime, yellow, orange, red, maroon, white
Short Volume text color is just colored to be visible based on SV cell background.
There are labels that can be displayed to look back at data further back than the table goes (recommend being on the daily timeframe).

Volume PACustom volume histogram that visually represents trading volume in relation to the price action of the current bar. The histogram is colored based on whether the current bar is bullish or bearish, and it greys out when the current volume is lower than the volumes of the previous specified number of bars.
Customizable Bar Count: Users can specify how many previous bars to compare against for determining if the current volume is lower.
Default color-coded histogram:
Green: Indicates a bullish bar (closing price is greater than opening price).
Red: Indicates a bearish bar (closing price is less than opening price).
Grey: Indicates that the current volume is lower than the volumes of the previous specified number of bars.

Volume Analysis Table MTF - Buy vs SellVolume Analysis Table MTF - Buy vs Sell Indicator
Take control of your trading decisions with the Volume Analysis Table MTF - Buy vs Sell indicator for TradingView! This powerful Pine Script code empowers you to analyze volume trends across various timeframes, providing valuable insights into buying and selling pressure within the market.
Unveiling Market Sentiment Through Volume Analysis:
Multi-Timeframe Analysis: Gain a comprehensive understanding of volume activity by examining different timeframes, from 1 minute to 1 month. Identify potential turning points and gauge the strength of trends.
Buy vs Sell Volume Differentiation: Effortlessly distinguish between buying and selling volume. The indicator color-codes the results, highlighting periods dominated by buying or selling pressure with clear visuals.
Customizable Table: Tailor the indicator to your preferences. Choose the number of bars to analyze, select the timeframes you want to display, and position the table conveniently on your chart using the built-in options.
Weekly and Monthly Period Support: Go beyond the traditional daily timeframe. The indicator allows you to incorporate weekly and monthly volume data for a broader market perspective (requires enabling the respective options).
Empower Your Trading with Actionable Insights:
Identify Potential Entry and Exit Points: By analyzing the volume distribution across different timeframes, you can potentially spot opportunities to enter or exit trades based on shifts in buying and selling pressure.
Confirm Trend Strength: Volume analysis can strengthen your existing trend identification strategies. High buying volume during uptrends and high selling volume during downtrends can add confidence to your trading decisions.
Gain a Competitive Edge: Understanding volume dynamics can provide valuable clues about market sentiment and potential turning points. This information can be a crucial advantage in fast-paced trading environments.
The Volume Analysis Table MTF - Buy vs Sell indicator is an indispensable tool for any serious trader utilizing TradingView. Simplify your volume analysis, gain actionable insights, and elevate your trading game!
------------------------------------------------------------------
Türkçe
Volume Analysis Table MTF - Buy vs Sell
Piyasada hakim olan alım-satım gücünü anlamak, başarılı bir yatırım için kritik öneme sahiptir. Volume Analysis Table MTF - Buy vs Sell göstergesi, farklı zaman dilimlerindeki hacim verilerini analiz ederek size bu konuda derinlemesine bir bakış açısı sunar.
Neden Bu Göstergeyi Kullanmalısınız?
Çoklu Zaman Dilimi Analizi: 1 dakikalık grafikten 1 aylık grafiğe kadar farklı zaman dilimlerindeki hacim verilerini tek bir bakışta görerek piyasanın genel eğilimini daha iyi anlayabilirsiniz.
Alım ve Satım Hacimlerini Karşılaştırma: Alım ve satım hacimlerini görsel olarak karşılaştırarak piyasadaki güç dengesini belirleyebilirsiniz.
Potansiyel Dönüm Noktalarını Tespit Etme: Hacimdeki ani değişimler, potansiyel trend değişikliklerine işaret edebilir. Bu gösterge sayesinde bu tür noktaları daha kolay tespit edebilirsiniz.
Tüm Yatırım Düzeyleri İçin Uygun: Hem yeni başlayan hem de deneyimli yatırımcılar bu göstergeden faydalanabilir.
Ana Özellikler:
Çoklu Zaman Dilimi Desteği: 1 dakika, 5 dakika, 15 dakika, 30 dakika, 1 saat, 2 saat, 4 saat, 1 gün, 1 hafta, 1 ay
Özelleştirilebilir Arayüz: Tablo pozisyonu, metin boyutu gibi ayarları kişiselleştirebilirsiniz.
Net ve Anlaşılır Görselleştirme: Alım ve satım hacimleri farklı renklerle gösterilir, böylece kolayca ayırt edilebilirler.

Volume Spectrum - WhvntrThe "Volume Spectrum" by Whvntr has been developed to analyze and visualize trading volume patterns in financial markets, offering traders insights into volume dynamics relative to historical performance. This tool can be particularly useful for identifying periods of unusually high or low trading activity, which are often associated with significant price movements.
Intended Markets and Conditions
The Volume Spectrum indicator is versatile and can be applied across a variety of markets, including stocks, forex, commodities, and cryptocurrencies. It is designed to be relevant in both bullish and bearish markets, as well as in varying volatility conditions. The primary focus is on identifying shifts in trading volume that could indicate potential trading opportunities or risks.
Features and Relevance for Trading
Volume Analysis: The indicator calculates and plots the average volume over a user-defined period (length) and compares it to a shorter-term average volume (avg_length). This comparison helps in identifying trends in trading volume.
Smoothing Options: Users can select from four types of smoothing methods (RMA, SMA, EMA, WMA) to calculate the moving averages, allowing for customization based on trading strategy and personal preference.
High and Low Volume Identification: It highlights periods of high and low volume relative to the average, using customizable color schemes for easy visual identification.
Volume Alerts: The script generates alerts for significant increases or decreases in volume, enabling traders to react promptly to potential trading signals.
Customizability: Traders can adjust various parameters, including volume length, average length, smoothing method, and visual elements like plot colors and background highlights.
Volume Histogram: An optional volume histogram can be displayed, with colors indicating whether the volume is increasing and if the closing price was higher or lower than the opening price.
This indicator can be particularly relevant for traders looking to capitalize on volume-based trading strategies. High volume periods may indicate strong interest in a security at its current price, whereas low volume may suggest a lack of interest. By identifying these conditions, traders can make more informed decisions about entry and exit points.
Disclaimer
The Volume Spectrum indicator, like any analytical tool, should be used as part of a comprehensive trading strategy. It is important to note that past performance is not indicative of future results. Trading involves risk, and the effectiveness of this or any indicator may vary based on market conditions, settings used, and other factors. Traders should exercise caution, do their own research, and consider seeking advice from a financial professional before making trading decisions. This indicator is provided without warranty regarding its accuracy, timeliness, or completeness, and users assume all risks associated with its use.

Volume+This volume indicator uses a long WMA to establish an average volume and calculates the standard deviation based on that average. Each deviation level from 1 to 3 is also plotted with the bar color gradually increasing in intensity when more than one standard deviation is exceeded.

Volume Surge Highlighter by Avinash VRThis indicator displays volume bars with custom colors based on comparison to the moving average of volume.
Red bars highlight high volume (above average), indicating strong market interest.
Grey bars indicate normal volume (below average).
It helps traders visually detect volume surges and potential breakouts or reversals in the market.
Volume Spike 20%+This indicator highlights volume spikes that exceed the 20% threshold above the 20-period simple moving average of volume.
🔹 Gray bars: Normal volume
🔹 Green bars: Volume is at least 20% higher than the 20-period average
🔸 Orange line: The 20-period volume moving average
Use case:
This tool helps traders quickly spot abnormal trading activity or increased interest in a stock, which may precede a price breakout or reversal.
Simple, clean, and effective – perfect for momentum, breakout, or volume-based strategies.

Volume USDTName:
USDT Volume Bars (Directional Colors)
Description:
This indicator visualizes trading volume in USDT by multiplying the candle's volume by the average of its open and close prices. The result reflects a more realistic estimation of the traded value per candle.
🟩 Green bars: Bullish or neutral candles (close ≥ open)
🟥 Red bars: Bearish candles (close < open)
Useful for spotting high-value inflows and outflows based on actual price-weighted volume.

Volume Pulse: Mobile-Optimized Candle Volume Viewer✨ Description ✨
Sleek. Simple. Sexy.
A modern, minimal volume tracker designed for mobile and desktop users who want clean data without clutter.
✅ Displays the volume of the last N candles with intuitive green/red background colors based on candle direction (bullish/bearish).
✅ Automatically converts numbers into K/M/B format for quick understanding.
✅ Comes with a text size setting, so it's fully readable whether you're on a phone or desktop.
Perfect for traders who want to:
Spot volume spikes at a glance
Quickly compare recent candle volumes
Stay mobile-friendly with a visual style that actually fits

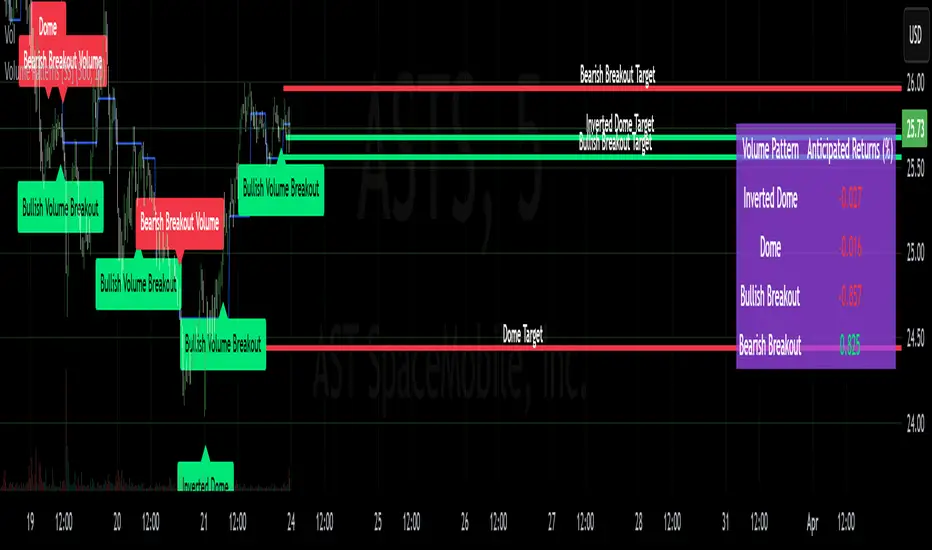
Volume Patterns [SS]Hey everyone,
Been a while since doing anything with Pinescript.
Here is my iteration of a Volume Pattern identification, inspired by Bulkowski's work on patterns and volume.
The indicator aims to identify the 4 major types of volume patterns, these are:
Bullish Breakout Volume
Bearish Breakout Volume
Inverted Domes
Domes
Classification
These patterns are all assigned to a classification based on theory. For example, dome volume is usually bearish, inverted dome is usually bullish, etc. etc. However, in order to accommodate changing sentiments and volatility, I have coded logic into the indicator to assess for the actual sentiment associated with these patterns itself.
The indicator calculates the average return associated with each pattern, scaling the data into a percent return. It then has the ability to re-scale the target using the close price associated with the pattern at the time of pattern signaling, to calculate the target price and plot the target on the chart for you.
Additionally, it provides you with the following:
Labels to signal when a pattern has happened
A table that shows you the average returns associated with the 4 major patterns
Target lines with labels that visually show you the target price associated with the pattern, as well as which pattern they are associated with.
All of these things can be toggled on or off depending on your preference.
Customizing the indicator
In addition to being able to toggle the visuals on or off depending on what you want to see or not see, there are some minor customization abilities in terms of training the indicator to recognize the patterns and predict the TP.
The first one is the Training length
In the settings, you will see "Train", and the default is 500. This is the amount the indicator is looking back in history to learn the patterns and returns associated with them. This 500 is appropriate in most cases and on most timeframes.
Lastly, the Lookforward Length
The look forward length represents the number of bars forward you want to determine the returns for. It is defaulted to 10, but you can modify it.
So, if you are on the 1-Minute chart and have the look forward set to 10, then once a signal happens, the target price is calculated based on 10 minutes from the time of signal. You can increase this or decrease this based on your preference.
Longer look forwards can be good for swingers but should be used on the larger timeframes, shorter are good for scalpers but should be used on the shorter timeframes.
The indicator's use is incredibly simple, you'll pick it up in no time!
Hope you enjoy it and as always, safe trades!
Just an FYI for those who may have questions:
The indicator is open source. This means you are free to take it and modify it as you wish. You do not need to ask me.
Please read the description carefully, as 100% of questions I am asked about indicators are covered in the description. ;-)
Have a good one guys and gals! 🚀🚀🚀
Volume Z-Score Bar ColorA simple script help you identify significant upticks in volume for a particular candle.
Using the standard z-score calculation you can change the bar color based on the user selected standard deviation range.
Calculation
z = (x - μ) / σ, where:
z: is the z-score
x: is the current volume
μ: is the mean volume
σ: is the standard deviation
Options include setting the bottom and top end of the deviation range. This will allow you to see a moderated uptick in volume as well as an extreme uptick. You can also choose the colors for the moderate bull/bear volume and extreme bull/bear volume.

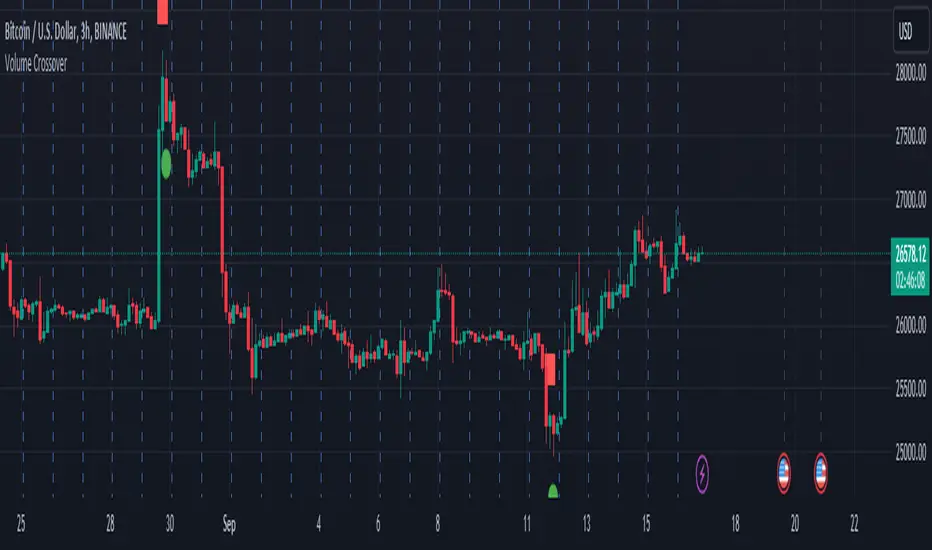
Volume Crossover StrategyThis script shows us the strength and acceleration of the trend, not the direction. ! . The indicator is built on the collision of two volumes (the collision of one-hour and four-hour volumes), where as a result one upward arrow shows us (acceleration, pressing the gas on the pedal), and the downward one shows deceleration (i.e. braking).
Recommendation: Be sure to attach:
a) any trend direction indicator (SMA, EMA), through which we will have an idea where the market is going and going:
b) volatility indicator
c) AD accumulation distribution (let's have a real picture, is there a buying or selling trend)
It is suitable for a one-hour timeframe
P.S. The script does not make any guarantee of profit, it is published only for the purpose of sharing my opinion about this strategy.
an hour ago
Comment:
The green signal is the start of the marathon, and the red signal is the end. For example, if the downward trend has ended (we can see it through the blue signal), it does not mean that the next marathon will necessarily be a reflected trend. It is not excluded that the next marathon will also develop on a downward trend...and therefore in the opposite case as well..
FBMKLCI VolumeVolume for FBMKLCI Malaysia. Note that the volume starts on 27th Oct 2020 due to the change of securities in index. There are 30 securities combined into single volume.

Volume Support/ResistanceAn Indicator which shows the potential resistance/support level at K bar with significant trading volume.
The logic is stated below:
(current K-bar volume - the past average trading volume of 48 Ks) > 4 *standard deviation of trading volume
When this condition is met, it is considered that the trading volume is particularly enlarged, which may be an area where support pressure is possible
If the K is an ascending K-bar, then draw support at the lowest point; if the K is a descending K-bar, draw resistance at the highest point.
You can change the length and the number the standard deviation in the input section.

Volume by SessionThis indicator shows volume separated by session. The aim is clarify which session a volume bar occurred in and how it compares to the average of that session - NOT ALL SESSIONS.
The logic is that there is little value comparing for example the volume of the London session against volume of the London-NY session - the London-NY will always have higher volume. But how does today's london compare to yesterdays london or the london average.
The indicator has moving averages that only consider the average of previous episodes of the same session - so the average on the london session is the average of the past 5 london sessions (NY and asia and London-NY are not included in the calculation of the MA).
The indicator goes as high as 1H timeframe and the average line does not function below 5 mins - thats a limitation on available data to calculate it.
There's also a 'dark screen' function. Thats because I like a black background so the colours need to be inverted.
Hope its useful. Good luck.
John

Volume %This volume indicator additionally shows in percent how much volume, e.g. in the 1-minute chart, was traded compared to the average daily volume.

Volume Highlighter(VM) by Tirano안녕하세요. 다이너스티 팀의 안드레아 입니다.
기존에 티라노라는 이름으로 활동했습니다
Volume Highlighter (Vm) 소개
주식시장에서 흔히 중요하게 생각하는 지표 중 하나가 거래량 입니다.
거래량이 "많이" 나올때가 하나의 기준이 되지요.
본 지표는 평균 거래량을 파란색 선으로, 평균 거래량의 일정 배수를 빨간색 선으로 표현하여 발생한 거래량이 빨간색 선을 상향돌파할때 노란색으로 강조해 주는 기능을 가지고있습니다.
기타 문의사항은 댓글 남겨주시면 감사하겠습니다.
Hi. this is Andreas of the Dynasty team.
Introduction to Volume Highlighter (Vm)
One of the most important indicators in the stock market is trading volume.
It is a standard when the volume of transactions is "much".
This indicator has the function of highlighting the average trading volume as blue line and a certain number of average trading volume as red line and highlighting when the trading volume exceeds the red line.
If you have any other questions, please leave a comment.

vRSI-volume detectorVolume RSI and standart deviation of mean volume calculation impose on one another
for easy detection of breakout volumes

VolumeS as stochThis volume indicator is my design. in this example we can use it as stoch but only this one based on pure volume .
since it a volume and not price based it allow us to see the real trend before the price go up or down. And by simple math of conversion volume number to real number . we can add this indicator to any indicator that we choose and we can enhance it affect.
this is just concept idea. as the real best setting for this need still to be found:)
if you want o make it faster or slower just change the smooth or length setting
so have fun

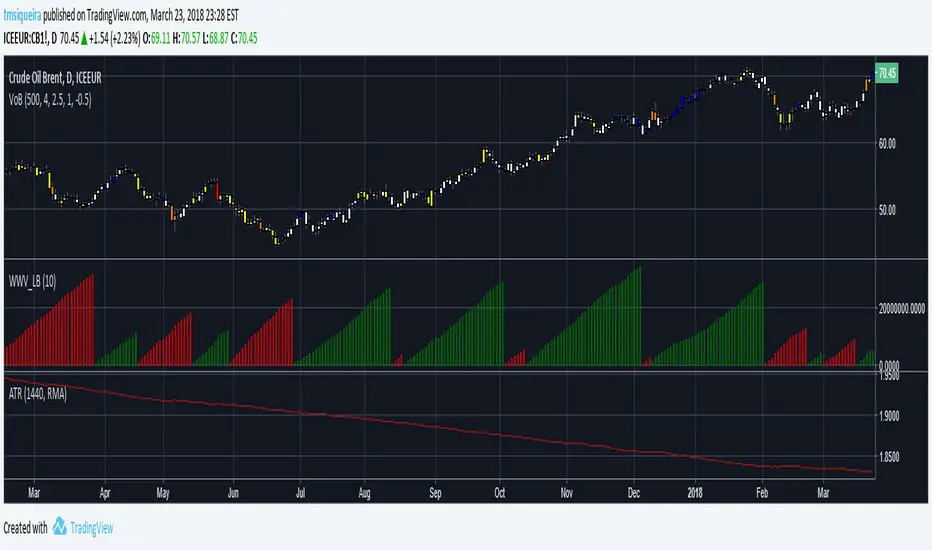
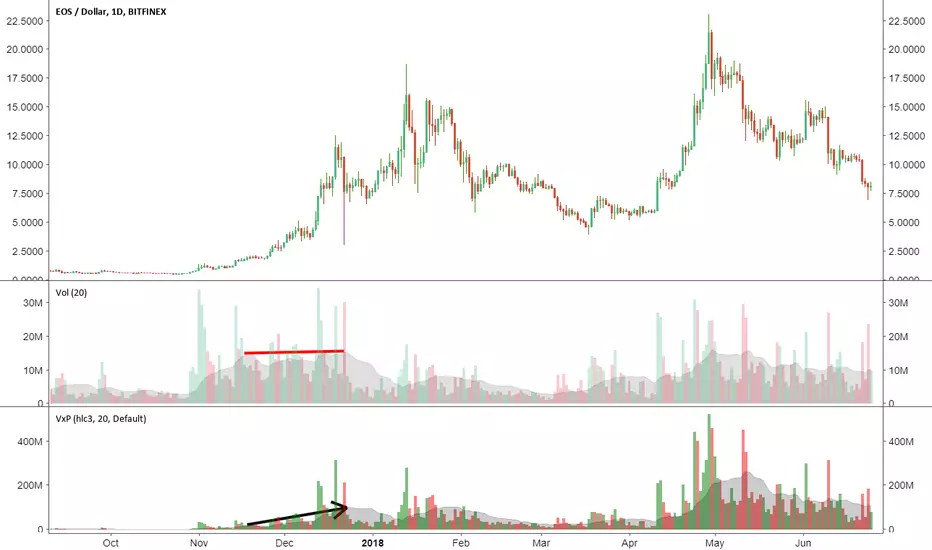
Volume x PriceThis is a simple indicator that calculates volume times price (money volume). Both asset volume and money volume are important indicators in TA. As you can see in the chart above, money volume (moving average) was increasing while the asset volume was not during late 2017. This could have led to wrong interpretations. Money volume becomes more important to consider when the difference in asset price is 'relatively' high.
Features:
- In addition to default options on volume indicator, it is possible to color volume bars based on "money flow multiplier" sign (close-(low+high)/2)
- Money factor can be disabled to show regular volume
Note: Most exchanges show asset volume but there are some like Bitmex that show money volume. Using this indicator on Bitmex type tickers should be avoided.
PS: I couldn't find any indicator for money volume so I had to develop this.
Your feedback is very welcome. If you know similar indicators, please let me know.
Volumes on BarEste indicador colore as cores do candle de acordo com o volume.
Desabilitar a visibilidade do candle original.