Search in scripts for "WaveTrend"

WaveTrend RBF What it does
WT-RBF extracts a “wave” of momentum by subtracting a fast Gaussian-weighted smoother from a slow one, then robust-normalizes that wave with a median/MAD proxy to produce a z-score (z). A short EMA of z forms the signal line. Optional dynamic thresholds use the MAD of z itself so overbought/oversold levels adapt to volatility regimes.
How it’s built:
Radial (Gaussian) smoothers
Causal, exponentially-decaying weights over the last radius bars using σ (sigma) to control spread.
fast = rbf_smooth(src, fastR, fastSig)
slow = rbf_smooth(src, slowR, slowSig)
wave = fast − slow (band-pass)
Robust normalization
A two-stage EMA approximates the median; MAD is estimated from EMA of absolute deviations and scaled by 1.4826 to be stdev-comparable.
z = (wave − center) / MAD
Thresholds
Dynamic OB/OS: ±2.5 × MAD(z) (or fixed levels when disabled)
Reading the indicator
Bull Cross: z crosses above sig → momentum turning up.
Bear Cross: z crosses below sig → momentum turning down.
Exits / Bias flips: zero-line crosses (below 0 → exit long bias; above 0 → exit short bias).
Overbought/Oversold: z > +thrOB or z < thrOS. With dynamics on, the bands widen/narrow with recent noise; with dynamics off, static guides at ±2 / ±2.5 are shown.
Core Inputs
Source: Price series to analyze.
Fast Radius / Fast Sigma (defaults 6 / 2.5): Shorter radius/smaller σ = snappier, higher-freq.
Slow Radius / Slow Sigma (defaults 14 / 5.0): Larger radius/σ = smoother, lower-freq baseline.
Normalization
Robust Z-Score Window (default 200): Lookback for median/MAD proxy (stability vs responsiveness).
Small ε for MAD: Floor to avoid division by zero.
Signal & Thresholds
Dynamic Thresholds (MAD-based) (on by default): Adaptive OB/OS; toggle off to use fixed guides.
Visuals
Shade OB/OS Regions: Background highlights when z is beyond thresholds.
Show Zero Line: Midline reference.
(“Plot Cross Markers” input is present for future use.)

WaveTrend OscillatorWave trend Oscillator, similar to the other Cypher Oscillators, just that this oscillator is a little bit more refined less noise and a few better options for the money flow, but keeping the basic Structures and features. The only feature this does not have is the divergences

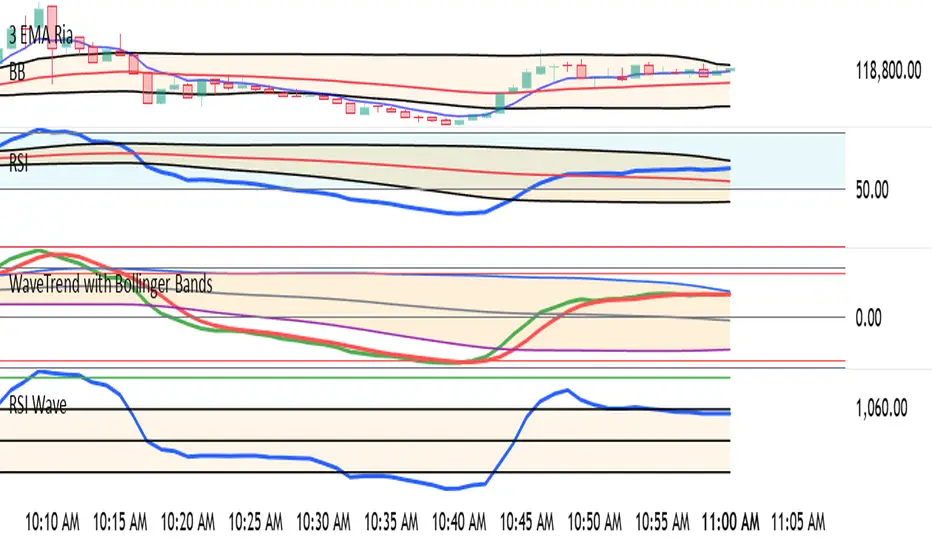
WaveTrend with Bollinger BandsPlots TTM Squeeze momentum histogram (green/red).
Plots RSI (blue) in the same pane.
Shows squeeze dots and RSI overbought/oversold lines.
WaveTrend mtfThis is based on Lazy Bear famous script of Wave trend
So in basic we do MTF on it
One can choose to use the signal of the MTF (circles red or green for buy and sell)
or the regular buy and sell by cross green /red
to the script one can add if it cross the 0 above or bellow (not done here)
the MTF is taken from pinescripter example how to avoid repainting , so it good also for using your indicator to make MTF scripts
alerts included

WaveTrend with Crosses and Alerts - Jab ZootaLazy bear created this script. I added alertconditions to send alerts on crossovers.


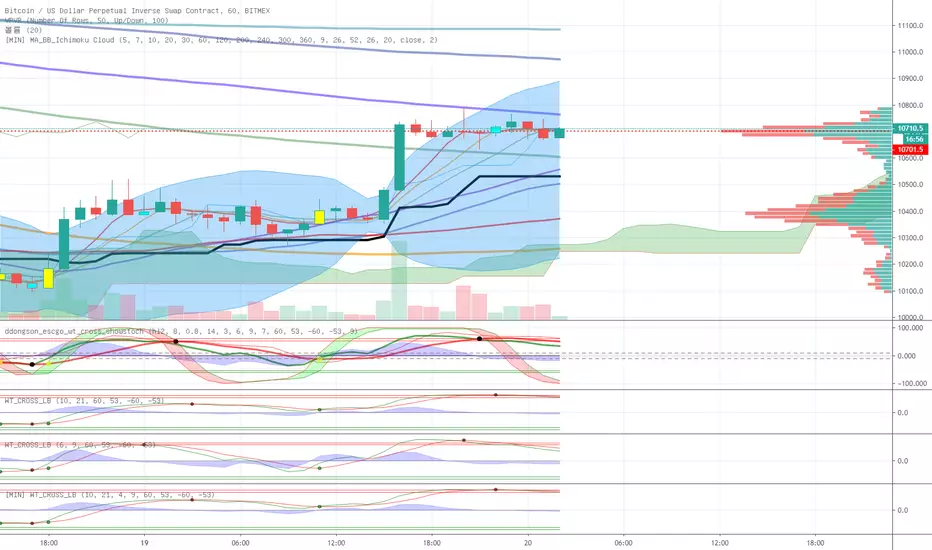
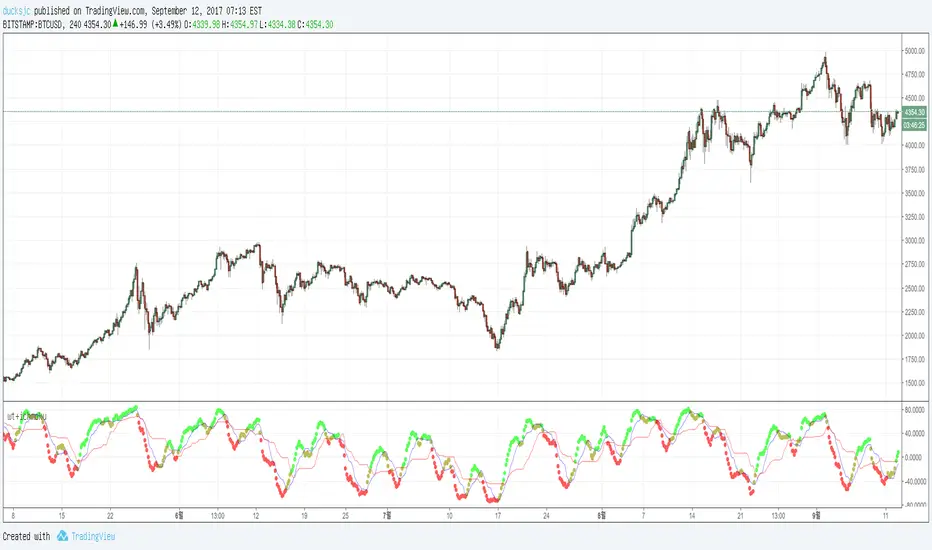
wt+ichmokuwaveTrend is very very very nice script.
and i also like ichmoku
yesterday 'nssoholik' gave me some idea that is rsi+ichmoku
and this is wt+ichmoku
easily
red to green = buy
green to red = sell
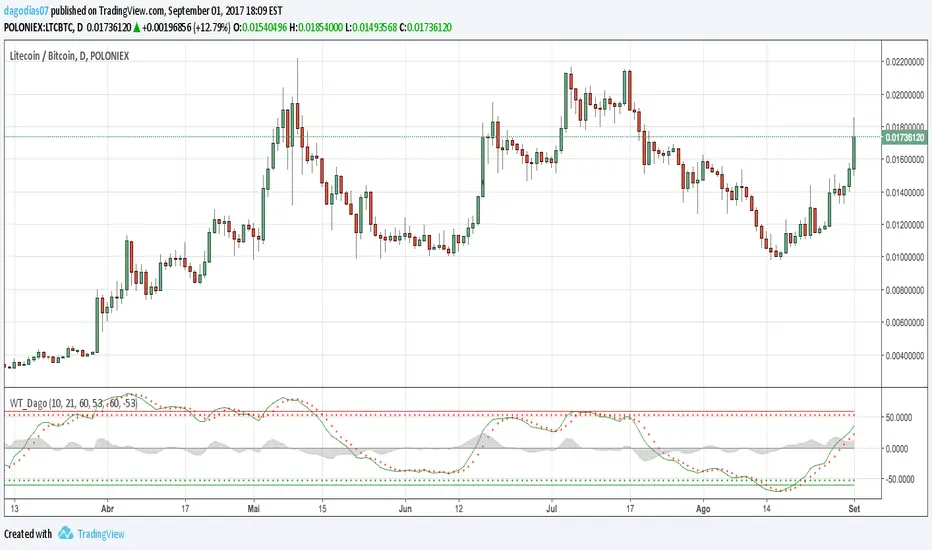
WaveTrend [DagoDias]@author LazyBear -- Modificado por Dagodias adicionado títulos às variáveis e traduzido para o Português.
Através dos títulos fica melhor para customizar o indicador e criar alertas a partir do indicador.
Para utilização em Criptomoedas acredito ser interessante suavemente levantar as linhas base; tornando a área de sobre venda antecipada.
Este indicador não é recomendado para fortes tendências.
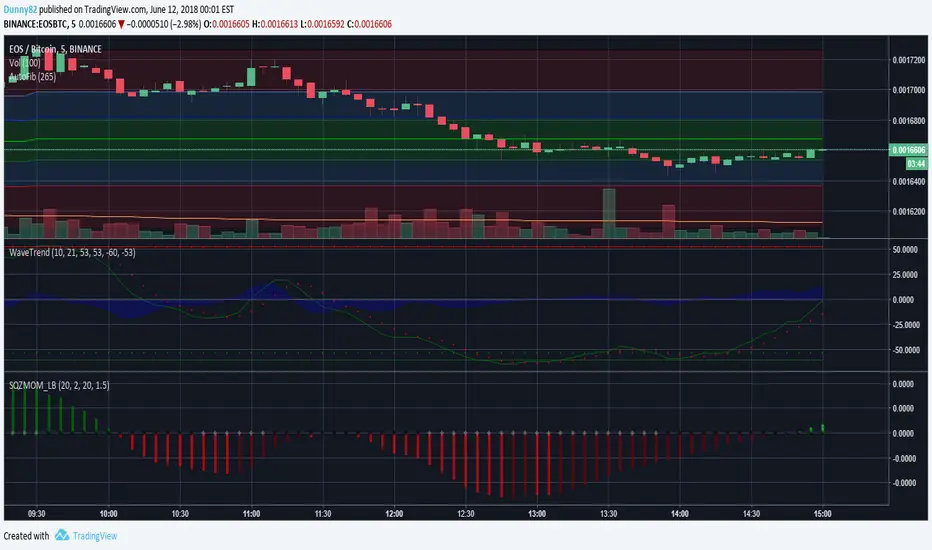
WaveTrend [MastroFran]Great indicator to show short term price movements. 5 day moving average oscillator. When green crosses red and under the 60 mark, buy with caution. when over the 60 mark and red crosses green sell immediately for highest profits.

VuManChu Filtered OverlayVuManChu Filtered Overlay is a price-overlay signal tool inspired by VuManChu Cipher B.
Instead of plotting the full oscillator in a separate pane, this script focuses on generating clean long/short signals directly on the chart, combining WaveTrend, Money Flow–style momentum, and an adjustable overbought/oversold threshold.
Under the hood, the script builds a smoothed “Inertia Wave” using a normalized (close–open)/(high–low) money-flow proxy and a long SMA. This is used together with a classic WaveTrend (wt1 / wt2) calculation. Signals are only triggered when:
WaveTrend lines cross (wt1 vs wt2),
The cross direction matches the expected bias
Bull: cross up from below, WaveTrend below zero
Bear: cross down from above, WaveTrend above zero
The custom money-flow curve (rsiMFI) confirms direction
Bull: rsiMFI > 0
Bear: rsiMFI < 0
The WaveTrend line is beyond a user-defined OS/OB magnitude (Wavetrendtrigger), so only meaningful extremes are considered.
The “VuManChu WaveTrend OS/OB threshold (+/-)” input lets you control how aggressive the signals are:
Lower values (e.g. 5–10) → more frequent, more sensitive signals
Higher values (e.g. 40–60) → fewer signa
ls, focused on strong exhaustion moves
Bullish and bearish opportunities are plotted as green and red dots on the candles, and corresponding alerts are fired:
🟢 Optimized VuManChu LONG signal detected on timeframe: X
🔴 Optimized VuManChu SHORT signal detected on timeframe: X
This script is meant as a filter / confirmation layer, not a standalone system. For best results, combine it with your own trend, volume, or higher-timeframe context. This is not financial advice and should be used for educational and experimental purposes only.

SAYO INDICATOR💠 Overview
SAYO INDICATOR is a powerful multi-component technical indicator built around an enhanced WaveTrend oscillator with extreme condition filtering to reduce mid-range noise and deliver cleaner signals.
It highlights only relevant overbought / oversold momentum shifts and includes divergence detection, optional complementary oscillators, and visual signal markers designed to help traders spot high-probability market turns.
📊 Key Features
💠 Filtered WT Signals
• Shows buy / sell signals only when WaveTrend is in extreme zones (no noise in the middle).
• Clean visuals on momentum crosses with colored circle plots.
💎 Divergence Detection
• Detects Regular and Hidden divergences on WaveTrend.
• Second range divergence support for deeper momentum insight.
• Optional RSI and Stochastic divergence visualization.
⚡ Momentum Oscillators
• Optional classic RSI and Stochastic RSI panels.
• Integrated RSI+MFI area for money-flow emphasis.
• Optional Schaff Trend Cycle line for trend strength context.
🔥 Sommi Pattern Markers
• Sommi Flags and Diamonds to indicate potential structure shifts and trend continuation setups.
💠 Gold Buy Signals
• Premium quality buy indicator using multiple confluence factors (WT levels and divergence + RSI context).
📌 What You See On Chart
📈 Green circles
Buy signals when WaveTrend crosses in strong oversold territory.
📉 Red circles
Sell signals when WaveTrend crosses in strong overbought territory.
🔎 Dots for divergence
Displays divergence setups (bullish / bearish) visually alongside momentum.
📊 Optional indicator panels
RSI, Stochastic RSI, Schaff cycle and MFI highlight additional context when enabled.
🧠 How Traders Use It
• Identify high-probability reversal areas with minimal false signals
• Confirm trend strength and timing via complementary oscillators
• Filter market noise during ranging periods
• Integrate with support/resistance or patterns for trade entry decisions
⚙️ Inputs & Customization
• Full control over WaveTrend channel lengths and smoothing
• Divergence sensitivity levels
• Optional indicator visibility (RSI, MFI, Stoch, Schaff)
• Thresholds for WT extremes and divergence ranges

Institutional Analyst LLM📊 Institutional Analyst Board LLM – Smart Money Confluence Scanner for XAUUSD, Forex, Crypto 🔍 Overview The Institutional Analyst Board is a complete multi-timeframe smart money toolkit designed for traders who demand clarity, confluence, and precision. It brings together institutional-grade metrics—Order Blocks (OB), Fair Value Gaps (FVG), Liquidity Sweeps, MACD/RSI...
PTS Ultimate Analysis Board (Flexible Position + Ticker)
GoldenTradeClub
GoldenTradeClub
Updated
Jul 15
PTS Ultimate Analysis Board (Flexible Position + Ticker) Version: Pine v5 Description: This indicator builds a fully customizable, multi-timeframe dashboard table that surfaces 19 key metrics for any ticker (current chart TF, 1 h, 4 h). You can position the table at the top-right or bottom-right of your chart and toggle each metric on or off. Key...
Trading Engine AI Light
GoldenTradeClub
GoldenTradeClub
Jul 14
The Trading Engine includes the best and most effective technical analysis tools. It has 27 different Buy Signal parameters and 26 different Sell Signal parameters. Furthermore, it also has 9 Stop Loss triggers for Long Positions and 8 Stop Loss triggers for Short Positions. Many of the Buy or Sell Signal parameters function as Take Profit and Stop Loss signals...
Elliott Wave Complete
GoldenTradeClub
GoldenTradeClub
Jul 4
1. Indicator Presentation Name: Elliott Wave Complete Type: Pine Script v5 overlay dashboard for TradingView Purpose: Automates Elliott Wave motive (1-5) and corrective (A-B-C) pattern detection on any timeframe, enriches it with classic ZigZag pivots, dynamic Fibonacci projection levels, optional wave-count info box, and real-time alerts—all in one...
💀⚡ PTS WIZARD 666™ ULTIMATE SUPREME V5.0 - COMPLETE FIXED ⚡💀
GoldenTradeClub
GoldenTradeClub
Jul 4
1. Indicator Presentation Name: 💀⚡ PTS WIZARD 666™ ULTIMATE SUPREME V5.0 – COMPLETE FIXED Short ID: PTS-666-SUPREME Type: Pine Script v5 overlay dashboard for TradingView Purpose: An all-in-one trading overlay that integrates advanced WaveTrend momentum, RSI/MFI analysis, POC volume profiling, multiple Fibonacci golden/ultimate zones, volume footprint & imbalance...
🔥 PTS TRADE 666™ ULTIMATE BOOKMAP + QUANTUM ENGINE
GoldenTradeClub
GoldenTradeClub
Jul 4
1. Indicator Presentation Name: 🔥 PTS TRADE 666™ ULTIMATE BOOKMAP + QUANTUM ENGINE Short ID: PTS666_QUANTUM_FINAL Type: Pine Script v5 overlay dashboard for TradingView Purpose: A cutting-edge, institutional-grade suite that unifies bookmap-style footprint volume profiling, dynamic heatmap liquidity analysis, AI-driven pattern recognition, smart-money protocols,...
🔥 PTS TRADE 666™ - ULTIMATE INSTITUTIONAL TOOL 🔥
GoldenTradeClub
GoldenTradeClub
Jul 4
1. Indicator Presentation Name: 🔥 PTS TRADE 666™ – ULTIMATE INSTITUTIONAL TOOL V2.0 Short ID: PTS666_UIT_V2 Type: Pine Script v5 overlay dashboard for TradingView Purpose: Combines institutional-grade footprint volume analysis, smart-money structure detection, statistical anomaly checks, multi-timeframe divergence, Ichimoku insights, pattern recognition, and an...
PTS Wizard
GoldenTradeClub
GoldenTradeClub
Jul 4
1. Indicator Presentation Name: PTS Wizard Short Title: PTS Wizard Type: Pine Script v5 overlay dashboard for TradingView Purpose: A unified multi-strategy toolkit that overlays key market insights—liquidity zones, smart-money structure, footprint-style volume profile, consolidation ranges, statistical deviation bands, price forecasts, and session analysis—into a...
🔥 PTS.TRADE 666™ ULTIMATE HYBRID + MTF V3
GoldenTradeClub
GoldenTradeClub
Jul 4
1. Indicator Presentation Name: 🔥 PTS.TRADE 666™ ULTIMATE HYBRID + MTF V3 Short ID: PTS666_ULTIMATE_MTF_V3 Type: Overlay dashboard for TradingView Purpose: A next-level hybrid trading suite that merges institutional-grade order-flow analysis, smart-money concepts, AI-driven insights, classic momentum oscillators (WaveTrend, divergence, “Gold” signals),...
🧙♂ PTS WIZARD V3.0 - FINAL EDITION
GoldenTradeClub
GoldenTradeClub
Jul 4
1. Indicator Presentation Name: 🧙♂ PTS WIZARD V3.0 – FINAL EDITION Short Title: PTS-WIZARD-V3-FINAL Type: Overlay trading dashboard for TradingView Purpose: A comprehensive multi-module indicator that blends classic cipher momentum signals, Elliott Wave pattern detection, advanced statistical analyses (Z-Score, Benford’s Law, Ehlers SNR), footprint-style volume...
🧙♂ PTS WIZARD V3.0 + FOOTPRINT ULTIMATE
GoldenTradeClub
GoldenTradeClub
Jul 4
Name: PTS WIZARD V3.0 + FOOTPRINT ULTIMATE Type: Overlay trading dashboard for TradingView Purpose: Combines classic cipher-style momentum signals with an advanced footprint volume profile, multi-timeframe bias, statistical filters, and a fusion-score system—displayed in a customizable on-chart dashboard. Core Modules Cipher Momentum Signals WaveTrend...
🧙♂ PTS WIZARD V3.0 - BASIC
GoldenTradeClub
GoldenTradeClub
Jul 1
PTS WIZARD V3.0 Basic – Ultimate Multi-Tool Trading Dashboard An all-in-one overlay combining classic cipher signals, Elliott Wave pattern detection, volume analytics, divergence spotting, and smart-entry timing—backed by advanced statistical filters and a live dashboard. Key Features Cipher Signals WaveTrend with overbought/oversold zones & cross signals RSI...
Trading Engine vCD AI
GoldenTradeClub
GoldenTradeClub
Jun 15
The Trading Engine includes the best and most effective technical analysis tools. It has 27 different Buy Signal parameters and 26 different Sell Signal parameters. Furthermore, it also has 9 Stop Loss triggers for Long Positions and 8 Stop Loss triggers for Short Positions. Many of the Buy or Sell Signal parameters function as Take Profit and Stop Loss signals...
Trading Engine vCD
GoldenTradeClub
GoldenTradeClub
Updated
Mar 21
The Trading Engine includes the best and most effective technical analysis tools. It has 27 different Buy Signal parameters and 26 different Sell Signal parameters. Furthermore, it also has 9 Stop Loss triggers for Long Positions and 8 Stop Loss triggers for Short Positions. Many of the Buy or Sell Signal parameters function as Take Profit and Stop Loss signals...
TE CLIENT v13
GoldenTradeClub
GoldenTradeClub
Updated
Mar 15
The Trading Engine includes the best and most effective technical analysis tools. It has 27 different Buy Signal parameters and 26 different Sell Signal parameters. Furthermore, it also has 9 Stop Loss triggers for Long Positions and 8 Stop Loss triggers for Short Positions. Many of the Buy or Sell Signal parameters function as Take Profit and Stop Loss signals...
Trading Engine v13
GoldenTradeClub
GoldenTradeClub
Updated
Mar 15
The Trading Engine includes the best and most effective technical analysis tools. It has 27 different Buy Signal parameters and 26 different Sell Signal parameters. Furthermore, it also has 9 Stop Loss triggers for Long Positions and 8 Stop Loss triggers for Short Positions. Many of the Buy or Sell Signal parameters function as Take Profit and Stop Loss signals...
Trading Engine B2B
GoldenTradeClub
GoldenTradeClub
Updated
Jan 14
The Trading Engine includes the best and most effective technical analysis tools. It has 25 different Buy Signal parameters and 24 different Sell Signal parameters. Furthermore, it also has 9 Stop Loss triggers for Long Positions and 8 Stop Loss triggers for Short Positions. Many of the Buy or Sell Signal parameters function as Take Profit and Stop Loss signals...
Trading Engine B2B FX V9
GoldenTradeClub
GoldenTradeClub
Updated
Jan 14
The VFLOW Trading Engine includes the best and most effective technical analysis tools. It has 20 different Buy Signal parameters and 18 different Sell Signal parameters. Furthermore, it also has 7 Stop Loss triggers for Long Positions and 5 Stop Loss triggers for Short Positions. Many of the Buy or Sell Signal parameters function as Take Profit and Stop Loss...
English
Select market data provided by ICE Data services.
Select reference data provided by FactSet. Copyright © 2025 FactSet Research Systems Inc.
© 2025 TradingView, Inc.
More than a product
Supercharts
Screeners
Stocks
ETFs
Bonds
Crypto coins
CEX pairs
DEX pairs
Pine
Heatmaps
Stocks
ETFs
Crypto
Calendars
Economic
Earnings
Dividends
More products
Yield Curves
Options
News Flow
Pine Script®
Apps
Mobile
Desktop
Tools & subscriptions
Features
Pricing
Market data
Trading
Overview
Brokers
Special offers
CME Group futures
Eurex futures
US stocks bundle
About company
Who we are
Athletes
Blog
Careers
Media kit
Merch
TradingView store
Tarot cards for traders
The C63 TradeTime
Policies & security
Terms of Use
Disclaimer
Privacy Policy
Cookies Policy
Accessibility Statement
Security tips
Bug Bounty program
Status page
Community
Social network
Wall of Love
Refer a friend
House Rules
Moderators
Ideas
Trading
Education
Editors' picks
Pine Script
Indicators & strategies
Wizards
Freelancers
Business solutions
Widgets
Charting libraries
Lightweight Charts™
Advanced Charts
Trading Platform
Growth opportunities
Advertising
Brokerage integration
Partner program
Education program
Look First
Close
Updated 3 hours ago
Institutional Analyst Board
Manage access
Remove from favorites
Use on chart
0
11
Jul 19
📊 Institutional Analyst Board – Smart Money Confluence Scanner for XAUUSD, Forex, Crypto
🔍 Overview
The Institutional Analyst Board is a complete multi-timeframe smart money toolkit designed for traders who demand clarity, confluence, and precision. It brings together institutional-grade metrics—Order Blocks (OB), Fair Value Gaps (FVG), Liquidity Sweeps, MACD/RSI bias, VWAP positioning, and Break of Structure (BoS)—into a single powerful visual dashboard.
This indicator is especially optimized for Gold (XAUUSD) but is also compatible with Crypto and Forex assets.
🧠 Key Features
✅ Multi-Timeframe Dashboard (5M / 15M / 1H)
✅ Order Block Detection with dynamic zones that extend until broken
✅ Fair Value Gap Detection with clear zone shading and border distinction
✅ MACD + RSI Confluence for momentum and bias alignment
✅ VWAP Positioning to identify premium/discount zones
✅ Liquidity Sweeps (internal/external range breaks)
✅ Killzone Highlighting (Asia / London / New York)
✅ Break of Structure (BoS) with advanced confluence filters
✅ Gold Bias Flags across timeframes (BUY / SELL / NEUTRAL)
✅ Dynamic Price Watermark with real-time data
✅ Fully customizable colors, transparencies, and text labels
🧠 How It Works
The Board uses institutional logic to analyze the chart in real time:
Metric Purpose
OB Zones Highlight potential smart money footprints where price is likely to react.
FVG Zones Identify imbalance areas between buyers and sellers—ideal for mean reversion entries.
MACD/RSI Confirm momentum direction and relative strength confluence.
VWAP Determine whether price is trading at a premium or discount.
Liquidity Sweeps Detect manipulative moves before major reversals.
BoS Mark potential trend reversals, filtered by institutional confluence.
Each signal is computed across 3 timeframes and visualized in a clean board that updates live. You’ll also see labels, alerts, and session overlays for maximum clarity.
📌 Ideal Use Case
This tool is perfect for:
Funded Challenge Traders (FTMO, MyForexFunds, etc.)
Gold scalpers and intraday traders
Crypto price action traders using BTC, ETH, SOL, etc.
Smart Money Concept (SMC) and ICT followers
⚙️ Customization Options
Toggle each module (OB, FVG, VWAP, MACD/RSI, etc.)
Set transparency and color for each zone type
Adjust Killzone timing (Asia, London, NY)
Control board position (Top/Bottom) and metric visibility
📈 Compatible Assets
✅ XAUUSD (optimized)
✅ Forex majors/minors
✅ Crypto pairs (BTC, ETH, SOL, etc.)
✅ Indices (GER40, NASDAQ, SPX with minor adaptation)
🛠️ Requirements
Use on TradingView v5
Set chart time to UTC+0 or UTC+3 for optimal Killzone accuracy
For crypto, redefine Killzone hours if needed (24/7 market)
🧠 Pro Tip
Pair this indicator with volume profile tools, CVD/Delta Flow, or Footprint overlays to build high-confidence trade setups with clear institutional confluence.

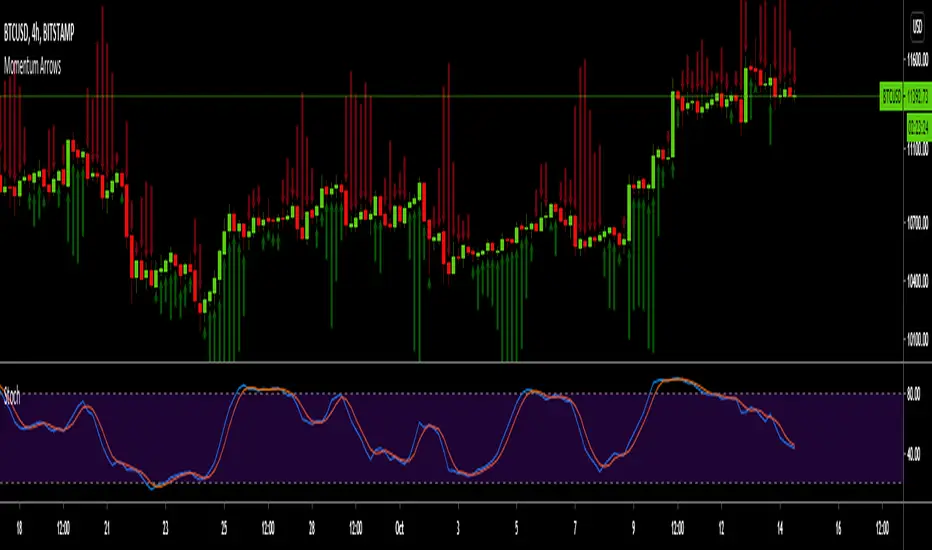
Momentum ArrowsThis simple indicators paints the Momentum based on Stochastic, RSI or WaveTrend onto the Price Chart by showing Green or Red arrows.
In the settings it can be selected which indicator is used, Stochastic is selected by default.
Length of the arrows is determined by the strength of the momentum:
Stochastic: Difference between D and K
RSI: Difference from RSI-50
WaveTrend: Difference between the Waves
(Thanks to @LazyBear for the WaveTrend inspiration)
PS:
If anyone has an idea how to conditionally change the color of the arrows, then please let me know - that would be the icing on the cake. Then it would be possible to indicate Overbought/Oversold levels with different colors.
Unfortunately it currently seems not to be possible to dynamically change the arrow colour.
CryptoVN_WaveTrendMod version from Indicator: WaveTrend Oscillator by @LazyBear
About this mod version:
- WaveTrend: both Fast and Slow
- Histogram: change color when the signal Above or Below the Zero Line.
- Show Dots at Cross the signal
- ...
A few notes about the signal:
*Below the Oversold band (Buy zone):fema crosses UP the fsma ==> good BUY signal.
*Above the Overbought band (Sell zone):fema crosses DOWN the fsma ==> good SELL signal.
* ...

WhaleCrew VisionVision is an advanced momentum oscillator that visualizes momentum strength with overbought and oversold readings.
Features
Momentum Waves
Divergence Detection (regular and hidden divergences)
Detection for momentum shifts (detects higher lows/lower highs on the oscillator)
Detection for momentum stagnation
Moneyflow
Most important: Our Custom Strategy Builder
Custom Strategy Builder
The custom strategy builder is a framework that allows you to easily create custom strategies.
1. Configure long/short conditions
Pre-defined conditions for custom timeframes, under which you're looking to potentially enter a trade.
2. Configure trigger
Select a trigger (e.g. "Wave Cross" or "Wave Lower High") to generate labels/alerts for potential entries, whenever long/short conditions are met.
3. Configure Take Profit Conditions
Potential Take Profits are triggered by momentum stagnation.
4. Backtest your strategy
By using our open-source backtester script (published on our profile).
5. Trade responsibly
Manually review each signal/alert before taking any actions.
Note: The "Strategy Backtest" input section can also help you develop your strategy.
Usage
You can use this indicator to follow the trend, detect momentum shifts or memorize patterns.
Take a systematic approach by using our strategy builder.
Access to this indicator can be obtained through our website.

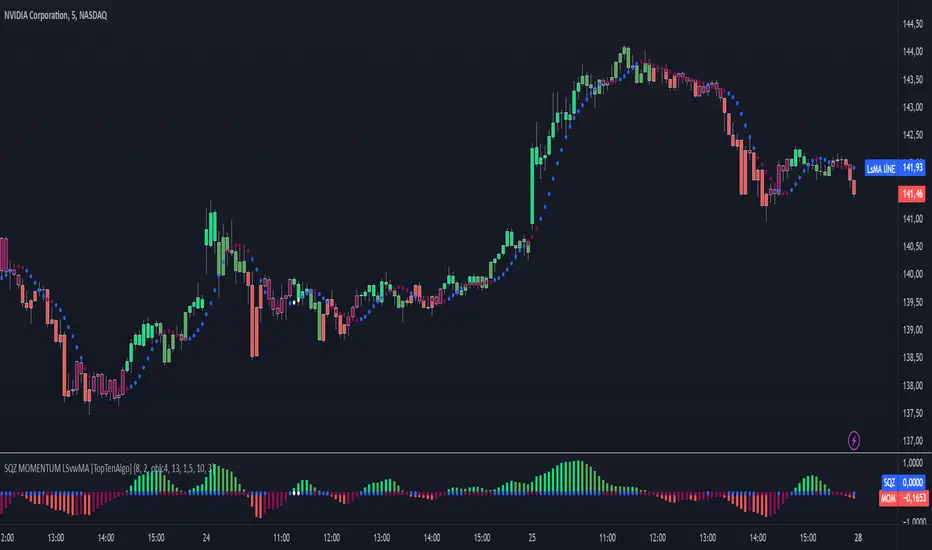
TopTenAlgo 10. SQZMOM_LSvwMA with Bar ColorEN: This Algorithm is a derivative of John Carter's "TTM Squeeze" volatility indicator. Many strategists have taken the indicator on Tradingview with simple moving averages and have looked at the biggest mistake only by dealing with squeeze and exit processes to squeeze. But I used the algorithm to determine where the markets would actually explode. For example, instead of using SMAs , I tested them on the Linear Regression Curve using Volume Weighted Moving Averages and Hull MAs. This gave me the opportunity to develop a more responsive algorithm and identify where the actual explosion would occur. The Gray Circles in the midline show that the market is entering a new jam (in the Bollinger Bands and Keltner Channel). This means low volatility , the market prepares itself for an explosive move (up or down). White Circles mean that it is about to get out of the jam. The Blue Circles, which no one can calculate, now inform that the exit is no longer jammed and that the explosion has taken place.
Mr. Carter recommends that you wait until the first gray after a gray cross and take a position in the momentum direction (for example, if the momentum value is above zero, relax). Exit position when the momentum changes (increase or decrease, this is indicated by a color change). In this algorithm, I tried to achieve good entry points using an additional indicator such as ADX and WaveTrend. To draw the histogram, I used a different method based on Linear Regression . Mr.Carter uses a simple momentum indicator .
In summary, this algorithm is a strict algorithm in which additional 4-5 indicators are blended. Conveniences for Everyone ...
This algorithm is prepared with @Top10Algo ...
TR: Bu Algoritma John Carter'ın "TTM Squeeze" volatilite göstergesinin bir türevidir. Bir çok stratejist Tradingview' de gösterge' yi basit hareketli ortalamalarla ele almış ve en büyük hatayı sadece sıkışma ve sıkışmadan çıkış süreçlerini ele alarak bakmışlardır. Fakat ben algoritmayı piyasaların asıl patlama yapacağı yeri tespit etmek için kullandım. Örneğin SMA' ları kullanmak yerine Hacim Ağırlıklı Hareketli Ortalamaları ve Hull MA' ları kullanarak onları Linerar Regresyon Eğrisinde stress testine tabi tuttum. Buda bana daha duyarlı bir algoritma geliştirmem ve asıl patlamanın olacağı yerleri tespit etmem için fırsat verdi. Orta hattaki Gri Daireler, piyasanın yeni bir sıkışmaya girdiğini gösteriyor ( Bollinger Bantları ve Keltner Kanalı'nda). Bu, düşük volatilite anlamına gelir, piyasa kendisini patlayıcı bir harekete hazırlar (yukarı veya aşağı). Beyaz Daireler ise sıkışmadan çıkmak üzere olduğu anlamına gelir. Hiç kimsenin hesap edemediği Mavi Daireler ise artık sıkışmadan çıkıldığını ve patlamanın gerçekleştiğini haber verir.
Mr.Carter, gri bir çarpı işaretinden sonra ilk griye kadar beklemenizi ve momentum yönünde bir pozisyon almanızı önerir (örneğin, momentum değeri sıfırın üstünde ise, rahat olun). Momentum değiştiğinde pozisyondan çıkın (artırma veya azaltma, bunu o bir renk değişikliği ile belirtilir). Bu algoritmada ben, ADX ve WaveTrend gibi ek bir gösterge kullanarak iyi giriş noktalarıelde etmeye çalıştım. Histogramı çizmek için ise Linear Regresyon tabanlı farklı bir yöntem kullandım. Mr.Carter basit bir momentum göstergesi kullanır.
Özetle bu algoritma ek 4-5 göstergenin harmanlandığı sıkı bir algoritmadır. Herkese Kolaylıklar dilerim...
Bu algoritma @Top10Algo ile beraber hazırlanmıştır... Kodlamadaki katkılarından ve yol göstericiliğinden dolayı teşekkürü bir borç bilirim.
TopTenAlgo 10. SQZMOM_LSvwMA with Bar Color (Not Based Volume)EN: This Algorithm is a derivative of John Carter's "TTM Squeeze" volatility indicator. Many strategists have taken the indicator on Tradingview with simple moving averages and have looked at the biggest mistake only by dealing with squeeze and exit processes to squeeze. But I used the algorithm to determine where the markets would actually explode. For example, instead of using SMAs , I tested them on the Linear Regression Curve using Volume Weighted Moving Averages and Hull MAs. This gave me the opportunity to develop a more responsive algorithm and identify where the actual explosion would occur. The Gray Circles in the midline show that the market is entering a new jam (in the Bollinger Bands and Keltner Channel). This means low volatility , the market prepares itself for an explosive move (up or down). White Circles mean that it is about to get out of the jam. The Blue Circles, which no one can calculate, now inform that the exit is no longer jammed and that the explosion has taken place.
Mr. Carter recommends that you wait until the first gray after a gray cross and take a position in the momentum direction (for example, if the momentum value is above zero, relax). Exit position when the momentum changes (increase or decrease, this is indicated by a color change). In this algorithm, I tried to achieve good entry points using an additional indicator such as ADX and WaveTrend. To draw the histogram, I used a different method based on Linear Regression . Mr.Carter uses a simple momentum indicator .
In summary, this algorithm is a strict algorithm in which additional 4-5 indicators are blended. Conveniences for Everyone ... (For Symbols that cannot be read on the Volume Indicator)
This algorithm is prepared with @Top10Algo ...
TR: Bu Algoritma John Carter'ın "TTM Squeeze" volatilite göstergesinin bir türevidir. Bir çok stratejist Tradingview' de gösterge' yi basit hareketli ortalamalarla ele almış ve en büyük hatayı sadece sıkışma ve sıkışmadan çıkış süreçlerini ele alarak bakmışlardır. Fakat ben algoritmayı piyasaların asıl patlama yapacağı yeri tespit etmek için kullandım. Örneğin SMA' ları kullanmak yerine Hacim Ağırlıklı Hareketli Ortalamaları ve Hull MA' ları kullanarak onları Linerar Regresyon Eğrisinde stress testine tabi tuttum. Buda bana daha duyarlı bir algoritma geliştirmem ve asıl patlamanın olacağı yerleri tespit etmem için fırsat verdi. Orta hattaki Gri Daireler, piyasanın yeni bir sıkışmaya girdiğini gösteriyor ( Bollinger Bantları ve Keltner Kanalı'nda). Bu, düşük volatilite anlamına gelir, piyasa kendisini patlayıcı bir harekete hazırlar (yukarı veya aşağı). Beyaz Daireler ise sıkışmadan çıkmak üzere olduğu anlamına gelir. Hiç kimsenin hesap edemediği Mavi Daireler ise artık sıkışmadan çıkıldığını ve patlamanın gerçekleştiğini haber verir.
Mr.Carter, gri bir çarpı işaretinden sonra ilk griye kadar beklemenizi ve momentum yönünde bir pozisyon almanızı önerir (örneğin, momentum değeri sıfırın üstünde ise, rahat olun). Momentum değiştiğinde pozisyondan çıkın (artırma veya azaltma, bunu o bir renk değişikliği ile belirtilir). Bu algoritmada ben, ADX ve WaveTrend gibi ek bir gösterge kullanarak iyi giriş noktalarıelde etmeye çalıştım. Histogramı çizmek için ise Linear Regresyon tabanlı farklı bir yöntem kullandım. Mr.Carter basit bir momentum göstergesi kullanır.
Özetle bu algoritma ek 4-5 göstergenin harmanlandığı sıkı bir algoritmadır. Herkese Kolaylıklar dilerim... (Hacim Göstergesi okunamayan Semboller için)
Bu algoritma @Top10Algo ile beraber hazırlanmıştır...

High-Low- Signal (Expo)High-Low-Signal (Expo)
DESCRIPTION
This simple but powerful High-Low indicator plots price extremes. Either it’s an exhausting sign or a continuation sign of the trend. The color of the cloud determines the trend, and the height of the peaks determines the strength in the price moves. You can easily compare current peaks with historical ones to understand the current dynamics and what might happen next.
This indicator is a must if you want to understand price dynamics in the market. The indicator is perfect to combine with other indicators to confirm the signal.
For example:
Combine it with trend lines/Channels/Bollinger Band, you name it! If the indicator peaks in conjunction with that the price reaches a trend line/Channels/Bollinger Band. It's a great sign!
HOW TO USE
1. Look for a signal
2. Identify the color and height of the peak. Compare it to historical ones to get an understanding of the current market dynamics.
3. Combine the indicator with e.g. trend lines/Channels/Bollinger Band
4. Consider Enter the market.
INDICATOR IN ACTION
BTCUSD
BTCUSD
BTCUSD
Wall Street
EURJPY
EURUSD
GOLD
I hope you find this indicator useful , and please comment or contact me if you like the script or have any questions/suggestions for future improvements. Thanks!
I will continue to work on this indicator, so please share your experience and feedback with me so that I can continuously improve it. Thanks to everyone that have contacted me regarding my scripts. Your feedback is valuable for future developments!
ACCESS THE INDICATOR
• Contact me on TradingView or use the links below
-----------------
Disclaimer
Copyright by Zeiierman.
The information contained in my scripts/indicators/ideas does not constitute financial advice or a solicitation to buy or sell any securities of any type. I will not accept liability for any loss or damage, including without limitation any loss of profit, which may arise directly or indirectly from use of or reliance on such information.
All investments involve risk, and the past performance of a security, industry, sector, market, financial product, trading strategy, or individual’s trading does not guarantee future results or returns. Investors are fully responsible for any investment decisions they make. Such decisions should be based solely on an evaluation of their financial circumstances, investment objectives, risk tolerance, and liquidity needs.
My scripts/indicators/ideas are only for educational purposes!

Stochastic RSI - WT Confluence Signal Detectors (TraderDemircan)Description
What This Indicator Does:
This indicator combines two powerful momentum oscillators—WaveTrend and Stochastic RSI—to identify high-probability trading signals through confluence. Instead of relying on a single indicator that may generate false signals, this tool only triggers buy/sell alerts when both oscillators simultaneously confirm extreme market conditions and trend reversals. This confluence approach significantly reduces noise and helps traders focus on the most reliable setups.
Key Features:
Dual-Oscillator Confluence: Generates signals only when both WaveTrend crossovers and Stochastic RSI extreme levels align
Normalized Scale Display: Both oscillators are plotted on a unified -100 to +100 scale for easy visual comparison
Visual Signal Confirmation: Clear intersection points marked with colored circles, plus optional candle coloring at crossover moments
Customizable Thresholds: Adjust overbought/oversold levels for both oscillators to match your trading style and asset volatility
Clean Visual Presentation: Optional area fill showing WaveTrend momentum difference, making divergences easier to spot
How It Works:
The indicator operates on a confluence principle where multiple conditions must align:
For BUY Signals (Green):
WaveTrend 1 crosses above WaveTrend 2 (bullish crossover)
WaveTrend is in oversold territory (below -53 or -60)
Stochastic RSI K-line is below 20 (oversold)
For SELL Signals (Red):
WaveTrend 1 crosses below WaveTrend 2 (bearish crossover)
WaveTrend is in overbought territory (above 53 or 60)
Stochastic RSI K-line is above 80 (overbought)
WaveTrend Component:
Uses the hlc3 price (average of high, low, close) to calculate a channel index that identifies market momentum waves. The two WaveTrend lines (WT1 and WT2) act similarly to MACD, where crossovers indicate momentum shifts. The oscillator ranges from approximately -100 to +100, with extreme values suggesting potential reversals.
Stochastic RSI Component:
Applies stochastic calculations to RSI values rather than raw price, creating a more sensitive momentum indicator. Values above 80 indicate overbought conditions (potential selling opportunity), while values below 20 indicate oversold conditions (potential buying opportunity). The indicator includes both K-line (faster) and D-line (slower, smoothed) for additional confirmation.
Normalization Technology:
To enable direct visual comparison, the Stochastic RSI (normally 0-100 scale) is normalized to match WaveTrend's -100 to +100 scale. This allows traders to see both oscillators' movements in relation to the same reference levels, making divergences and convergences more apparent.
How to Use:
For Trend Traders:
Wait for confluence signals in the direction of the larger trend
Use buy signals in uptrends as entry points during pullbacks
Use sell signals in downtrends as entry points during bounces
For Reversal Traders:
Focus on confluence signals at major support/resistance levels
Look for divergences between price and oscillators before confluence signals
Consider stronger signals when both oscillators reach extreme levels (WT beyond ±60, Stoch beyond 20/80)
For Scalpers:
Lower the WaveTrend Channel Length (default 10) to 5-7 for more frequent signals
Tighten overbought/oversold thresholds slightly (e.g., WT: ±50, Stoch: 30/70)
Use on lower timeframes (5m, 15m) with strict stop losses
Settings Guide:
WaveTrend Parameters:
Channel Length (10): Controls sensitivity. Lower = more signals but more noise. Higher = fewer but more reliable signals
Average Length (21): Smoothing period for WT2. Higher values reduce whipsaws
Overbought Levels (60/53): Two-tier system. Breaching 60 indicates strong overbought, 53 is moderate
Oversold Levels (-60/-53): Mirror of overbought levels for downside extremes
Stochastic RSI Parameters:
K-Smooth (3): Smoothing for the K-line. Higher = smoother but delayed
D-Smooth (3): Additional smoothing for the D-line signal
RSI Period (14): Standard RSI calculation period
Stoch Period (14): Stochastic calculation lookback
Oversold (20) / Overbought (80): Classic thresholds for extreme conditions
Visual Options:
Show WT Difference Area: Displays the momentum difference between WT1 and WT2 as a blue shaded area
Show WT Intersection Points: Marks crossover points with colored circles (red for bearish, green for bullish)
Color Candles at Intersection: Changes candle colors at crossover moments (blue for bearish, yellow for bullish)
Show Stoch Over Signals: Displays when Stochastic RSI breaches extreme levels
What Makes This Original:
While WaveTrend and Stochastic RSI are established indicators, this script's originality lies in:
Confluence Logic: The specific combination requiring simultaneous confirmation from both oscillators in extreme zones, not just simple crossovers
Normalization Approach: Displaying both oscillators on the same -100 to +100 scale for direct visual comparison, which is not standard
Multi-Tier Overbought/Oversold: Using two levels (60/53) instead of one, allowing for nuanced signal strength assessment
Integrated Visual System: Combining area fills, intersection markers, and candle coloring in a coordinated display that shows momentum flow at a glance
Important Considerations:
This is a momentum-based oscillator system, which performs best in ranging or trending markets with clear swings
In strong trending markets, the oscillator may remain in extreme zones for extended periods (remain overbought during strong uptrends, oversold during strong downtrends)
Confluence signals are intentionally rare to maintain quality—expect fewer signals than with single-indicator systems
Always combine with price action analysis, support/resistance levels, and proper risk management
Not recommended for extremely low volatility or thin markets where oscillators may produce erratic readings
Best Timeframes:
Intraday: 15m, 1H (with tighter parameters)
Swing Trading: 4H, Daily (with default parameters)
Position Trading: Daily, Weekly (with extended Channel Length 15-20)
Typical Use Cases:
Identifying exhaustion points in trending markets
Timing entries during pullbacks in established trends
Spotting potential reversal zones at key price levels
Filtering out weak momentum signals during consolidation
