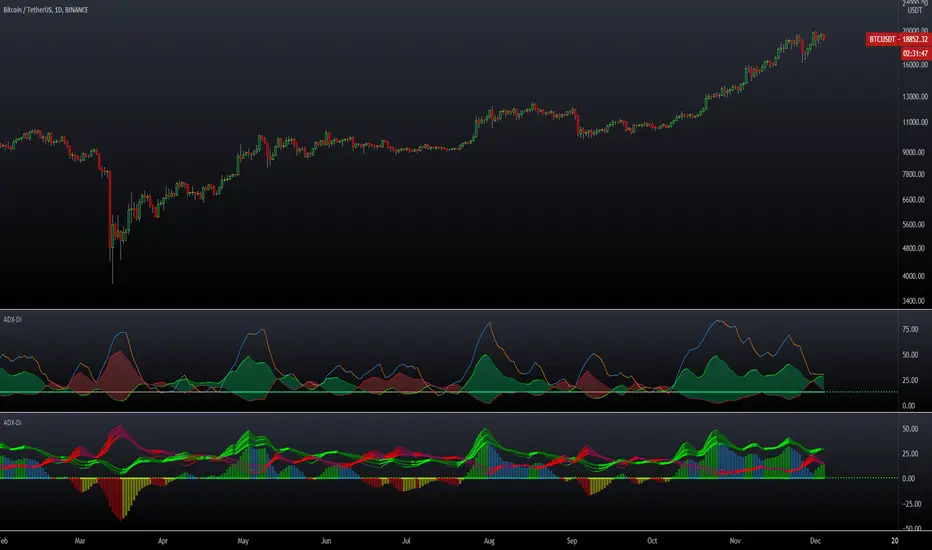
ADX DMI 3x - Dingue- ADX DMI DINGUE -
Français (bottom) / English
The best baddest - The Ultimate ADX DMI indicator for you to use.
Good to clearly see who's in control. Bear Bull
Includes :
- 3x ADX
- 3x DMI
- 3 line system which uses DMI calculation and put it in a single line instead of positive / negative.
Manual or Auto settings which adjusts length based on time frame used on screen.
Color coded for clear direction.
Squeeze shows when both sides are close together and this is when the trend might change or keep going.
Suggestions are welcome, ask below for any questions.
Try my other "DINGUE" indicators.
Thanks.
----------------- Français -----------------
Le meilleur, le plus génial - L'ultime indicateur ADX DMI pour votre utilisation
Très bon pour voir qui est en contrôle.
Inclu :
- 3x ADX
- 3x DMI
- 3 lignes qui remplace les lignes positives négatives du DMI pour une visualisation plus simple.
Paramétrage manuel ou automatique qui ajuste les valeurs selon la grandeur de chandelles utilisée à l'écran.
Codé avec des couleurs pour une visibilités de la direction claire.
Squeeze qui montre quand les 2 côtés sont près l'un de l'autre et quand un changement de contrôle ou une continuation de la tendance se produit.
Suggestions appréciées, pour toutes questions, écrire dans les commentaires plus bas.
Essayez les autres indicateurs "DINGUE".
Merci.
Search in scripts for "ai"
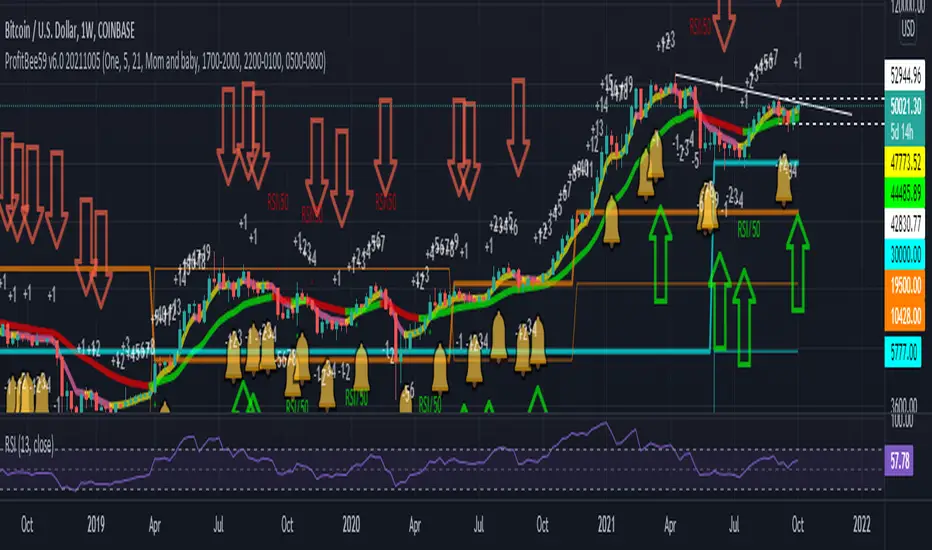
ProfitBee59 v6.0ProfitBee59 v6.0 for TradingView (pb6 ai) helps you do tedious works on your technical charts.
*It does CC59 counting and prints out a positive or negative number on each price bar.
*When the counting arrives at -9 or +9, it creates support and resistance ( SNR ) levels on the chart.
*It draws a pair of fast/slow average lines with pink/red colors for corresponding downtrend and yellow/green for uptrend.
*It shows a crossing point between fast/slow average line with a cream cross sign.
*It analyses and prints Up/Dn arrows base on each of these modes including time, price, average line turnings and crossing, above red/ below green (ARBG) candlesticks.
*It draws lines showing differences between price-fast average, price-slow average, and fast average-slow average.
*In addition, other auxiliary tools such as Max/Min finder used to find the candlesticks with local max/min prices or Gap finder used to locate discontinuity between candlesticks are also provided.
*For Forex trading, other intraday parameters are also available including the day opening level, high/low of previous days as well as intraday brown background marking overlapping sessions for Sydney-Tokyo, Tokyo-London and London-New York markets.
*Smart phone/tablet and PC notifications of events occurring in the chart can be sent to you by server-side alerts so that you don't have to stay in front of the screen all the time.
------------------------------
How to install the script:
------------------------------
*Go to the bottom of this page and click on "Add to Favorite Scripts".
*Remove older version of the script by clicking on the "X" button behind the indicator line at the top left corner of the chart window.
*Open a new chart at and click on the "Indicators" tab.
*Click on the "Favorites" tab and choose "ProfitBee59 v6.0".
*Right click anywhere on the graph, choose "Color Theme", the select "Dark".
*Right click anywhere on the graph, choose "Settings".
*In "Symbol" tab, set "Precision" to 1/100 for stock price or 1/100000 for Forex and set "Time Zone" to your local time.
*In "Scales" tab, check "Symbol Name Label" and "Indicator Last Value Label".
*In "Events" tab, check "Show Dividends on Chart", "Show Splits on Chart" and "Show Earnings on Chart".
*At the bottom of settings window, click on "Template", "Save As...", then name this theme of graph setting for future call up such as "Stock pb6" or "Forex pb6".
*Click OK.
==========================================
ProfitBee59 v6.0 for TradingView (pb6 ai) is locked and protected.
Please ***do not*** ask for access in the comment section.
Use the link below to obtain access to this indicator.
==========================================
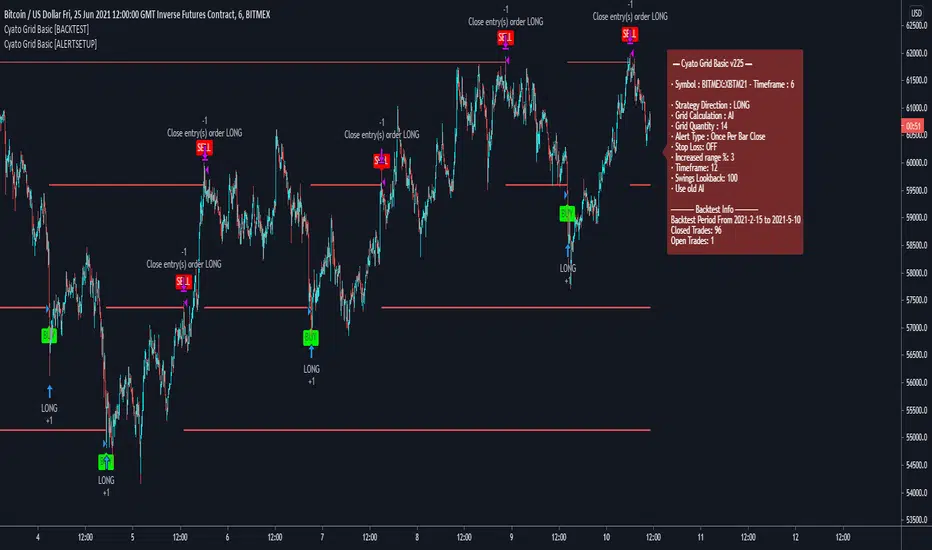
Cyato Grid Basic Buy & Sell [ALERTSETUP]Private indicator
This Grid bot strategy creates buy orders when the price goes down one level or more, and sell order when the price goes up one level or more.
To avoid useless trades, the lastest traded level is disabled until another level is crossed.
To create the grid, one upper level and one lower level is calculated. Those 2 levels are either given by the user using "MANUAL" mode or automatically calculated by an AI. The space between these two levels are then divided equally into several steps, creating the grid. The number of steps is choosen by the user, from 3 to 20.
How it Works
This is the Alert Setup version meaning this is the one you should use to create alerts (more below).
Select either "MANUAL" or "AI" mode.
When using "MANUAL", you have to configure an upper level and a lower level.
When using "AI", the upper and lower level are automatically calculated from last swing high/low.
Select the grid quantity, from 3 to 20.
Example with 3:
Example with 10:
Example with 20:
Creating the Alerts
When opening the alert popup, select "Cyato Grid" in the condition.
Make sure to use the option "Once per bar close" in order to stay in sync with the graphics on chart. (Only use "Once per bar" if you really know what you are doing).
Available alerts:
- BUY : Buy alert. Green label on chart.
- SELL: Sell alert. Red label on chart.
To get this indicator, use the link in my signature below, thanks!
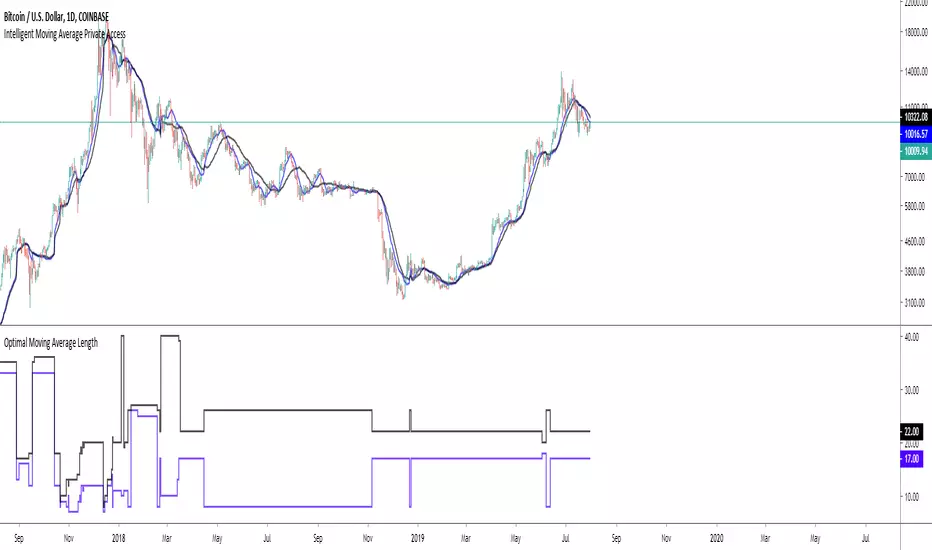
Intelligent Moving Average Private AccessNote: This indicator is intended for those who have been granted private access and may be more frequently updated than the previous versions.
Introduction
This indicator uses machine learning (Artificial Intelligence) to solve a real human problem.
The Moving Average is the most used indicator on the planet, yet no one really knows what pair of moving average lengths works best in combination with each other.
A reason for this is because no two moving averages are always going to be the best on every instrument, time-frame, and at any given point in time.
The " Intelligent Moving Average " solves the moving average problem by adapting the period length to match the most profitable combination of moving averages in real time.
How does the Intelligent Moving Average work?
The artificial intelligence that operates these moving average lengths was created by an algorithm that tests every single combination across the entire chart history of an instrument for maximum profitability in real-time.
No matter what happens, the combination of these moving averages will be the most profitable.
Can we learn from the Intelligent Moving Average?
There are many lessons to be learned from the Intelligent Moving Average. Most will come with time as it is still a new concept.
Adopting the usefulness of this AI will change how we perceive moving averages to work.
Limitations
Ultimately, there are no limiting factors within the range of combinations that has been programmed. The moving averages will operate normally, but may change lengths in unexpected ways - maybe it knows something we don't?
Thresholds
The range of moving average lengths is between 5 to 40.
Additional coverage resulted in TradingView server errors.
Future Updates!
This indicator will be maintained and many updates will come in the near future! Stay tuned.
View the documentation on this indicator here: www.kenzing.com
Well Rounded Moving AverageIntroduction
There are tons of filters, way to many, and some of them are redundant in the sense they produce the same results as others. The task to find an optimal filter is still a big challenge among technical analysis and engineering, a good filter is the Kalman filter who is one of the more precise filters out there. The optimal filter theorem state that : The optimal estimator has the form of a linear observer , this in short mean that an optimal filter must use measurements of the inputs and outputs, and this is what does the Kalman filter. I have tried myself to Kalman filters with more or less success as well as understanding optimality by studying Linear–quadratic–Gaussian control, i failed to get a complete understanding of those subjects but today i present a moving average filter (WRMA) constructed with all the knowledge i have in control theory and who aim to provide a very well response to market price, this mean low lag for fast decision timing and low overshoots for better precision.
Construction
An good filter must use information about its output, this is what exponential smoothing is about, simple exponential smoothing (EMA) is close to a simple moving average and can be defined as :
output = output(1) + α(input - output(1))
where α (alpha) is a smoothing constant, typically equal to 2/(Period+1) for the EMA.
This approach can be further developed by introducing more smoothing constants and output control (See double/triple exponential smoothing - alpha-beta filter) .
The moving average i propose will use only one smoothing constant, and is described as follow :
a = nz(a ) + alpha*nz(A )
b = nz(b ) + alpha*nz(B )
y = ema(a + b,p1)
A = src - y
B = src - ema(y,p2)
The filter is divided into two components a and b (more terms can add more control/effects if chosen well) , a adjust itself to the output error and is responsive while b is independent of the output and is mainly smoother, adding those components together create an output y , A is the output error and B is the error of an exponential moving average.
Comparison
There are a lot of low-lag filters out there, but the overshoots they induce in order to reduce lag is not a great effect. The first comparison is with a least square moving average, a moving average who fit a line in a price window of period length .
Lsma in blue and WRMA in red with both length = 100 . The lsma is a bit smoother but induce terrible overshoots
ZLMA in blue and WRMA in red with both length = 100 . The lag difference between each moving average is really low while VWRMA is way more precise.
Hull MA in blue and WRMA in red with both length = 100 . The Hull MA have similar overshoots than the LSMA.
Reduced overshoots moving average (ROMA) in blue and WRMA in red with both length = 100 . ROMA is an indicator i have made to reduce the overshoots of a LSMA, but at the end WRMA still reduce way more the overshoots while being smoother and having similar lag.
I have added a smoother version, just activate the extra smooth option in the indicator settings window. Here the result with length = 200 :
This result is a little bit similar to a 2 order Butterworth filter. Our filter have more overshoots which in this case could be useful to reduce the error with edges since other low pass filters tend to smooth their amplitude thus reducing edge estimation precision.
Conclusions
I have presented a well rounded filter in term of smoothness/stability and reactivity. Try to add more terms to have different results, you could maybe end up with interesting results, if its the case share them with the community :)
As for control theory i have seen neural networks integrated to Kalman flters which leaded to great accuracy, AI is everywhere and promise to be a game a changer in real time data smoothing. So i asked myself if it was possible for a neural networks to develop pinescript indicators, if yes then i could be replaced by AI ? Brrr how frightening.
Thanks for reading :)

Optimised Volume-weighted Moving AverageAbout
This tool measures the profitability of every volume-weighted moving average length combination for the entire history of the instrument that it is applied,
and only displays the most profitable combination in real-time which means that this indicator is fully functional for trading.
The Optimised Volume-weighted Moving Average can be tested using a Volume-weighted Moving Average Strategy and the Strategy Tester panel on any instrument or time-stamp. It will always display the lengths of the most profitable exponential moving average lengths at the current moment in time.
This can be used on its own, or paired with the Intelligent Volume-weighted Moving Average (AI) for a better understanding of the indicators movements.
The Intelligent Volume-weighted Moving Average (AI) uses this tool as a predictive method for machine learning.
Optimised Exponential Moving AverageAbout
This tool measures the profitability of every exponential moving average length combination for the entire history of the instrument that it is applied and only displays the most profitable combination in real-time meaning that this indicator is fully functional for trading.
The Optimised Exponential Moving Average can be tested using an Exponential Moving Average strategy and the Strategy Tester panel on any instrument or time-stamp. It will always display the lengths of the most profitable exponential moving average lengths at the current moment in time.
This can be used on its own, or paired with the Intelligent Exponential Moving Average (AI) for a better understanding of the indicators movements.
The Intelligent Exponential Moving Average (AI) uses this tool as a predictive method for machine learning.

Udta Teer MKCIts normal vwap which is already available in TradingView. Now we have modified it with help of AI for bands

Udta Teer Its normal vwap which is already available in tradingview. But it has added bands with help of AI

KINETIC GOLD NQ Velocity Breakout [Ash_TheTrader]
🚀 Stop Guessing. Start Scalping with Physics.
Introducing the KINETIC GOLD NQ ⚡ VELOCITY BREAKOUT System
Author: Ash_TheTrader
Assets: Gold (XAUUSD), Nasdaq (US100), Bitcoin (BTC)
Style: High-Frequency Scalping (M1/M5)
---
🛑 The Problem: Why Most Indicators Fail
You’ve been there. The RSI says "Oversold," so you buy. But price keeps crashing. The Moving Average crosses over, so you enter. But the trend is already over.
Why? Because those indicators are lagging . They tell you what happened 10 candles ago.
⚡ The Solution: The "Physics" of Price
Markets move like objects in the real world. They have Velocity (Speed) and Momentum (Mass).
The Kinetic Velocity Breakout (KMB) system doesn't look at "Overbought" or "Oversold." It looks for FORCE .
It answers one simple question: Is the market moving fast enough to pay me?
---
🧠 The 4 "Smart Logic" Features
1. The Velocity Speedometer 🏎️
Most candles are "noise." This system ignores them. It uses a Normalized Volatility Engine to detect when price hits "WARP SPEED".
• Blue: Slow (Cruising). Don't touch.
• Yellow: Accelerating. Get ready.
• Red: WARP SPEED. Institutional money is entering.
2. The 1.5x Impulse Rule 💥
The algorithm strictly enforces the "1.5x Law." A signal ONLY fires if the breakout candle is 1.5 times larger than the average of the last 3 candles.
• Result? No more fakeouts. We only trade real expansions.
3. "Smart Mode" AI Dashboard 🖥️
A heads-up display (HUD) lives on your chart, auto-detecting your trading environment:
• Auto-Session: Tells you if you are in London, New York, or Asia.
• Risk Mode: Shows if you are using "Aggressive" or "Normal" logic.
• Status: Gives you a text readout like "READY ⚡" or "WAIT..."
4. Auto-Pilot Risk Management 🛡️
Scalping is fast. You don't have time to calculate Pips.
• The script draws the lines for you.
• As soon as a "ROCKET" signal appears, a Green TP Line (2x Reward) and Red SL Line appear instantly.
---
🎮 How to Trade: The 3-Step "Kinetic" Strategy
This strategy is designed for Gold (XAUUSD) and Nasdaq (US100) on the 5-Minute Timeframe .
Step 1: The "Yellow" Warning ⚠️
Watch the Smart Structure Lines (Dashed Lines).
• If the candles turn Yellow or the Dashboard says "FAST" , wake up.
• This means pressure is building against a key level.
Step 2: The "Warp" Trigger 🚀
Wait for a Confirmed Breakout . You are looking for:
1. A candle closes OUTSIDE the dashed structure line.
2. The candle color is NEON CYAN (Bullish) or NEON MAGENTA (Bearish).
3. The Signal Label appears: "ROCKET" (Buy) or "DROP" (Sell).
👉 Rule: No Label? No Trade. The 1.5x Logic saves you from bad trades.
Step 3: The Execution 💰
1. Enter at the close of the signal candle.
2. Stop Loss: Place it exactly on the Red Line provided by the indicator.
3. Take Profit: Place it on the Green Line .
4. Walk away. Let the physics work.
---
⚙️ Customizing Your Style
The script comes with two built-in "Personalities":
🛡️ Normal Scalper (Default)
• Best for: New traders, Funded Accounts.
• Logic: Waits for strong confirmation. High Win Rate.
• Risk: 1:2 Risk/Reward.
⚠️ QuickScalper (Aggressive)
• Best for: Gold M1, Volatility Hunters.
• Logic: Enters earlier on 1.2x Impulse. More signals, faster exits.
• Risk: 1:1.5 Risk/Reward (Grab the cash and go).
---
👇 Get the Code
Search for: KINETIC ⚡ in the TradingView library.
"Markets are physics. Trade the Velocity, not the noise." — @Ash_TheTrader

Call-Put Cross Strike Match [Pro]📊 Call-Put Cross Strike Match - Professional Options Trading Indicator
Advanced NSE Options Analysis with AI-Powered Trading Signals & Dynamic Display
🎯 Overview
The Call-Put Cross Strike Match is an institutional-grade options analysis tool designed exclusively for NSE NIFTY and BANKNIFTY traders. Built on Pine Script v6, this indicator combines sophisticated cross-strike matching algorithms with intelligent trading signal generation to identify optimal options trading opportunities in real-time.
What makes it unique:
Analyzes 25 call-put combinations simultaneously
Generates actionable BUY/SELL signals using professional strategies
Fully customizable display with 9 table positions and 6 size options
Simplified setup with semi-automatic ATM detection
Clean, clutter-free interface with only essential information
Perfect for intraday scalpers, premium sellers, and positional options traders.
✨ Key Features
1. 🔍 Advanced Cross-Strike Matching Algorithm
The indicator calculates price differences for all 25 combinations (5 call strikes × 5 put strikes) and identifies the best matches based on put-call parity.
How it works:
Compares each call option price with every put option price
Calculates absolute difference: |Call - Put |
Ranks all 25 combinations from lowest to highest difference
Highlights top 3 or top 5 matches with visual checkmarks
Visual indicators:
✓✓ (Double check) = Best match (lowest price difference)
✓ (Single check) = Good matches (top 3 or top 5)
Empty cells = No match (significant price difference)
Why this matters:
When Call ≈ Put at same strike, it indicates fair pricing and synthetic position opportunities. The indicator automatically finds these opportunities across different strike combinations.
2. 🎯 Intelligent Trading Signals (Last Column)
The indicator generates professional trading recommendations based on Call-Put price difference analysis:
Signal Types:
BUY CE - Long call opportunity (bullish)
SELL CE - Short call opportunity (premium selling)
BUY PE - Long put opportunity (bearish/hedge)
SELL PE - Short put opportunity (premium selling)
BULL - Moderate bullish bias
BEAR - Moderate bearish bias
ATM - Neutral market (near parity)
NEUTRAL - No clear bias
Color-Coded for Quick Decisions:
🟩 Green = Long opportunities (BUY CE, BULL)
🟥 Red = Short call opportunities (SELL CE)
🟧 Orange = Long put opportunities (BUY PE)
🟫 Maroon = Short put opportunities (SELL PE)
⬛ Gray = Neutral zones (ATM, NEUTRAL)
3. 🤖 Three Professional Signal Modes
SMART Mode (Recommended) 🎯
Context-aware institutional strategy that considers strike position relative to spot price.
Signal Logic:
text
OTM Call Expensive (C-P > threshold, Strike > Spot):
→ SELL CE (Premium selling opportunity)
ITM Call Underpriced (C-P > threshold, Strike < Spot):
→ BUY CE (Synthetic long opportunity)
OTM Put Expensive (C-P < -threshold, Strike < Spot):
→ SELL PE (Premium selling opportunity)
ITM Put Underpriced (C-P < -threshold, Strike > Spot):
→ BUY PE (Protection or synthetic short)
Near Parity (|C-P| < threshold/4):
→ ATM (Neutral market, straddle/strangle zone)
Moderate Imbalance:
→ BULL or BEAR (Directional bias without extreme pricing)
Best for: Professional traders, option writers, synthetic position builders
MOMENTUM Mode 📈
Trend-following strategy that rides market momentum.
Signal Logic:
text
Calls Expensive (C-P > threshold):
→ BUY CE (Follow bullish momentum)
Puts Expensive (C-P < -threshold):
→ BUY PE (Follow bearish momentum)
Near Parity:
→ NEUTRAL (No clear trend)
Best for: Intraday scalpers, directional traders, swing traders
MEAN REVERSION Mode 🔄
Counter-trend strategy focused on premium selling.
Signal Logic:
text
Calls Overpriced (C-P > threshold):
→ SELL CE (Collect inflated premium)
Puts Overpriced (C-P < -threshold):
→ SELL PE (Collect inflated premium)
Near Parity:
→ ATM (Fair value, no edge)
Best for: Option writers, theta decay strategies, credit spread traders
4. 🎨 Fully Customizable Display
Dynamic Table Positioning (9 Options):
Top: left, center, right
Middle: left, center, right
Bottom: left, center, right
Choose position based on your chart layout and other indicators.
Dynamic Table Sizing (6 Options):
Auto - Adapts to content
Tiny - Minimal space (for cluttered charts)
Small - Default, best balance
Normal - Medium size (1080p monitors)
Large - Big text (4K monitors)
Huge - Maximum size (presentations)
Text scales intelligently:
Headers, data, and checkmarks adjust proportionally
Checkmarks remain visible even in tiny mode
Info row stays readable at all sizes
5. ⚙️ Simplified Input System
Auto Mode (Recommended):
Enter just 5 strikes once at market open - used for both calls and puts.
Example for NIFTY at 25,900:
text
Strike 1: 25850 (ATM - 100)
Strike 2: 25900 (ATM - 50)
Strike 3: 25950 (ATM)
Strike 4: 26000 (ATM + 50)
Strike 5: 26050 (ATM + 100)
Manual Mode (Advanced):
Enter separate call and put strikes for cross-strike arbitrage analysis.
Why this matters:
50% fewer inputs compared to traditional indicators
One-time setup at market open
Rarely needs updating (only if market moves 100+ points)
6. 🎛️ Semi-Automatic ATM Detection
The indicator automatically:
Detects current NIFTY/BANKNIFTY spot price
Calculates ATM strike (rounded to nearest 50 or 100)
Marks ATM strikes with *ATM in the table
Displays ATM and spot price in info box
No manual recalculation needed!
7. 📊 Clean Information Display
Main Table (Top/Middle/Bottom):
CE \ PE matrix showing all strike combinations
Checkmarks (✓✓ and ✓) highlighting best matches
SIGNAL column with color-coded trading recommendations
Best Match footer showing optimal combination
Info row displaying symbol, signal mode, and spot price
Info Box (Bottom Left):
Symbol (NIFTY/BANKNIFTY)
Signal Mode (Smart/Momentum/Mean Reversion)
Current Spot Price
Detected ATM Strike
Best Matched Call Strike
Best Matched Put Strike
Match Difference
C-P value for best match
📋 Quick Setup Guide (3 Steps)
Step 1: Add Indicator
Open NIFTY or BANKNIFTY chart on TradingView
Add "Call-Put Cross Strike Match " from indicators
Step 2: Configure Basic Settings
text
Symbol Detection: Auto (reads from chart)
Expiry Date: 251219 (format: YYMMDD for 19-Dec-2025)
Strike Mode: Auto
Strike Interval: 50 (for NIFTY) or 100 (for BANKNIFTY)
Step 3: Enter Strikes
At market open (9:15 AM), check current price and enter 5 strikes:
text
Example: NIFTY at 25,937
Strike 1: 25850 (ATM - 100)
Strike 2: 25900 (ATM - 50)
Strike 3: 25950 (ATM) ← Rounded to nearest 50
Strike 4: 26000 (ATM + 50)
Strike 5: 26050 (ATM + 100)
That's it! The indicator handles everything else automatically.
💡 Real-World Use Cases
1. 📉 Premium Selling (Mean Reversion Mode)
Scenario: Looking for overpriced options to write
How to use:
Set Signal Mode to "Mean Reversion"
Set Threshold: 30 (NIFTY) or 75 (BANKNIFTY)
Look for SELL CE or SELL PE signals with ✓ or ✓✓
Sell naked options or credit spreads at those strikes
Target 30-50% profit or 3-5 days theta decay
Perfect for: Credit spreads, iron condors, covered calls, naked puts
2. 📈 Directional Trading (Momentum Mode)
Scenario: Scalping intraday moves
How to use:
Set Signal Mode to "Momentum"
Set Threshold: 15 (aggressive) or 25 (conservative)
BUY CE signal + ✓✓ = Long call entry
Enter with tight stop (20% of premium)
Target 30-50% gain within 1-2 hours
Perfect for: Intraday scalping, swing trading, trend following
3. 🔄 Synthetic Positions (Smart Mode)
Scenario: Building synthetic long/short with defined risk
How to use:
Set Signal Mode to "Smart"
Look for BUY CE at ITM strike + SELL PE at OTM strike
Both should have ✓ indicator (good parity)
Creates synthetic long position
Lower capital than buying futures
Perfect for: Professional traders, arbitrage, capital efficiency
4. ⚖️ ATM Strategy Optimization (Smart Mode)
Scenario: Finding optimal strikes for straddle/strangle
How to use:
Identify strike marked *ATM
Check if signal shows ATM (balanced market)
If BULL/BEAR → Market has directional bias, adjust accordingly
✓✓ indicates best matched strike for neutral strategies
Perfect for: Volatility trading, earnings plays, event trading
5. 🛡️ Hedging Optimization (Smart Mode)
Scenario: Protecting long equity positions
How to use:
Look for BUY PE signals (protection signals)
Avoid strikes with SELL PE (expensive hedges)
✓✓ shows best value for hedge entry
Optimize hedge timing and strike selection
Perfect for: Portfolio hedging, risk management, protective puts
⚙️ Settings Guide
Symbol Settings
Symbol Detection: Auto (recommended) or Manual
Manual Symbol: NIFTY or BANKNIFTY
Expiry Date: Format YYMMDD (e.g., 251219 = 19-Dec-2025)
Update every Thursday after 3:30 PM for next week's expiry
Strike Settings
Strike Mode: Auto (recommended) or Manual
Strike Interval:
50 for NIFTY
100 for BANKNIFTY
Trading Signals
Signal Mode: Smart / Momentum / Mean Reversion
Smart: Professional institutional strategy (default)
Momentum: Trend-following for scalpers
Mean Reversion: Premium selling for writers
Signal Threshold: Sensitivity in points
NIFTY Recommendations:
Conservative: 30-40 points (fewer, higher quality signals)
Balanced: 20-25 points (default)
Aggressive: 10-15 points (more signals, more noise)
BANKNIFTY Recommendations:
Conservative: 75-100 points
Balanced: 50-60 points (default)
Aggressive: 30-40 points
Algorithm Settings
Matching Mode:
Top 3: Shows 3 best matches (cleaner display)
Top 5: Shows 5 best matches (more opportunities)
Display Settings
Show Matching Table: Enable/disable main table
Table Position: Choose from 9 positions
top_right (default) - Doesn't block price action
middle_right - Centered vertical view
bottom_right - If top is crowded
Table Size: Choose from 6 sizes
small (default) - Best for most users
normal - For 1080p/4K monitors
tiny - If you have many indicators
📊 Understanding The Table
Table Layout Example:
text
CE \ PE | 25950 | 25900 | 25850 | 26000 | 26050 | SIGNAL
---------|-------|-------|-------|-------|-------|--------
25850 | | | | | | SELL PE
25900*ATM| | ✓ | | | | ATM
25950 | ✓✓ | | | | | BULL
26000 | | | | ✓ | | BUY CE
26050 | | | | | | SELL CE
---------|-------|-------|-------|-------|-------|--------
Best Match: 25950 / 25950 (0.25)
Info: NIFTY | Smart | Spot:25881.9
Reading the Table:
Rows (Left): Call option strike prices
Columns (Top): Put option strike prices
Cells: Checkmarks where Call ≈ Put
✓✓: Best match (minimum price difference)
✓: Good matches (top 3 or 5)
Empty: Prices too different (no match)
*ATM: Automatically detected at-the-money strike
SIGNAL Column: Actionable trading recommendation for each call strike
Info Box Metrics:
Symbol: Currently analyzed index
Signal Mode: Active strategy
Spot: Current underlying price
ATM: Calculated at-the-money strike
Best Call: Matched call strike
Best Put: Matched put strike
Match Diff: Price difference (lower = better)
C-P (Best): Call minus Put for best match
📈 Best Practices
Strike Selection & Maintenance
At Market Open (9:15 AM):
Check current price (e.g., NIFTY at 25,937)
Round to nearest interval (25,950 for 50 interval)
Enter 5 strikes: -100, -50, 0, +50, +100 from ATM
Update Frequency:
Usually no update needed entire day
Update only if market moves 100+ points from initial ATM
Typically 0-2 updates per trading session
Signal Interpretation by Confidence Level
High Confidence (✓✓ + Signal):
Best match indicator present
Strongest signal quality
Highest probability setup
Medium Confidence (✓ + Signal):
Good match present
Reliable signal
Acceptable risk/reward
Low Confidence (Signal without ✓):
No match indicator
Strike far from parity
Requires additional confirmation
Risk Management Rules
Never trade signals blindly. Always:
✅ Confirm with price action and support/resistance
✅ Check overall market trend (NIFTY/BANKNIFTY direction)
✅ Consider time decay (theta) for your position
✅ Monitor IV changes (implied volatility)
✅ Use proper position sizing (1-2% risk per trade)
✅ Set stop losses (20-30% of premium for longs)
✅ Have profit targets (30-50% for scalps)
Timeframe Selection
Intraday Trading:
Use 5-minute or 15-minute chart
Momentum or Smart mode
Lower threshold (aggressive)
Quick entries and exits
Positional Trading:
Use hourly or daily chart
Smart or Mean Reversion mode
Higher threshold (conservative)
Swing trade positions
Combining with Other Tools
Recommended complements:
Support/resistance levels (horizontal lines)
Trend indicators (EMA 20/50, SuperTrend)
Volume analysis (confirm breakouts)
India VIX (volatility context)
Option chain data (open interest)
🎓 Strategy Examples
Strategy 1: Professional Premium Selling
text
Mode: Mean Reversion
Threshold: 30 (NIFTY) / 75 (BANKNIFTY)
Timeframe: Daily
Rules:
1. Wait for SELL CE or SELL PE signal
2. Verify strike has ✓ or ✓✓ (good parity)
3. Check if OTM (Strike away from spot)
4. Sell option or create credit spread
5. Target: 30-50% profit or 3-5 days theta
6. Stop: If signal changes to BUY
Position: Naked short or credit spreads
Risk: Define with spreads or capital allocation
Strategy 2: Intraday Momentum Scalping
text
Mode: Momentum
Threshold: 15 (aggressive)
Timeframe: 5-minute
Rules:
1. Wait for BUY CE signal + ✓✓
2. Enter long call immediately
3. Stop loss: 20% of premium paid
4. Target 1: 30% gain (partial exit)
5. Target 2: 50% gain (full exit)
6. Exit if signal changes or 2 hours pass
Position: Long calls or long puts only
Risk: 1-2% of capital per trade
Strategy 3: Synthetic Long Position
text
Mode: Smart
Threshold: 25 (NIFTY) / 60 (BANKNIFTY)
Timeframe: Hourly
Rules:
1. Identify BUY CE signal at ITM strike
2. Identify SELL PE signal at OTM strike
3. Both should have ✓ indicator
4. Buy ITM call + Sell OTM put = Synthetic Long
5. Lower capital than futures
6. Defined risk (width of strikes)
Position: Call debit + Put credit
Risk: Net debit paid (defined risk)
Strategy 4: ATM Straddle Entry
text
Mode: Smart
Threshold: 20 (default)
Timeframe: Daily
Rules:
1. Find strike marked *ATM
2. Check signal shows "ATM" (neutral)
3. Verify ✓✓ at that strike
4. Sell ATM call + Sell ATM put
5. Collect maximum premium
6. Exit at 30% profit or before expiry
Position: Short straddle or iron condor
Risk: Use defined risk (iron condor recommended)
🔔 Important Notes
Data Accuracy
Indicator uses TradingView's NSE options data feed
Always verify prices independently before trading
Ensure market is open (9:15 AM - 3:30 PM IST)
Check for "-" in cells indicating missing data
Expiry Management
Update expiry date every week on Thursday post-closing
Format: YYMMDD (6 digits)
Weekly expiry: Every Thursday
Monthly expiry: Last Thursday of month
Strike Format
NIFTY: Multiples of 50 (25850, 25900, 25950...)
BANKNIFTY: Multiples of 100 (51800, 51900, 52000...)
Wrong strikes = No data in table
Performance Optimization
Indicator updates every bar close
No lag or performance issues
Works on all timeframes (1m to 1D)
Maximum 5 calls + 5 puts = 10 security calls (within limits)
⚠️ Disclaimer
Trading options involves substantial risk of loss and is not suitable for all investors. This indicator is provided for educational and informational purposes only. It does not constitute financial advice, investment advice, or trading advice.
Important disclaimers:
Options can expire worthless, resulting in 100% loss
Past performance of signals is not indicative of future results
Accuracy depends on TradingView's NSE data feed
Signals are mathematical analysis, not predictions
You are solely responsible for your trading decisions
The developer is not liable for any trading losses incurred while using this indicator.
Before trading, ensure you understand:
Options Greeks (Delta, Gamma, Theta, Vega, Rho)
Implied volatility and its impact
Time decay and expiration risks
Assignment risk for short positions
Liquidity and slippage considerations
Margin requirements and capital needs
Always:
Use proper risk management (1-2% per trade)
Trade with capital you can afford to lose
Paper trade before live trading
Consult with a licensed financial advisor
Start with small position sizes
Never risk more than you can afford to lose
📊 Technical Specifications
Platform: TradingView Pine Script v6
Exchanges: NSE (National Stock Exchange of India)
Instruments: NIFTY, BANKNIFTY options
Timeframes: All (1m, 5m, 15m, 1h, 1D)
Strikes Analyzed: 5 calls × 5 puts = 25 combinations
Security Calls: 10 (5 calls + 5 puts)
Table Positions: 9 (all corners and centers)
Table Sizes: 6 (auto to huge)
Signal Modes: 3 (Smart, Momentum, Mean Reversion)
Performance: Optimized, minimal lag
🎯 Who Should Use This?
✅ Perfect For:
Options Traders: Intraday and positional
Premium Sellers: Option writers and theta strategists
Arbitrage Traders: Synthetic position builders
Straddle/Strangle Traders: ATM strategy traders
Professional Traders: Institutional-grade analysis
Volatility Traders: IV imbalance exploiters
Scalpers: Quick intraday moves
❌ Not Suitable For:
Stock options traders (NSE index-specific)
Equity-only traders (requires options knowledge)
International markets (NSE format only)
Complete beginners (requires basic options understanding)
💬 FAQ
Q: Why manual strike entry? Why not fully automatic?
A: Pine Script's type system limits fully automatic strike generation from live data. However, setup takes just 30 seconds once at market open, and the indicator handles all analysis automatically throughout the day.
Q: How often should I update strikes?
A: Rarely! Only when market moves 100+ points from initial ATM. Usually 0-2 times per day, even in volatile markets.
Q: Which Signal Mode is best?
A: Smart mode (default) for professional trading. Use Momentum for intraday scalping, Mean Reversion for premium selling.
Q: Can I use this for stock options?
A: No. The indicator is designed specifically for NSE index options (NIFTY and BANKNIFTY) with NSE format.
Q: Does it work on mobile?
A: Yes, but table display is optimized for desktop/tablet screens. Use "tiny" or "small" size on mobile.
Q: What if I see "-" in cells?
A: Check expiry format (YYMMDD), verify strikes match NSE strikes, and ensure market is open.
Q: What's the difference between ✓✓ and ✓?
A: ✓✓ = Best match (lowest price difference), highest quality. ✓ = Good matches (top 3-5), reliable quality.
Q: Can I backtest this indicator?
A: The indicator shows live analysis. For backtesting options strategies, you'll need historical options data and separate backtesting tools.
Q: What does the info box show?
A: Bottom-left box shows key metrics: symbol, signal mode, spot price, ATM strike, best matched strikes, match difference, and C-P value.
Q: Why no chart plotting?
A: v1.0 focuses on clean table display with maximum information density. Chart plotting may be added in future versions based on user feedback.
🙏 Credits
Developed by a professional options trader for the Indian trading community. Inspired by institutional trading desks and market makers who use call-put parity for daily trading decisions.
Found This Helpful?
⭐ Rate 5 stars if it improved your trading
💬 Comment with your strategy results
🔔 Follow for updates and new indicators
📢 Share with fellow options traders
Feature Requests
Continuous improvement based on trader feedback. Suggest features in comments!
Planned Features (v2.0):
Multi-expiry comparison
Greeks display (Delta, Theta, Vega)
Historical signal performance stats
Custom signal formulas
Export to CSV functionality
🏷️ Tags for Search
#Options #OptionsTrading #NIFTY #BANKNIFTY #NSE #India #OptionChain #CallPut #PutCallParity #Straddle #Strangle #ATM #TradingSignals #OptionsStrategy #PremiumSelling #OptionsScanner #Derivatives #IntradayTrading #VolatilityTrading #Arbitrage #SyntheticPosition #OptionsGreeks #OptionsSelling #OptionsWriting #IndianStockMarket #NSEOptions #OptionsAnalysis #TechnicalAnalysis #AlgoTrading #QuantTrading #ProfessionalTrading #TradingIndicator #PineScript #TradingView
📝 Version History
v1.0 (Current - Dec 2025)
Pine Script v6 implementation
Cross-strike matching (5×5 matrix, 25 combinations)
Three signal modes (Smart, Momentum, Mean Reversion)
Trading signal generation with color coding
Dynamic table positioning (9 positions)
Dynamic table sizing (6 sizes)
Intelligent text scaling
Semi-automatic ATM detection
Auto symbol detection
Simplified input system (50% fewer inputs in Auto mode)
Clean information display
Info box with key metrics
NSE NIFTY & BANKNIFTY support
Start trading smarter with institutional-grade options analysis! 📈💰🚀
Disclaimer: Options trading is subject to market risk. Please read all scheme-related documents carefully before investing.

Chartology Strategy+🔍 Chartology Strategy+
This tool provides a comprehensive way for users to analyze trend levels and access other Matrix features across selected tickers and timeframes. Results can be tailored by strategy, with the option to filter displayed tickers based on custom user‑defined rules.
Bullish & Bearish Entry Signal (Safe & Scalping).
Entry Level, SL, T-SL & Two TP Levels (Based on Possible Movement).
Dashboard Table for Easy Presentation of All Levels.
Timeframe Scanner for Current Signal (Trend) on Different Timeframes.
Gap Up & Gap Down for Untraded Price Marking.
Institutional Candles for High Volume and Big Price Movement.
Neutral Candle for Low Volume and Small Price Movement.
Supply Demand (Based on Swing High & Low).
Mega Trend Band (Based on HMA) for Overall Trend.
🟢 Bullish & Bearish Entry Signals
Shows the expected direction of the symbol. It shows Bullish and Bearish direction mark on Chart. Entry Level is Closing of the Candle.
Input Settings
Signal Type: Safe
Appears after a proper trend confirmation.
Low frequency, fewer signals, but more reliable.
Best for swing traders who want strong confirmation before entering.
Signal Type: Scalping
Appears frequently during small downward moves.
High frequency, quick signals for short-term trades.
Best for intraday
Traders who want multiple opportunities in small movements.
🎯 Entry Level, SL, T-SL & TP Levels
Generated based on price movement and trend range.
Levels on Chart
Entry Level: Closing price of the candle where the signal appears.
SL (Stop Loss): Maximum risk allowed for the trade.
TSL (Trailing SL): Dynamic SL to reduce risk and lock profits.
Level 01: First TP level with 1:1 risk-reward ratio. Used for partial booking.
Level 02: Final TP level for full exit.
Input Settings
Levels: You can Increase or Decrease Level Amount for the Level 2.
Risk: You can Increase or Decrease Stop Loss (SL).
📊 Dashboard Table for Easy Presentation of All Levels.
Displays all key levels and metrics in one place:
Metrics
Symbol Name Shows the name of the current chart (e.g., NIFTY, BANKNIFTY).
Bar Age Displays the How many candles (Bars) before Latest signal appears.
Entry Shows the entry level where the latest bullish or bearish signal was generated.
Level 1 (TP1) First target level, based on 1:1 risk-reward ratio. Used for partial booking to secure profits.
Level 2 (TP2) Final target level where you can exit the remaining position.
SL (Stop Loss) Shows the maximum risk limit for the trade. Helps you control losses.
MTM (Mark to Market) Shows the difference between CMP and Entry Level. Helps track how far price has moved since entry.
P&L (Profit & Loss) Shows the difference between Entry and Target Level achieved. Helps measure actual gain or loss.
Date & Time Displays when the latest bullish or bearish signal was generated. Helps check how old or fresh the signal is.
Timeframe Scanner or Current Signal (Trend) on Different Timeframes. Shows the current signal across multiple timeframes.
Row 1 Fixed signals for 1M and 3M.
Row 2 Any 2 Custom Timeframes chosen in input settings.
Traders use this to confirm signals across different timeframes before entering trades. Example If the Day trend is bullish but the 15M chart shows bearish, many traders avoid that trade.
🚦 Gap Up & Gap Down for Untraded Price Marking.
Marks untraded price zones where price may react.
Gap Up & Down Flag Mark
Gap Up: Bullish Bias, Marked Green flag, plotted when candle opens above previous high.
Gap Down: Bearish Bias, Marked as Red flag, plotted when candle opens below previous low.
Input Settings
Enable / Disable from Chart
Threshold: Minimum gap size Threshold to detect
🟡 Institutional Candles for High Volume and Big Price Movement
Indicate strong price movement with high volume.
Marking
Displayed as Yellow Body Candles
Helps identify zones where big players are active.
Input Settings
Enable / Disable from Chart
Body %: Compare of Open & Close with High & Low
Size %: Compare Total Candle Size from Past Range
Volume %: Compare Total Candle Volume from Past Range
⚪ Neutral Candle for Low Volume and Small Price Movement
Shows low volume and minimal price movement.
Marking
Displayed as Hollow Body Candles
Traders usually avoid trading during these candles.
Input Settings
Enable / Disable from Chart.
Candle %: Compare Size of candles.
Volume %: Compare Volume of Candles from Previous Range.
🟥🟩 Supply Demand Zones (Based on Swing High & Low).
Based on swing highs and lows to identify possible reversals.
Zones
🟥Supply Zone: Near swing high, marked with Light Red Zone.
🟩Demand Zone: Near swing low, marked with Light Green Zone.
Input Settings:
Bars Left: How many past Bars Swing will Calculate.
Bars Right: After How many Bars, Zone will plot.
Max Zones: Number of Supply or Demand Zone want to plot on Chart
Delete Breaked Zones: Want to see Disappeared Zone, Uncheck it.
Extend Right: Want to see till End of the Chart, Uncheck it.
📈 Mega Trend Band (Based on HMA) for Overall Trend
Based on HMA (Hull Moving Average) to show overall trend and Help in Filters out trades against the main trend.
Working
Price above band → Bullish trend
Price below band → Bearish trend
Input Setting
Enable / Disable from Chart
HMA Period Setting: 45
👓 How to Use All together for Better Confidence.
🔍Watch for the New Entry icon on the chart.
Find New Signals with help of Automated Alerts.
Check Entry Level, SL, Level 1 and Level 2 (TP2).
Verify Date & Time → how fresh the signal is. Signal not too old.
🧭 Signal is not Self Sufficient for Good Accuracy. So, we suggest a few rules.
Cross‑Check Current Signal with Timeframe Scanner. Trade only when smaller timeframe aligns with bigger trend. (e.g., If Day = Bullish ▲ but 15M = Bearish ▼, avoid entry. Trend may not be stronger.)
Validate with Market Context of Gap. (e.g., If new signal came on Gap Up / Gap Down, avoid entry. Price may reverse.)
Zone Awareness Use Supply Demand zones to refine entries/exits and avoid false signals. (e.g., Entry: If any zone is available between Entry and Level 01, Avoid trade until Zone breaked, Exit: If Zone create between the trade, modify SL according to T-SL and wait.
Trend Filter of overall direction. (e.g., If Mega Trend Band Bullish and Trend is Bearish, Avoid the Trade.)
🕵🏻 Quick Checklist Before Trade
Bullish or Bearish signal?
Dashboard Table shows fresh entry?
SL defined and acceptable risk?
Timeframe Scanner aligned?
No Neutral candle interference?
Institutional candle or Gap supports move?
Supply/Demand zone not against trade?
✅ All Okay - Go for the ENTRY
Set a Proper Entry Point
Always respect SL, Good Trader Never avoid it.
Book partial profits at Level 1, It secure your Trade.
Keep Modifying your SL, According to T-SL Level.
On Level 2, Exit remaining All position for full profit.
📊 Healthy Trading Tips
Risk Small: Never risk more than 1–2% per trade.
Size Smart: Adjust position size to volatility and account size.
Diversify: Don’t put all money in one asset/sector.
Plan Ahead: Set entry, exit, and stop‑loss before trading.
Trade Less: Focus on quality setups, avoid overtrading.
Use Both Analyses: Combine technical charts with fundamental news/events.
Control Emotions: Stick to strategy, avoid fear/greed.
Journal Trades: Record reasons, outcomes, and lessons.
Stay Informed: Track economic calendars and global events.
Take Breaks: Step away after wins/losses to reset.
🎯 Advanced Discipline
Partial Exit: Book profits in stages (e.g., 50% at 1:1, 50% at Final Level).
Check News: Avoid trading during major announcements.
No Tweaks: Don’t change plan mid‑trade; wait for SL/TP.
Fixed Rules: Trade with fixed risk, fixed gains.
No Averaging Losses: Close bad trades, don’t add more.
Keep Learning: Evolve strategy with market changes.
Believe: Trust your plan and process.
Backtest: Practice setups until they’re second nature.
Daily Routine: Pre‑market Preparation, post‑market review.
Optimize Setup: Clean workspace, fast platform, no distractions.
Track Metrics: Win rate, average reward, expectancy, time of day, setup performance.
Trader Identity: Follow rules; money is a byproduct.
Liquidity Check: Avoid low‑volume instruments.
Respect Trend: Trade with momentum, not against it.
Avoid Over‑Leverage: Keep leverage low, avoid margin unless planned.
Risk Disclaimer
This content, including any tools, software, datafeeds, indicators, or scanners, is provided strictly for charting, educational, informational, and paper‑trading purposes only. It does not constitute investment advice, buy/sell recommendations, or real‑money trading strategies.
Not Advisors: We are not registered as investment advisors or research analysts.
Charting Only: Use is limited to testing strategies and evaluation; any application to real trading is at the user’s sole risk.
No Liability: No liability is accepted for financial loss, trading loss, or damages arising from use of the tools or data.
Data Limitations: Market data may be delayed, inaccurate, or incomplete. Past or hypothetical performance is not indicative of future results.
Signals Disclaimer: Automated signals are for evaluation only and should not be treated as accurate or real trading instructions.
High Risk: Trading and investing involve substantial risk and can result in losses beyond the initial capital.
Independent Judgment: Users must exercise independent judgment and consult licensed professionals before making financial decisions
⚠️ Final Note: Trading is speculative and may not be suitable for all investors. Use only risk capital and never invest money you cannot afford to lose.
✅ Always remember🧠 my 3R Rule💡: If the money💰 is yours then, RISK⚖️, REWARD🏆 and REGRET😔 are solely yours. 🔥

Ultimate Adaptive RSIUltimate Adaptive RSI
RSI That Adapts to Any Market
This isn't your grandpa's RSI. It dynamically adjusts its sensitivity based on market conditions—smoother in trends, responsive in ranges.
Traditional RSI fails in strong trends and changing volatility. UA-RSI fixes both by adapting its sensitivity in real-time, giving you reliable signals whether the market is trending, ranging, or transitioning between regimes.
How It Adapts:
Smart Pre-Smoothing: Uses Efficiency Ratio to detect trend strength and automatically lengthens/shortens its smoothing window.
Dominant Cycle Detection: Matches its internal period to the market's actual rhythm.
Dynamic Bands: RMS-based overbought/oversold levels that expand/contract with volatility.
Smoothing Stack: ALMA pre-smoothing → Ultimate Smoother → Jurik filter creates the cleanest RSI you've ever seen.
Trade Signals:
Buy: RSI crosses above lower band or midline + price confirms
Sell: RSI crosses below upper band or midline + price confirms
Bands expand in high volatility → wait for deeper extremes
Bands contract in low volatility → take earlier signals
Signal line for crossover entries
Adaptive smoothing = fewer false signals in trends
Day trading: Use 1.0 band multiplier
Swing trading: Use 1.2-1.5 multiplier
Ranging markets: Lower multiplier to 0.8
Trending markets: Raise multiplier to 1.5+
Bands widen in volatility = wait for deeper extremes
Bands tighten in calm markets = take earlier signals
Never trade RSI alone - always wait for price confirmation

online Moment-Based Adaptive Detection🙏🏻 oMBAD (online Moment-Based Adaptive Detection): adaptive anomaly || outlier || novelty detection, higher-order standardized moments; at O(1) time complexity
For TradingView users: this entity would truly unleash its true potential for you ‘only’ if you work with tick-based & seconds-based resolutions, otherwise I recommend to keep using original non-online MBAD . Otherwise it may only help with a much faster backtesting & strategy development processes.
...
Main features :
O(1) time complexity: the whole method works @ O(1) time complexity, it’s lighting fast and cheap
HFT-ready: frequency, amount and magnitude of data points are irrelevant
Axiomatic: no need to optimize or to provide arbitrary hyperparameters, adaptive thresholds are completely data-driven and based on combination of higher-order central moments
Accepts weights: the method can gain additional information by accepting weights (e.g. volume weighting)
Example use cases for high-frequency trading:
Ordeflow analysis: can be applied on non-aggregated flow of market orders to gauge its imbalance and momentum
Liquidity provision: can be applied to high-resolution || tick data to place and dynamically adjust prices of limit orders
ML-based signals: online estimates of higher-order central moments can be used as features & in further feature engineering for trading signal generation
Operation & control: can be applied on PnL stream of your strategy for immediate returns analysis and equity control
Abstract:
This method is the online version of originally O(n) MBAD (Moment-Based Adaptive Detection) . It uses higher-order central & standardized moments to naturally estimate data’s extremums using all data while not touching order-statistics (i.e. current min and max) at all. By the same principles it also estimates “ever-possible” values given the data-generating process stays the same.
This online version achieves reduced time complexity to O(1) by using weighted exponential smoothing, and in particular is based on Pebay et al (2008) work, which provides mathematically correct results for the moments, and is numerically stable, unlike the raw sum-based estimates of moments.
Additionally, I provide adjustments for non-continuous lattice geometry of orderbooks, and correct re-quantization math, allowing to artificially increase the native tick size.
The guidelines of how to adjust alpha (smoothing parameter of exponential smoothing) in order to completely match certain types of moving averages, or to minimize errors with ones when it’s impossible to match; are also provided.
Mathematical correctness of the realization was verified experimentally by observing the exact match with the original non-recursive MBAD in expanding window mode, and confirmed by 2 AI agents independently. Both weighted and non-weighted versions were tested successfully.
...
^^ On micro level with moving window size 1
^^ With artificial tick size increase, moving window size 64
^^ Expanding window mode anchored to session start
^^ Demonstrates numerical stability even on very large inputs
...
∞

🐋 MACRO POSITION TRADER - Quarterly Alignment 💎Disclaimer: This tool is an alignment filter and educational resource, not financial advice. Backtest and use proper risk management. Past performance does not guarantee future returns.
so the idea behind this one came from an experience i had when i first started learning how to trade. dont laugh at me but i was the guy to buy into those stupid AI get rich quick schemes or the first person to buy the "golden indicator" just to find out that it was a scam. Its also to help traders place trades they can hold for months with high confidence and not have to sit in front of charts all day, and to also scale up quickly with small accounts confidently. and basically what it does is gives an alert once the 3 mo the 6 mo and the 12 mo tfs all align with eachother and gives the option to toggle on or off the 1 mo tf as well for extra confidence. Enter on the 5M–15M after a sweep + CHOCH in the direction of the aligned 1M–12M bias. that simple just continue to keep watching key levels mabey take profit 1-2 weeks and jump back in scaling up if desired..easy way to combine any small account size.
Perfect balance of:
low risk
high R:R
optimal precision
minimal chop
best sweep/CHOCH clarity
hope you guys enjoy this one.

EMA Crossover CandlesEMA Crossover Candles
This indicator colors your chart candles based on the relationship between two Exponential Moving Averages (EMAs).
How It Works
Green Candles - When the Fast EMA is above the Slow EMA, indicating bullish momentum
Red Candles - When the Fast EMA is below the Slow EMA, indicating bearish momentum
Settings
Source - The price data used for EMA calculations (default: close)
Fast Length - Period for the fast EMA (default: 5)
Slow Length - Period for the slow EMA (default: 10)
How To Use
This indicator provides a quick visual reference for trend direction. Green candles suggest the short-term trend is bullish, while red candles suggest bearish conditions. This can help you:
Identify trend direction at a glance
Filter trades in the direction of the trend
Spot potential trend changes when candle colors shift
Tips
Adjust the Fast and Slow Length settings to match your trading timeframe
Shorter periods = more responsive but more false signals
Longer periods = smoother but slower to react to trend changes
Consider hiding default candles in Chart Settings for a cleaner look
Note: This indicator is for informational purposes only and should not be used as the sole basis for trading decisions. Always use proper risk management and consider combining with other forms of analysis.
Feel free to modify this to match your style or add any additional details you'd like to include.Claude is AI and can make mistakes. Please double-check responses. Opus 4.5

SM Screener — Alert Engine (Tiered)🔥 Momentum Radar — Powered by My Premium All-In-One Signal Engine
This isn’t just another screener.
This is the official early-warning radar that plugs directly into my Premium All-In-One Buy/Sell Signal Tool.
The Premium version is where the real executions happen — the legitimate Buy and Sell signals, trend flips, squeeze confirmations, BOS/CHOCH tracking, and high-accuracy momentum logic.
But this?
This is the scanner that tells you where to look BEFORE the big move happens.
If the Premium tool is the weapon…
this screener is the radar locking onto targets.
🚀 What It Actually Does
It monitors every ticker on your chart and fires alerts the moment a symbol starts showing:
✔ Early momentum ignition
✔ Rising relative volume
✔ Trend pressure shifting
✔ Volatility expansion
✔ Early squeeze build-up
✔ Clustered signal behavior
✔ High-tier conviction score
These alerts tell you exactly which tickers to pull up in your Premium tool so you can inspect the chart deeper with full confirmation.
If you're serious about catching explosive moves, this combo is unreal.
💥 Designed for Traders Who Want the Monster Moves
This system is built for the same plays that create legends — the massive momentum runners and wild squeezes like the $4 → $400+ SMX eruption.
The goal is simple:
**Find the move early.
Confirm it with the Premium tool.
Then ride it with confidence.**
⚡ Alert Engine That Feels Like Insider Info
Every alert is laser-targeted:
🔥 Early Interest — tells you something is heating up
🔥 Entry Signal — means the ticker is firing on all cylinders
🔥 Volume bursts
🔥 Momentum flips
🔥 High conviction score
🔥 Trend strength alignment
You get notified instantly so you never miss the tickers entering “potential explosion mode.”
Perfect for:
→ Custom automation
→ Watchlist building
📈 A Complete Momentum Ecosystem
This isn’t a standalone indicator — it’s part of a full ecosystem:
1️⃣ The Premium All-In-One Tool (master)
→ Generates true Buy/Sell signals
→ Full trend model
→ Squeeze engine
→ Premium/discount logic
→ Volume & volatility confirmation
→ BOS/CHOCH structure tracking
2️⃣ THIS Screener Engine (scanner)
→ Alerts you which tickers deserve attention
→ Filters out noise
→ Points you to the potential runners
→ Helps you never miss the early setups
Together, they’re unreal.
⭐ Follow for More
This is only one piece of a growing suite of professional-grade tools I’m publishing.
If you want:
🔥 More scanners
🔥 Predictive momentum engines
🔥 AI-grade alert logic
🔥 My official Premium trading toolkit
Hit Follow — new releases drop frequently.
Trade smart.
Trade fast.
And catch the ones everyone else regrets missing.

Swing Aurora v7.0 — The ExecutionerSwing Aurora v7.0 — The Executioner
Swing Aurora v7.0 is a multi-engine swing trading framework that combines trend-following, momentum, HTF confluence and SMC/Fibonacci structure in one script.
This version moves from a rigid gate logic to a scoring + state machine engine, so you can see not only if there is a signal, but how strong that signal really is.
🧠 1. Scoring Engine – A-Grade & B-Grade Signals
Instead of a single if (all conditions == true) check, v7.0 builds a score on every bar:
Trend score – position vs Baseline, slope, Supertrend direction.
Momentum score – MACD, RSI-Stoch triggers, ADX, local HH/LL.
HTF score – alignment with higher timeframe Baseline, Bias EMA, EMAs and RSI.
Confluence flags – divergences, ST flip/retest, SMC zones, VDub context.
Results:
A-Grade (Strong) signals → high score, strong trend + momentum + HTF alignment.
B-Grade (Speculative) signals → early/partial setups, clearly marked as higher risk.
You no longer lose good entries just because one minor filter disagrees, but you can clearly distinguish high-quality setups from speculative ones.
🔁 2. Strict Trade Cycle – State Machine
v7.0 uses a simple state machine:
0 = Flat, 1 = Long, -1 = Short.
When you are Long, the script only looks for exits or reversals, not new BUY entries.
Same for Short.
This enforces a clean, disciplined flow:
BUY → Hold → EXIT → wait for next setup, without label spam or conflicting signals while already in a position.
🛡️ 3. Quality Gates & Anti-FOMO Filters
To avoid buying local tops or chopping yourself to death:
RSI Gate – blocks BUY when RSI is already overbought (and vice-versa for SELL).
ATR Over-Extension filter – no entries when price is too far from the Baseline (parabolic moves).
No-Trade / Chop zone – combines ADX, ATR vs ATR-slow, distance to Baseline, Bollinger/Keltner squeeze and volume behavior.
Volume Gate – requires a real volume spike, not just random price wiggle.
Supertrend Gate – entries are synchronized with ST (flip / early / retest — configurable).
HTF Guardrails – optional: blocks entries against the dominant HTF regime.
📈 4. Visual Layer: Trend Map, Labels & Gradient
BUY/SELL labels with confidence percentage.
Background gradient based on trend direction and strength (ADX).
EMA 13/21 + Baseline with dynamic bull/bear colors.
Optional mini-legend showing: TS / RSI / ADX / HTF status at a glance.
🧩 5. Divergences, VDub & Macro Map
Full divergence engine (classic + hidden) on a basket of indicators (RSI, MACD, CCI, OBV, etc.), with optional lines and count labels.
VDub levels & signals – “smart levels” (solid/dotted) and add-on BUY/SELL signals filtered by market regime.
HTF Macro Map – higher timeframe Baseline, Bias EMA, fast EMAs, RSI and slope, using an auto or user-selected higher TF.
🧱 6. SMC Zones & Fibonacci (v7.0 Logic)
The SMC / Fibo component was refined so it is not hard-wired to the current bar’s entry signal:
Automatic HH / HL / LH / LL market structure labelling.
Demand / Supply zones:
derived from BOS with ATR buffer,
auto-update bar-by-bar,
auto-delete when broken or after a user-defined lifetime.
Fibonacci range:
built from the latest valid swing-high / swing-low,
shows 0 / 0.382 / 0.5 / 0.618 / 1 / 1.618 levels plus equilibrium line,
persists while the range is valid (independent of being in a trade).
AI zone boost (v7.0) – optional: zone opacity adapts dynamically to the underlying confidence score, highlighting higher-quality areas.
⚙️ 7. Modes & Configuration
Modes: Aggressive / Balanced / Conservative – adjust score thresholds and confidence requirements.
Risk & Quality: slope filter, min ATR distance, strict anti-chop, volume gate, HTF guardrails.
Visual toggles: labels on/off, baseline & EMAs, gradient, mini-legend, SMC boxes, Fibonacci.
This script does not trade for you – it provides a structured, consistent framework for reading trend, momentum and structure, plus graded signals so you can execute your own risk management and strategy.
Disclaimer
This script is provided strictly for educational and research purposes. It does not constitute financial advice, investment recommendation or any guarantee of profit. Historical performance, backtests and chart examples do not ensure future results.
Always use your own risk management rules, test the script on multiple instruments and timeframes, and never trade with money you cannot afford to lose. The author and contributors accept no responsibility for any trading decisions made based on this indicator.

Advanced Volume & Price Heatmap (Fixed)Work in Progress. Used AI to help me code. Not really sure it worked very well. I need to run it through Cursor and make it cleaner and better.

Obsidian Flux Matrix# Obsidian Flux Matrix | JackOfAllTrades
Made with my Senior Level AI Pine Script v6 coding bot for the community!
Narrative Overview
Obsidian Flux Matrix (OFM) is an open-source Pine Script v6 study that fuses social sentiment, higher timeframe trend bias, fair-value-gap detection, liquidity raids, VWAP gravitation, session profiling, and a diagnostic HUD. The layout keeps the obsidian palette so critical overlays stay readable without overwhelming a price chart.
Purpose & Scope
OFM focuses on actionable structure rather than marketing claims. It documents every driver that powers its confluence engine so reviewers understand what triggers each visual.
Core Analytical Pillars
1. Social Pulse Engine
Sentiment Webhook Feed: Accepts normalized scores (-1 to +1). Signals only arm when the EMA-smoothed value exceeds the `sentimentMin` input (0.35 by default).
Volume Confirmation: Requires local volume > 30-bar average × `volSpikeMult` (default 2.0) before sentiment flags.
EMA Cross Validation: Fast EMA 8 crossing above/below slow EMA 21 keeps momentum aligned with flow.
Momentum Alignment: Multi-timeframe momentum composite must agree (positive for longs, negative for shorts).
2. Peer Momentum Heatmap
Multi-Timeframe Blend: RSI + Stoch RSI fetched via request.security() on 1H/4H/1D by default.
Composite Scoring: Each timeframe votes +1/-1/0; totals are clamped between -3 and +3.
Intraday Readability: Configurable band thickness (1-5) so scalpers see context without losing space.
Dynamic Opacity: Stronger agreement boosts column opacity for quick bias checks.
3. Trend & Displacement Framework
Dual EMA Ribbon: Cyan/magenta ribbon highlights immediate posture.
HTF Bias: A higher-timeframe EMA (default 55 on 4H) sets macro direction.
Displacement Score: Body-to-ATR ratio (>1.4 default) detects impulses that seed FVGs or VWAP raids.
ATR Normalization: All thresholds float with volatility so the study adapts to assets and regimes.
4. Intelligent Fair Value Gap (FVG) System
Gap Detection: Three-candle logic (bullish: low > high ; bearish: high < low ) with ATR-sized minimums (0.15 × ATR default).
Overlap Prevention: Price-range checks stop redundant boxes.
Spacing Control: `fvgMinSpacing` (default 5) avoids stacking from the same impulse.
Storage Caps: Max three FVGs per side unless the user widens the limit.
Session Awareness: Kill zone filters keep taps focused on London/NY if desired.
Auto Cleanup: Boxes delete when price closes beyond their invalidation level.
5. VWAP Magnet + Liquidity Raid Engine
Session or Rolling VWAP: Toggle resets to match intraday or rolling preferences.
Equal High/Low Scanner: Looks back 20 bars by default for liquidity pools.
Displacement Filter: ATR multiplier ensures raids represent genuine liquidity sweeps.
Mean Reversion Focus: Signals fire when price displaces back toward VWAP following a raid.
6. Session Range Breakout System
Initial Balance Tracking: First N bars (15 default) define the session box.
Breakout Logic: Requires simultaneous liquidity spikes, nearby FVG activity, and supportive momentum.
Z-Score Volume Filter: >1.5σ by default to filter noisy moves.
7. Lifestyle Liquidity Scanner
Volume Z-Scores: 50-bar baseline highlights statistically significant spikes.
Smart Money Footprints: Bottom-of-chart squares color-code buy vs sell participation.
Panel Memory: HUD logs the last five raid timestamps, direction, and normalized size.
8. Risk Matrix & Diagnostic HUD
HUD Structure: Table in the top-right summarizes HTF bias, sentiment, momentum, range state, liquidity memory, and current risk references.
Signal Tags: Aggregates SPS, FVG, VWAP, Range, and Liquidity states into a compact string.
Risk Metrics: Swing-based stops (5-bar lookback) + ATR targets (1.5× default) keep risk transparent.
Signal Families & Alerts
Social Pulse (SPS): Volume-confirmed sentiment alignment; triangle markers with “SPS”.
Kill-Zone FVG: Session + HTF alignment + FVG tap; arrow markers plus SL/TP labels.
Local FVG: Captures local reversals when HTF bias has not flipped yet.
VWAP Raid: Equal-high/low raids that snap toward VWAP; “VWAP” label markers.
Range Breakout: Initial balance violations with liquidity and imbalance confirmation; circle markers.
Liquidity Spike: Z-score spikes ≥ threshold; square markers along the baseline.
Visual Design & Customization
Theme Palette: Primary background RGB (12,6,24). Accent shading RGB (26,10,48). Long accents RGB (88,174,255). Short accents RGB (219,109,255).
Stylized Candles: Optional overlay using theme colors.
Signal Toggles: Independently enable markers, heatmap, and diagnostics.
Label Spacing: Auto-spacing enforces ≥4-bar gaps to prevent text overlap.
Customization & Workflow Notes
Adjust ATR/FVG thresholds when volatility shifts.
Re-anchor sentiment to your webhook cadence; EMA smoothing (default 5) dampens noise.
Reposition the HUD by editing the `table.new` coordinates.
Use multiples of the chart timeframe for HTF requests to minimize load.
Session inputs accept exchange-local time; align them to your market.
Performance & Compliance
Pure Pine v6: Single-line statements, no `lookahead_on`.
Resource Safe: Arrays trimmed, boxes limited, `request.security` cached.
Repaint Awareness: Signals confirm on close; alerts mirror on-chart logic.
Runtime Safety: Arrays/loops guard against `na`.
Use Cases
Measure when social sentiment aligns with structure.
Plan ICT-style intraday rebalances around session-specific FVG taps.
Fade VWAP raids when displacement shows exhaustion.
Watch initial balance breaks backed by statistical volume.
Keep risk/target references anchored in ATR logic.
Signal Logic Snapshot
Social Pulse Long/Short: `sentimentEMA` gated by `sentimentMin`, `volSpike`, EMA 8/21 cross, and `momoComposite` sign agreement. Keeps hype tied to structural follow-through.
Kill-Zone FVG Long/Short: Requires session filter, HTF EMA bias alignment, and an active FVG tap (`bullFvgTap` / `bearFvgTap`). Labels include swing stops + ATR targets pulled from `swingLookback` and `liqTargetMultiple`.
Local FVG Long/Short: Uses `localBullish` / `localBearish` heuristics (EMA slope, displacement, sequential closes) to surface intraday reversals even when HTF bias has not flipped.
VWAP Raids: Detect equal-high/equal-low sweeps (`raidHigh`, `raidLow`) that revert toward `sessionVwap` or rolling VWAP when displacement exceeds `vwapAlertDisplace`.
Range Breakouts: Combine `rangeComplete`, breakout confirmation, liquidity spikes, and nearby FVG activity for statistically backed initial balance breaks.
Liquidity Spikes: Volume Z-score > `zScoreThreshold` logs direction, size, and timestamp for the HUD and optional review workflows.
Session Logic & VWAP Handling
Kill zone + NY session inputs use TradingView’s session strings; `f_inSession()` drives both visual shading and whether FVG taps are tradeable when `killZoneOnly` is true.
Session VWAP resets using cumulative price × volume sums that restart when the daily timestamp changes; rolling VWAP falls back to `ta.vwap(hlc3)` for instruments where daily resets are less relevant.
Initial balance box (`rangeBars` input) locks once complete, extends forward, and stays on chart to contextualize later liquidity raids or breakouts.
Parameter Reference
Trend: `emaFastLen`, `emaSlowLen`, `htfResolution`, `htfEmaLen`, `showEmaRibbon`, `showHtfBiasLine`.
Momentum: `tf1`, `tf2`, `tf3`, `rsiLen`, `stochLen`, `stochSmooth`, `heatmapHeight`.
Volume/Liquidity: `volLookback`, `volSpikeMult`, `zScoreLen`, `zScoreThreshold`, `equalLookback`.
VWAP & Sessions: `vwapMode`, `showVwapLine`, `vwapAlertDisplace`, `killSession`, `nySession`, `showSessionShade`, `rangeBars`.
FVG/Risk: `fvgMinTicks`, `fvgLookback`, `fvgMinSpacing`, `killZoneOnly`, `liqTargetMultiple`, `swingLookback`.
Visualization Toggles: `showSignalMarkers`, `showHeatmapBand`, `showInfoPanel`, `showStylizedCandles`.
Workflow Recipes
Kill-Zone Continuation: During the defined kill session, look for `killFvgLong` or `killFvgShort` arrows that line up with `sentimentValid` and positive `momoComposite`. Use the HUD’s risk readout to confirm SL/TP distances before entering.
VWAP Raid Fade: Outside kill zone, track `raidToVwapLong/Short`. Confirm the candle body exceeds the displacement multiplier, and price crosses back toward VWAP before considering reversions.
Range Break Monitor: After the initial balance locks, mark `rangeBreakLong/Short` circles only when the momentum band is >0 or <0 respectively and a fresh FVG box sits near price.
Liquidity Spike Review: When the HUD shows “Liquidity” timestamps, hover the plotted squares at chart bottom to see whether spikes were buy/sell oriented and if local FVGs formed immediately after.
Metadata
Author: officialjackofalltrades
Platform: TradingView (Pine Script v6)
Category: Sentiment + Liquidity Intelligence
Hope you Enjoy!

The Quantum Leap: Renko + ML(Note: This indicator uses the BackQuant & SuperTrend which takes a 4-5 seconds to load)
This strategy uses the following indicators (please see source code)
Synthetic Renko: Ignores time and focuses purely on price movement to detect clear trend reversals (Red-to-Green).
ATR (Average True Range): Measures volatility to calculate the Renko brick sizes and SuperTrend sensitivity.
Adaptive SuperTrend: A trend filter that uses volatility clustering to confirm if the market is currently in a "Bearish" state.
RSI (Relative Strength Index): A momentum gauge ensuring the asset is "Oversold" (exhausted) before we consider a setup.
Monthly Pivots: Horizontal support lines based on last month's data acting as price "floors" (S1, S2, S3).
SMA (Simple Moving Average): A 100-bar average ensuring we are strictly buying below the long-term mean (deep value).
BackQuant (KNN): A Machine Learning engine that compares current data to historical patterns to predict immediate momentum.
This is a sophisticated, multi-stage strategy script. It combines "Old School" price action (Renko) with "New School" Machine Learning (KNN and Clustering).
Here is the high-level summary of how we will break this down:
Topic 1: The "Bottom Hunter" Setup. How the script uses Renko bricks and aggressive filtering (SuperTrend, SMA, RSI, Pivots) to find a potential market bottom.
Topic 2: The ML Engine (BackQuant & SuperTrend). How the script uses K-Nearest Neighbors (KNN) to predict momentum and Volatility Clustering to adjust the SuperTrend.
Topic 3: The "Leap" Execution. How the script synchronizes the Setup (Topic 1) with the ML Trigger (Topic 2) using a time window.
Topic 1: The "Bottom Hunter" Setup
This script is designed as a Mean Reversion strategy (often called "catching a falling knife" or "bottom fishing"). It is trying to find the exact moment a downtrend stops and reverses.
Most strategies buy when price is above the 200 SMA or above the SuperTrend. This script does the exact opposite.
The Logic:
Renko Bricks: It simulates Renko bricks internally (without changing your chart view). It waits for a specific pattern: A Red Brick followed immediately by a Green Brick (a reversal).
The "Bearish" Filters: To generate a "WATCH" signal, the following must be true:
Price < SuperTrend: The market must officially be in a downtrend.
Price < SMA: Long-term trend is down.
Price < Monthly Pivot: Price is deeply discounted.
RSI < Threshold: The asset is oversold (exhausted).
Recommended Settings for daily signals for Stocks :
Confirmation : 10. (How many bars after Renko Buy signal the AI has to identify a bullish move).
Percentage : 2 (This is the Renko bar size. This represents 2% move.)
SMA: 100 (Signal must be found below 100 SMA)
Price must be below: PIVOT (This is the monthly Pivot levels)

Sky Eye TRADE AI DC: discord.gg
輔助 規劃進出場 位子畫線 幫助你加速學習
只需要知道這個位子是甚麼在去加強研究 技術分析 即可
想學習更多可以到DC一起學習
DC: discord.gg
Assisted with entry and exit point planning and position drawing to accelerate your learning.
You only need to know what this position represents before you can further study and analyze technical indicators.
To learn more, you can join us at DC.

Vdubus Divergence Wave Pattern Generator V1The Vdubus Divergence Wave Theory
10 years in the making & now finally thanks to AI I have attempted to put my Trading strategy & logic into a visual representation of how I analyse and project market using Core price action & MacD. Enjoy :)
A Proprietary Structural & Momentum Confluence SystemPart 1: The Strategic Concept1. The Core Philosophy: "Geometry + Physics"Traditional technical analysis often fails because traders confuse location with timing.Geometry (Price Patterns): Tells us WHERE the market is likely to reverse (e.g., at a resistance level or harmonic D-point).Physics (Momentum): Tells us WHEN the energy driving the trend has actually shifted. The Vdubus Theory posits that a trade should never be taken based on Geometry alone. A valid signal requires a specific, fractal decay in momentum—a "Handshake" between price structure and energy exhaustion.2. The 3-Wave Momentum Filter (The Engine)Most traders look for simple divergence (2 points). The Vdubus Theory demands a 3-Wave Structure to confirm the true state of the market.A. The Standard Reversal (Exhaustion)This is the "Safe" entry, catching the slow death of a trend.Wave 1 $\rightarrow$ 2 (The Warning): Price pushes higher, but momentum is lower (Standard Divergence). This signals that the trend is tapping the brakes.Wave 2 $\rightarrow$ 3 (The Confirmation): Price pushes to a final extreme (often a stop-hunt), but momentum is flat or lower than Wave 2 ("No Divergence").The Logic: This confirms that the buyers have expended all remaining energy. The engine is dead.
B. The Climax Reversal (The Trap)This is the "Aggressive" entry, catching V-shape reversals.Wave 1 $\rightarrow$ 2 (The Bait): Price pushes higher, and momentum is Stronger/Higher (No Divergence). This sucks in retail traders who believe the trend is accelerating.Wave 2 $\rightarrow$ 3 (The Snap): Price pushes again, but momentum suddenly collapses (Divergence).The Logic: A "Strong to Weak" shift. The market traps traders with a show of strength before hitting a "concrete wall" of limit orders.C. The Predator (The Trend Continuation)The Logic: Trends rarely move in straight lines. The "Predator" looks for Hidden Divergence during a pullback.The Signal: Price makes a Higher Low (Trend Structure Intact), but Momentum makes a Lower Low (Oversold Trap). This signals the end of the correction and the resumption of the main trend.3. The "Clean Path" PrincipleA trade is only valid if there is no opposing force. If you are looking to Sell (Bearish Reversal), the opposing Bullish momentum must be weak or neutral. If the "Enemy" is strong, the trade is skipped.
Part 2: The Indicator Breakdown
Tool Name: Vdubus Divergence Wave Pattern Generator V1
This script automates your analysis by combining ZigZag Pattern Recognition (Geometry) with your Custom MACD Logic (Physics).
1. The "Golden" Settings
The physics engine is tuned to your specific discovery:
Fast Length: 8
Slow Length: 21
Signal Length: 5
Lookback: 3 (Sensitive enough to catch the exact pivot points).
2. Signal Generation Logic
The indicator scans for four distinct setups. Here is the exact logic code translated into English:
Signal 1: Standard Reversal (Green/Red Pattern)
Geometry: The ZigZag algorithm identifies a 5-point structure (X-A-B-C-D), such as a Gartley, Bat, or Butterfly.
Physics Check:
Finds the last 3 momentum peaks matching the price highs.
Rule: Momentum Peak 2 must be < Peak 1 (Divergence).
Rule: Momentum Peak 3 must be <= Peak 2 (Confirmation/No Div).
Output: Draws the colored pattern and labels it (e.g., "Bearish Gartley (Exhaustion)").
Signal 2: Climax Reversal (Orange Pattern)
Geometry: Identifies the same 5-point structures.
Physics Check:
Rule: Momentum Peak 2 is >= Peak 1 (Strength/No Div).
Rule: Momentum Peak 3 is < Peak 2 (Sudden Failure/Div).
Output: Draws the pattern in Orange labeled "⚠️ CLIMAX REVERSAL". This is your "Trap" detector.
Signal 3: Rounded Top/Bottom (Navy/Maroon Label)
Geometry: Price is compressing or rounding over.
Physics Check:
Scans for 4 consecutive waves of momentum decay.
Rule: Peak 1 > Peak 2 > Peak 3 > Peak 4.
Output: Places a label indicating a "Multi-Wave Decay," identifying turns that don't have sharp pivots.
Signal 4: The Predator (Purple Pattern)
Geometry: Identifies a trend pullback (Higher Low for Buys).
Physics Check:
Rule: Momentum makes a Lower Low while Price makes a Higher Low (Hidden Divergence).
Output: Draws a Purple pattern labeled "🦖 PREDATOR" to signal trend continuation.
3. The Confluence Dashboard
Located in the corner of the screen, this provides a final "Safety Check."
Logic: It compares the absolute value (strength) of the most recent Bearish Momentum Peak vs. the most recent Bullish Momentum Low.
Output:
Green (Bulls Strong): Buying pressure is dominant. Safe to Buy, Dangerous to Sell.
Red (Bears Strong): Selling pressure is dominant. Safe to Sell, Dangerous to Buy.
Grey (Neutral): Forces are balanced.
Summary of Potential
This system solves the "Trader's Dilemma" of entering too early or too late. By waiting for the 3rd Wave, you effectively filter out the market noise and only commit capital when the opposing side has structurally and physically collapsed. It transforms trading from a guessing game into a disciplined execution of identifying Geometric Exhaustion.
Logic 1 / PREVIOUS DIVERGENCE PROJECTS future TREND BREAKS / Reversals *Not in script*
Logic 2 / Wave 1 to 2 = Divergence / Wave 2 to 3 = NO divergence = Signal
Reverse logic: Wave 1 to 2 = NO Divergence / Wave 2 to 3 = Divergence = Signal
