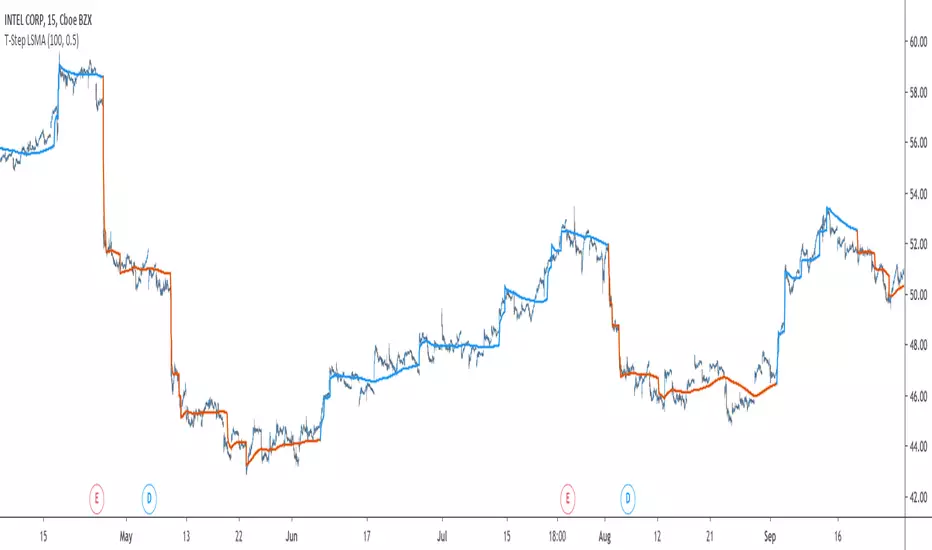
T-Step LSMAIntroduction
The trend step indicator family has produced much interest in the community, those indicators showed in certain cases robustness and reactivity. Their ease of use/interpretation is also a major advantage. Although those indicators have a relatively good fit with the input price, they can still be improved by introducing least-squares fitting on their calculations. This is why i propose a new indicator (T-Step LSMA) which aim to gather all the components of the trend-step indicator family (including the auto-line family).
The indicator will use as a threshold the mean absolute error between the input and the output (T-Channel) scaled with the efficiency ratio (Efficient Trend Step) while using least squares in order to provide a better fit with the price (Auto-Filter).
The Indicator
The interpretation of the indicator is easy, the indicator estimate an up-trending market when in blue, down-trending when in orange, the signal only depend on the trend-step part ( b in the code).
length control the period of the efficiency ratio as well as any components in the lsma calculation. The efficiency ratio allow to provide adaptivity, therefore the threshold will be lower when market is trending and higher when market is ranging.
Sc control the amount of feedback of the indicator, a value of 1 will use only the closing price as input, a value of 0.5 will use 50% of the closing price/indicator output as input, this allow to get smoother results.
It is possible to get the non-smooth version of the indicator by checking "No Smoothing".
This allow the indicator to filter more information.
Least Squares Smoothing - Benefits
One could ask why introducing least squares smoothing, there are several reasons to this choice, we have seen that trend-step indicators are boxy, they filter most of the variational information in the price, introducing least squares smoothing allow to gain back some of this variational information while providing a better fit with the price, the indicator is more noisy but also more practical in certain situations.
For example the indicator in its boxy form can't really be useful as input for other indicators, which is not the case with this version.
Relative strength index of period 14 using the proposed indicator as input.
Down-Sides
The indicator is dependent on the time frame used, larger time frames resulting in an indicator overfitting, sticking with lower time frames might be ideal. The indicator behavior might also change depending on the market in which it is applied.
Setting Up Alerts For The Indicator
Alerts conditions are already set, in order to create an alert based on the indicator follow these steps :
Go to the alert section (the alarm clock) -> create new alert -> select T-Step LSMA in condition -> Below select Up or Dn (Up for a up-trending alert and Dn for a down-trending alert)
In option select "once per bar close", change the message if you want a personalized message.
Conclusion
I don't think i'll post other indicators related to the trend-step framework for the time to comes, nonetheless the ones posted proven to have interesting results as well as many upsides. Although i don't think they would generate positive long-terms returns they could still be of use when using smarter volatility metrics as threshold. The proposed indicator conserve more information than its relatives and might find some use as input for other indicators.
Recommended Use Of The Code
Although i don't put restrictions on the code usage, i still recommend creative and pertinent changes to be made, graphical changes or any minor changes are not necessary, remember that such practice is disrespectful toward the author, you don't want to load up the tradingview servers for nothing right ?
Support Me
Making indicators sure is hard, it takes time and it can be quite lonely to, so i would love talking with you guys while making them :) There isn't better support than the one provided by your friends so drop me a message.
Search in scripts for "alert"
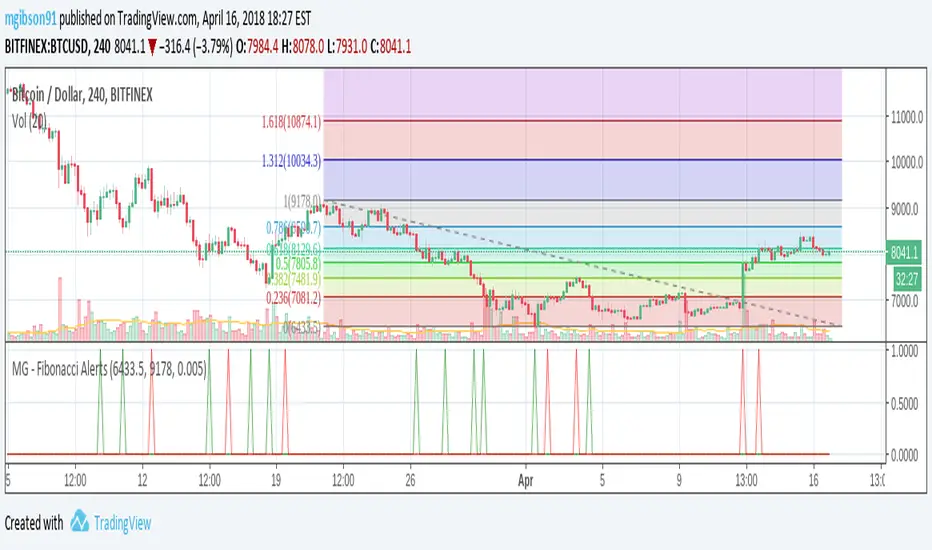
MG - Fibonacci Alerts - 1.0This script allows a user to get alerts when the price goes within a certain percentage threshold of a Fibonacci level.
If connected with AutoView, it could allow an easy way to do automated range trading between Fibonacci levels. Although I plan to do this myself, I haven't used it for this purpose yet so please be cautious and verify with live results beforehand before using it for any automation.
NOTE: The image shown of the indicator is not fully correct as the close price is used. In many cases in the example image, the candle close price DID come within the alert threshold but closed outside the threshold
Usage:
1. User performs a Fibonacci retracement / extension analysis to identify a sensible high and low point. (Currently, this script is geared towards dip pullbacks during a bull market with the ability to toggle rise pullbacks in a bear market in the pipeline)
2. User enters the high and low points into this indicator
3. User can then set alerts on the buy and sell signals which should provide alerts at excellent entry / exit points.
a. Alerts must be created on the buy and sell signal bars. E.g. Buy signal => Alert when 'Buy Signal' crosses up '0.9'
4. Set the alerts to once per bar (not per close). In this indicator, we want to catch things as soon as they happen.
NOTE: Should use in conjunction with another indicator for maximize results.
I personally use this indicator ()
TODO
- Add negative alert levels
- Allow user to specify direction of Fib retracement as the levels are different in bull and bear markets
All feedback is welcome
2 hours ago
Gunbot MACDgenOk this is just some strat based on MACD, checking for a few conditions until giving buy/sell signals to Gunbot via alerts.
It is generalized but if you want to go play with the values. I will continue to develop this further and am happy to receive feedback.
Notations are coming.
Usage notes:
-ONLY use this with TV_GAIN: 0.6 because on downtrends it is supposed to double up to pull down the average bought price!
-Use "buying condition" and "selling condition" for alerts, trigger on close and I suggest you use 3 min intervals but try what looks good to you
-Use this on pairs that are curvy and have atleast 0.6% gain between buy/sell triggers. This is also general advise when you want to take microprofits.
-Don't be confused with sell arrows, it will only trigger the bot sell on gain when you've set TV_GAIN

Bollinger BandWidth With AlertsBollinger BandWidth (BBW) + Compression/Exhaustion Alerts
This indicator plots Bollinger BandWidth (BBW) to help you identify volatility regimes: when the market is compressing (coiling) vs expanding (in price discovery).
What it shows
BBW (Blue): Current Bollinger BandWidth as a % of the basis (SMA).
Highest Expansion (Red): The highest BBW value over the last N bars (lookback).
Lowest Contraction (Green): The lowest BBW value over the last N bars (lookback).
Key Features
✅ Compression Detection
Triggers when BBW is near the Lowest Contraction line (volatility squeeze / balance phase).
✅ Exhaustion / Peak Expansion Detection
Triggers when BBW is near the Highest Expansion line (strong expansion / potential late-stage move).
✅ Configurable “Near Zone” Thresholds
Use:
Near Lowest Contraction (%) → how close BBW must be above the contraction extreme
Near Highest Expansion (%) → how close BBW must be below the expansion extreme
Alerts Included
BBW Compression (Near Lowest Contraction)
BBW Exhaustion (Near Highest Expansion)
Alerts are designed to be used with “Once per bar close” to avoid noise during bar formation.
How to use (simple)
Compression alert (C): Start watching for breakout / value setups (market is coiling).
Exhaustion alert (E): Be cautious chasing moves; watch for transitions or rebalancing.
Inputs
BB Length, Source, StdDev
Expansion/Contraction lookback length (hidden by default)
Near-zone thresholds for compression/exhaustion alerts

TEMA vs WMA Retest & Crossover Alerts TEMA vs WMA — Retest & Crossover Alerts (with visible label)
TEMA vs WMA is a clean, momentum + trend-bias overlay built for traders who like simple, repeatable structure: trend confirmation + pullback (retest) entries, with optional trend-flip alerts when momentum shifts.
It’s especially useful for:
Trend traders looking to buy pullbacks / sell rallies
Scalpers & intraday traders who want quick bias + retest triggers
Swing traders who want a “stay on the right side” filter with clear flips
Anyone who prefers minimal indicators and alert-driven execution
What it does
This script plots two moving averages on your chart:
WMA (default 26): acts like a dynamic support/resistance “mean”
TEMA (default 26): a faster, smoother momentum line that reacts quicker than standard EMAs
The relationship between the two defines your bias:
Bullish bias: TEMA is above WMA
Bearish bias: TEMA is below WMA
To make the bias obvious at a glance:
Both lines change color depending on bias
A soft fill appears between the lines (bullish/bearish/neutral)
Optional bar coloring input is included (for future expansion), while the current version focuses on coloring the averages and fill.
Signals & alerts included
This indicator is built around two core ideas: retests and crossovers.
✅ Retest Alerts (entry-style trigger)
A “retest” happens when price touches the WMA (with an optional tolerance buffer).
BUY Retest: bullish bias (TEMA > WMA) and price retests WMA
SELL Retest: bearish bias (TEMA < WMA) and price retests WMA
These are great for “trend continuation” setups: wait for trend bias → enter on pullback to WMA.
⚡ Trend Flip Alerts (bias shift)
Bullish Flip: TEMA crosses above WMA
Bearish Flip: TEMA crosses below WMA
These are useful for spotting momentum reversals or confirming a new trend phase.
Visual label (on-chart confirmation)
When a retest occurs (and labels are enabled), the script prints a small “Retest” label at the WMA level to make it easy to spot retest events while backtesting.
Customization
WMA Length / TEMA Length: adjust for faster (shorter) or smoother (longer) behavior
Touch Buffer: adds price tolerance so “near touches” count as retests (helpful on high-volatility assets)
Show last-bar status label: toggle retest labels on/off
How traders typically use it
Trade with bias (bull = look long, bear = look short)
Wait for a WMA retest to avoid chasing
Use the trend flip alerts to avoid fighting reversals
Combine with your favorite confirmation (volume, structure, HTF trend, support/resistance)
Note: This is an alert + structure tool, not a full trading system. Always manage risk and consider market context (range vs trend, news volatility, session timing).

MTF Institutional Zones with Alerts (Impulse + Mitigation)This script plots multi-timeframe (MTF) Supply and Demand zones derived from impulse candles on higher timeframes.
How zones are created
A new zone is formed when an HTF candle has a body size greater than or equal to ATR(14) * Impulse Multiplier.
If the impulse candle is bullish, the script uses the most recent bearish candle (on that HTF) as the Demand zone source.
If the impulse candle is bearish, the script uses the most recent bullish candle (on that HTF) as the Supply zone source.
Filtering and zone management
Zones are kept only if the distance from the HTF impulse close to the zone source is within ATR(14) * Max Distance.
A maximum number of zones per side is stored for each timeframe. Older zones are deleted automatically.
Zones are extended to the right in real time.
Mitigation rule (50%)
A zone is removed when price mitigates 50% of its range:
Demand is removed when low reaches the midpoint.
Supply is removed when high reaches the midpoint.
Alerts
Formation alerts: triggered when a new HTF zone is created (TF1/TF2/TF3).
Proximity alerts (NEAR/IN): triggered when the candle range is within a configurable distance from a zone or when price is inside/touching it.
How to use
Choose TF1/TF2/TF3 (e.g., 4H / 1H / 15m).
Adjust Impulse Multiplier to detect only strong candles.
Adjust Proximity distance (%) to control when proximity alerts trigger.
Notes
This indicator highlights potential reaction areas. It does not guarantee reversals and should be used with proper risk management.

John Trade AlertsImagine you are watching a ball bounce up and down on a graph.
This script is like a set of rules that says:
When to start playing
When to stop playing
When you got some prize levels
and it yells to you (alerts) when those things happen.
The main ideas
Breakout Buy (ball jumps high)
There is a line drawn high on the chart called the breakout level.
If the price (the ball) closes above that line, and some extra “good conditions” are true (enough volume, uptrend, etc.),
the script says: “We entered a Breakout trade now.”
Pullback Buy (ball dips into a box)
There is a zone (a small box) between a low line and a high line: the pullback zone.
If the price closes inside that zone, and the pullback looks “healthy” (not too much volume, still above a moving average, etc.),
the script says: “We entered a Pullback trade now.”
Stops (when to get out if it goes wrong)
For each entry type (Breakout or Pullback), there is a red stop line under the price.
If the price falls below that stop line, the script says:
“Stop hit, we’re out of the trade.”
Hard Support / Invalidation (big no‑no level)
There is a special hard support line.
The script also looks at the 1‑hour chart in the background.
If a 1‑hour candle closes below that hard support, it says:
“Hard invalidation – idea is broken, get out.”
Targets (prize levels)
Above the current price there are several orange lines: Target 1, 2, 3A, 3B, 4A, 4B.
If the price goes up and crosses one of these lines, the script says:
“Target X reached!”
Trend and Volume “health checks”
It checks if the short‑term average price (SMA20) is going up → “uptrend.”
It can check if price is above a long‑term average (SMA200).
For breakouts, it checks if volume is stronger than usual (good push).
For pullbacks, it prefers quieter than usual volume (calm dip).
It can also check an Anchored VWAP line (a special average price from a chosen starting time) and only trade if price is above that too.
Remembering if you are “in a trade”
The script keeps a little memory:
Are we currently in a position (inPos) or not?
Was it a Breakout or a Pullback entry?
What is our entry price and active stop?
When it gets a new entry signal, it turns inPos to true, picks the right stop, and draws that stop line.
When a stop or hard invalidation happens, it sets inPos to false again.
It can also “forget” and reset at the start of a new trading day if you want.
Alerts
When:
you get a Breakout entry
or a Pullback entry
or a Stop is hit
or the hard support is broken on 1‑hour
or a Target is reached
the script sends a message you can use in TradingView alerts (pop‑ups, email, webhook, etc.).
Things you see on the chart
Teal line: Breakout level
Green lines: Pullback zone low & high
Red line: Active stop (only when you’re “in” a trade)
Orange lines: Targets 1, 2, 3A, 3B, 4A, 4B
Blue line: Anchored VWAP (if you turn it on)
Purple faint line: SMA20 (short‑term trend)
Gray faint line: SMA200 (long‑term trend)
Little label near the last bar that says:
if you’re IN or Flat
which type of entry (Breakout/Pullback)
what your current stop is
So in kid words:
It draws important lines on the chart.
It watches the price move like a ball.
When the ball does something special (jump above, fall below, hit a prize line),
it shouts to you with alerts.
It remembers if you’re in the game or not, and where your safety line (stop) is.

Two Consecutive Candles Alert - Toggle Alerts🔹 Overview:
This indicator identifies when two consecutive candles of the same color appear on the chart—bullish (green) or bearish (red). It highlights the second candle of the streak and optionally triggers an alert, helping traders spot short-term momentum shifts or continuation patterns.
🔹 How It Works:
Candle Detection: The script checks the last three candles.
The second candle in a pair is marked only if it follows a candle of the same color and is not part of a longer streak.
Marking:
Bullish second candles are marked with a green triangle below the bar.
Bearish second candles are marked with a red triangle above the bar.
Alerts (Optional):
Traders can enable or disable alerts independently for bullish or bearish setups using checkboxes in the settings.
Alerts are triggered only on the second candle of a two-candle streak.
🔹 Inputs / Settings:
Enable Bullish Candle Alerts ✅
Enable Bearish Candle Alerts ✅
🔹 Use Case:
Identify short-term trend momentum.
Spot potential continuation setups after two consecutive candles of the same type.
Combine with other indicators for confirmation (e.g., support/resistance, moving averages).
🔹 Notes:
The indicator marks only the second candle in a two-candle streak to avoid marking longer streaks multiple times.
Alerts are fully optional and can be toggled on or off.

Open Equal to Low Alert//@version=5
indicator("Open Equal to Low Alert", overlay=true)
// Condition: Open price equals the Low price of the current bar
open_equal_low = open == low
// Plot a small shape on the chart when the condition is met (optional, for visual confirmation)
plotshape(open_equal_low, title="Open == Low", location=location.belowbar, color=color.new(color.green, 0), style=shape.triangleup, size=size.small)
// Create an alert condition that can be selected in the Alert menu
alertcondition(open_equal_low, title="Open is Equal to Low", message="The Open price is equal to the Low price for {{ticker}} on the {{interval}} timeframe.")

Desk Alerts: AMD / PLTR / NVDA (VWAP + EMA + Volume)Desk Alerts: AMD / PLTR / NVDA (VWAP + EMA + Volume)

Desk Alerts: AMD / PLTR / NVDA (VWAP + EMA + Volume)Desk Alerts: AMD / PLTR / NVDA (VWAP + EMA + Volume)

VDUB Bands - MTF WMA+ATR Volatility Lanes (6 Alerts)VDUB Bands draws volatility-scaled “trend lanes” around a Weighted Moving Average (WMA) using ATR (or a WMA of True Range). It can display up to four tiers (L1–L4), with higher tiers sourced from higher timeframes to show local structure → higher-timeframe structure on a single chart.
────────────────────────────────────────
1. What it does (plain English)
────────────────────────────────────────
Think of each tier as a lane system around the trend:
• Inner rails = “normal volatility lane” around the WMA
• Outer rails = “extension / extreme zone” for that tier
• Higher tiers (L3/L4) show bigger structure
• Lower tiers (L1/L2) show active lane behavior
Typical interpretation:
• Price inside inner rails → normal variance around the trend lane
• Between inner and outer → stretched, but not extreme
• Outside outer rails → extended vs that tier’s volatility band
────────────────────────────────────────
2) Why it’s useful (and why it’s not a mashup)
────────────────────────────────────────
This is not a bundle of unrelated indicators. Everything serves one cohesive purpose:
• Visualize trend + volatility lanes across multiple time horizons
• Keep rails consistent and readable (levels, fills, outlines)
• Optional multi-timeframe aggregation for structure context
• A compact 6-alert set to catch key transitions without alert spam
────────────────────────────────────────
3) What you see on the chart
────────────────────────────────────────
For each level (L1–L4), you can show:
• Upper/Lower Inner rails
• Upper/Lower Outer rails
• Optional center fill (between outer rails) = operating range
• Optional MA line per tier (off by default to reduce clutter)
• Base WMA line (L1 MA) if enabled
Suggested workflow:
• Start with L1 + L2 only
• Add L3/L4 once you like the structure view
• Use Dynamic Opacity if the chart feels crowded
────────────────────────────────────────
4) How it works (transparent formula)
────────────────────────────────────────
For each tier:
• MA = WMA(source, baseLen × levelMultiplier)
• ATR_like = Wilder ATR (default)
OR WMA(TrueRange, atrLen × levelMultiplier)
Inner rails:
• upperInner = MA + ATR_like × innerMult
• lowerInner = MA - ATR_like × innerMult
Outer rails:
• upperOuter = MA + ATR_like × outerMult
• lowerOuter = MA - ATR_like × outerMult
Tier behavior:
• L1 uses the chart timeframe
• L2–L4 can use user-selected HTFs (defaults: 4H / D / W)
or optional auto-selection
────────────────────────────────────────
5) Multi-timeframe behavior + interpolation
────────────────────────────────────────
• L2–L4 use request.security() with lookahead OFF (no future data).
• HTF bands naturally “step” when the HTF candle confirms.
• Interpolate HTF Bands (optional): visually blends from the prior confirmed HTF value to the current confirmed HTF value to reduce stepping. This is display smoothing, not prediction.
Repaint note:
• If Live Interp (Repaints) is enabled, the HTF lines can update intrabar and may repaint. Keep it OFF for strict non-repainting behavior.
────────────────────────────────────────
6) Auto-select L2/L3/L4 (optional)
────────────────────────────────────────
Two modes:
A) Ladder (deterministic)
• Picks “bigger” timeframes relative to the chart (simple and fast).
B) Score (data-driven)
• Tests candidate timeframes and scores them using:
• Coverage: % of closes inside the OUTER band over Score Lookback
• Width: average outer-band width as a fraction of MA
• Targets: Target Coverage + Target Width
• Weights: Coverage Weight + Width Weight
Performance notes:
• Score mode is heavier (many candidates).
• “Lock auto-select after first pick” is recommended to reduce load and avoid platform limits.
────────────────────────────────────────
7) Alerts (6 total, aggregated across L1–L4)
────────────────────────────────────────
Alerts trigger if ANY tier meets the condition:
• Cross ABOVE an OUTER band
• Cross BELOW an OUTER band
• Cross ABOVE an INNER band
• Cross BELOW an INNER band
• Price is OUTSIDE ABOVE an OUTER band
• Price is OUTSIDE BELOW an OUTER band
These are intentionally aggregated to keep the alert count small while catching meaningful transitions.
────────────────────────────────────────
8) Limitations & transparency
────────────────────────────────────────
• Indicator only (not a strategy). No performance claims.
• MTF values update when the higher timeframe candle confirms.
• Interpolation is visual smoothing; it does not forecast.
• Non-standard chart types (Heikin Ashi/Renko/etc) may behave differently from standard candles.
• If you enable repainting options, signals/levels may change intrabar.
────────────────────────────────────────
9) Credits/reuse disclosure
────────────────────────────────────────
• Conceptual inspiration: VDUB and the community “VDUB_BINARY_PRO_3_V2” idea of WMA ± TR/ATR × multipliers.
• This version is a reimplementation + extension, adding:
o Multi-tier architecture (L1–L4)
o Higher-timeframe sourcing + optional interpolation
o Optional scoring-based timeframe selection
o Dynamic opacity + streamlined plotting
o Aggregated 6-alert set
No code was copied directly from the older script; this is a rewritten implementation with additional features and different structure.
www.tradingview.com

S/R HTF (D + 4H) | Clusters+Pivots | Stable | Styles+AlertsThis indicator plots higher-timeframe Support/Resistance levels based on the Daily and 4-Hour charts, and keeps them stable (not dependent on how much history is loaded or how you scroll/zoom).
What it does
Daily levels (D) are calculated from the last lenD closed daily candles (default: 120).
4H levels (240) are calculated from the last lenH4 closed 4H candles (default: 300).
Levels come from two sources:
Clusters (value areas): prices where candle closes occur frequently within a narrow range.
The range width is derived from ATR × step multiplier.
Pivots: recent pivot highs and pivot lows (with left/right pivot settings).
The script merges nearby levels (within a tolerance) to avoid duplicates.
Stability / update logic
Levels are computed with request.security() on "D" and "240", so the result is independent of the chart timeframe you’re currently viewing.
Lines are drawn using bar time anchoring and extend mode, so they remain fixed to price and do not “jump” when you zoom or scroll.
Levels are recalculated on a calendar schedule (default: every 2 days, timeframe "2D"). Between recalculations, levels remain unchanged.
Visual customization
From the settings panel you can configure:
Show/hide Daily and/or 4H levels
Show/hide Clusters and/or Pivots
Line width for clusters and pivots
Line style (Solid / Dashed / Dotted) for clusters and pivots
Colors and opacity for Daily and 4H lines
Line extension: Left / Right / Both
Alerts
The indicator can trigger alerts when price:
Touches a level (bar range crosses the level: high >= level and low <= level)
Approaches a level (distance is within a threshold)
Approach threshold can be defined as:
Ticks
ATR multiplier
Percent of price
To use dynamic alert text (level + distance):
Create an alert in TradingView using: “Any alert() function call”.
Notes / limitations
“Last N candles” depends on available symbol history; if the symbol doesn’t have enough Daily/4H history, some levels may be na.
Cluster quality depends on ATR-based bin size; adjusting the step multipliers can improve results per instrument and volatility regime.

Multi Condition Stock Screener & Alert SystemMulti Condition Stock Screener & Strategy Builder
This script is a comprehensive Stock Screener and Strategy Builder designed to scan predefined groups of stocks (specifically focused on BIST/Istanbul Stock Exchange symbols) or a custom list of symbols based on user-defined technical conditions.
It allows users to combine multiple technical indicators to create complex entry or exit conditions without writing code. The script iterates through a list of symbols and triggers alerts when the conditions are met.
Key Features
• Custom Strategy Building: Users can define up to 6 separate conditions. • Logical Operators: Conditions can be linked using logical operators (AND / OR) to create flexible strategies. • Predefined Groups: Includes 14 groups of stocks (covering BIST symbols) for quick scanning. • Custom Scanner: Users can select the "SPECIAL" group to manually input up to 40 custom symbols to scan. • Directional Scanning: Capable of scanning for both Buy/Long and Sell/Short signals. • Alert Integration: Generates JSON-formatted alert messages suitable for webhook integrations (e.g., sending notifications to Telegram bots).
Supported Indicators for Conditions
The script utilizes built-in ta.* functions to calculate the following indicators:
• MA (Moving Average): Supports EMA, SMA, RMA, and WMA. • RSI (Relative Strength Index) • CCI (Commodity Channel Index) • ATR (Average True Range) • BBW (Bollinger Bands Width) • ADX (Average Directional Index) • MFI (Money Flow Index) • MOM (Momentum)
How it Works
The script uses request.security() to fetch data for the selected group of symbols based on the current timeframe. It evaluates the user-defined logic (Condition 1 to 6) for each symbol.
• Comparison Logic: You can compare an indicator against a value (e.g., RSI > 50 ) or against another indicator (e.g., MA1 CrossOver MA2 ). • Signal Generation: If the logical result is TRUE based on the "AND/OR" settings, a visual label is plotted on the chart, and an alert condition is triggered.
Alert Configuration
The script produces a JSON output containing the Ticker, Signal Type, Period, and Price. This is optimized for users who want to parse alerts programmatically or send them to external messaging apps via webhooks.
Disclaimer This tool is for informational purposes only and does not constitute financial advice. Since it uses request.security across multiple symbols, please allow time for the script to load data on the chart.

Pi Cycle BTC Top + Pre-Alert BandsPi Cycle BTC Top + Pre-Alert Bands is an advanced implementation of the classic Pi Cycle Top model, designed for Bitcoin cycle analysis on higher timeframes (especially 1D BTCUSD/BTCUSD·INDEX).
The original Pi Cycle Top uses two moving averages:
• 111-day SMA (short MA)
• 350-day SMA ×2 (long MA)
A Pi Top is signaled when the 111 SMA crosses above the 350×2 SMA. Historically, this has occurred near major BTC cycle highs.
This script extends that idea with a 3-step early-warning sequence:
• Pi Green – early compression: short/long MA ratio crosses upward into the green band (convergence from below is required).
• Pi Yellow – mid-cycle warning: only fires if a valid Green has already occurred in the same cycle.
• Pi Cycle Top – final top: the classic Pi Cycle cross, limited to one top signal per cycle. After a top, no new Yellow or Top signals can appear until a new Green event starts the next cycle.
Background shading shows the active phase (Green / Yellow / late-cycle zone), so you can see at a glance where BTC is within its Pi-based macro structure.
All logic is non-repainting: request.security() uses lookahead_off and no future data is accessed.
Typical use
This indicator is intended as a macro-cycle timing and risk-awareness tool, not a stand-alone entry system. Many traders use it to:
• Watch for Pi Green as the start of a potential late-cycle advance.
• Treat Pi Yellow as a rising-risk environment and tighten risk management.
• Use the Pi Cycle Top as a historical high-risk zone where large profit-taking or hedging may be considered.
Always combine this with your own analysis (trend, volume, on-chain, macro) before making decisions.
How to set alerts
Add the indicator to your chart (1D BTCUSD or BTCUSD·INDEX recommended).
Click Alerts → Condition → Pi Cycle BTC Top + Pre-Alert Bands.
Choose one of:
• Pi Cycle – Green Pre-Alert (early convergence)
• Pi Cycle – Yellow Pre-Alert (after Green only)
• Pi Cycle – TOP (Single per Cycle, after Green)
Use “Once per bar close” for higher-timeframe reliability.
Disclaimer
This tool is for educational and analytical purposes only. The Pi Cycle concept is based on historical behavior and does not guarantee future results. This is not financial advice; always do your own research and manage risk appropriately.

WASDE Dates V2WASDE Dates V2 – USDA Release Calendar with Alerts, Countdown & Event Markers
By cot-trader.com
WASDE Dates V2 is a complete and reliable visualization tool for all scheduled WASDE (World Agricultural Supply and Demand Estimates) releases for 2025 and 2026.
The USDA’s WASDE report is one of the most market-moving fundamental catalysts in agricultural futures—affecting Corn (ZC), Wheat (ZW), Soybeans (ZS), Soymeal (ZM), Soybean Oil (ZL), and many related CFD products.
This script gives traders a precise timing layer directly inside their TradingView charts.
🔍 What this script does
WASDE Dates V2 automatically:
Marks each WASDE release day with a vertical line and label.
Shows an automated countdown to the next WASDE release:
In days (>24h)
In hours & minutes (<24h)
Displays an optional table of upcoming WASDE dates for quick reference.
Provides two alert conditions:
WASDE Day Alert – triggers exactly on the event
WASDE 24h Reminder – pre-alert when less than 24 hours remain
Handles both 2025 and 2026 confirmed dates.
Works on any symbol and timeframe.
📌 Why WASDE matters
The WASDE report updates global supply and demand estimates for:
Corn
Soybeans
Wheat
Other major agricultural commodities
Changes in yield, acres, production, imports/exports, and ending stocks can cause immediate and significant volatility.
Many traders combine WASDE awareness with seasonality, COT positioning, volatility filters, or fundamental models.
This script ensures you never miss the timing of these key releases.
⚙️ How the script works
The script stores official USDA WASDE release dates for 2025 and 2026 in two dedicated arrays.
On every bar, it compares the bar’s timestamp with known WASDE timestamps to detect an event day.
When an event occurs:
A red “WASDE” label is plotted above the candle
A dotted vertical line is drawn through the bar
It finds the next upcoming WASDE by scanning forward through both arrays.
A live-updating countdown label is displayed, showing days or hours/minutes until release.
If the event is less than 24 hours away:
A yellow “WASDE soon” warning appears near price
The 24h alert condition becomes active
An optional table lists upcoming events for 2025 & 2026.
This script does not generate trading signals.
It provides a time-based event layer designed to complement any discretionary or algorithmic trading approach.
🧭 How to use
Add the script to your chart.
Enable alerts for:
“WASDE Day Alert”
“WASDE 24h Reminder”
Follow the countdown to prepare for upcoming volatility.
Use together with other agricultural tools such as:
Seasonality indicators
COT (Commitment of Traders) analysis
Trend / VWAP / Volume signals
Pre- and post-WASDE trading strategies
Works on all chart types, all symbols, and all timeframes.
📅 Included WASDE Dates (Confirmed)
2025:
Jan 12, Feb 11, Mar 11, Apr 10, May 12, Jun 12, Jul 11, Aug 12, Sep 12, Oct 9, Nov 10, Dec 9
2026:
Jan 12, Feb 10, Mar 10, Apr 9, May 12, Jun 11, Jul 10, Aug 12, Sep 11, Oct 9, Nov 10, Dec 10
(All dates based on USDA’s official 12:00pm ET schedule.)
💡 What makes this script original
Fully updated 2025 + 2026 calendar
Uses a robust time-comparison method for accurate marking
Unique dual alert system (event + 24h pre-alert)
Clean, readable layout with countdown + upcoming dates table
Tailored specifically for grain & agricultural traders
Built entirely in Pine Script v6 with careful attention to performance

ORB 30 Alerts (ATH)Overview
ATH ORB 30m automates the Opening Range Breakout (ORB) process across multiple global sessions — Tokyo, London, and New York — and delivers clean, consolidated alerts when fresh breakouts occur.
It’s built for traders who track several tickers and want precise, non-repeating signals that reflect genuine momentum shifts, not constant noise.
How it works
The script defines a 30-minute Opening Range (ORB) for each enabled session and plots its high, low, and midpoint levels.
Every 10-minute candle close is evaluated to detect first-time crosses of those range boundaries — upward or downward.
Once a breakout triggers, that side’s alert is disabled until price returns inside the range, where the system automatically re-arms.
Multiple triggers in the same bar are batched into one combined alert, listing all symbols that broke out.
A built-in debug panel and optional chart labels visualize each trigger and re-arm event in real time.
Key features
-Multi-session ORB logic (Tokyo, London, New York)
-10-minute confirmation filter to validate breakouts
-Automatic alert re-arming when price re-enters range
-Combined per-bar alert messages (no duplicates)
-Optional on-chart labels and debug diagnostics
-Optimized for watchlists and multi-symbol scanners
Usage
Designed for day traders and momentum scalpers, this tool highlights early directional strength during market opens.
Add it to your chart, enable your preferred sessions, and set alert conditions for “ORB Breakouts (BUY),” “ORB Breakdowns (SELL),” or "Any alert() function call" You’ll receive one concise message each bar showing exactly which symbols broke out and in which direction.
DISCLAIMER:
This script is for educational and informational purposes only.
It does not constitute financial advice or a recommendation to buy or sell any security.
Always perform your own due diligence and backtesting before using any trading strategy live.
Trading involves risk; past performance does not guarantee future results.

Strat 1-2 Break AlertsThe Strat 1-2 Break Alerts
by Yolanda Marie Dixon
This indicator automatically identifies Inside Bars (1) and alerts when price breaks out into a 2-1-2 Bullish or 2-1-2 Bearish setup — two of the most actionable patterns in The Strat methodology created by Rob Smith.
📊 What It Does:
Marks Inside Bars with a yellow triangle below the candle.
Plots a green “2-1-2↑” triangle when a bullish breakout occurs.
Plots a red “2-1-2↓” triangle when a bearish breakdown occurs.
Provides built-in alerts so traders never miss a 2-1-2 setup.
💡 How to Use It:
Add the indicator to your chart, then go to Alerts → Create Alert → Condition: Strat 1-2 Break Alerts, and choose either 2-1-2 Up or 2-1-2 Down.
Perfect for traders who follow The Strat and want simple, reliable visual and alert-based signals for 1-2 setups.
—
🔔 Stay ready, stay Stratified.
Master The Strat with instant alerts for every 2-1-2 breakout.

AI Trading Alerts v6 — SL/TP + Confidence + Panel (Fixed)Overview
This Pine Script is designed to identify high-probability trading opportunities in Forex, commodities, and crypto markets. It combines EMA trend filters, RSI, and Stochastic RSI, with automatic stop-loss (SL) & take-profit (TP) suggestions, and provides a confidence panel to quickly assess the trade setup strength.
It also includes TradingView alert conditions so you can set up notifications for Long/Short setups and EMA crosses.
⚙️ Features
EMA Trend Filter
Uses EMA 50, 100, 200 for trend confirmation.
Bull trend = EMA50 > EMA100 > EMA200
Bear trend = EMA50 < EMA100 < EMA200
RSI Filter
Bullish trades require RSI > 50
Bearish trades require RSI < 50
Stochastic RSI Filter
Prevents entries during overbought/oversold extremes.
Bullish entry only if %K and %D < 80
Bearish entry only if %K and %D > 20
EMA Proximity Check
Price must be near EMA50 (within ATR × adjustable multiplier).
Signals
Continuation Signals:
Long if all bullish conditions align.
Short if all bearish conditions align.
Cross Events:
Long Cross when price crosses above EMA50 in bull trend.
Short Cross when price crosses below EMA50 in bear trend.
Automatic SL/TP Suggestions
SL size adjusts depending on asset:
Gold/Silver (XAU/XAG): 5 pts
Bitcoin/Ethereum: 100 pts
FX pairs (default): 20 pts
TP = SL × Risk:Reward ratio (default 1:2).
Confidence Score (0–4)
Based on conditions met (trend, RSI, Stoch, EMA proximity).
Labels:
Strongest (4/4)
Strong (3/4)
Medium (2/4)
Low (1/4)
Visual Panel on Chart
Shows ✅/❌ for each condition (trend, RSI, Stoch, EMA proximity, signal now).
Confidence row with color-coded strength.
Alerts
Long Setup
Short Setup
Long Cross
Short Cross
🖥️ How to Use
1. Add the Script
Open TradingView → Pine Editor.
Paste the full script.
Click Add to chart.
Save as "AI Trading Alerts v6 — SL/TP + Confidence + Panel".
2. Configure Inputs
EMA Lengths: Default 50/100/200 (works well for swing trading).
RSI Length: 14 (standard).
Stochastic Length/K/D: Default 14/3/3.
Risk:Reward Ratio: Default 2.0 (can change to 1.5, 3.0, etc.).
EMA Proximity Threshold: Default 0.20 × ATR (adjust to be stricter/looser).
3. Read the Panel
Top-right of chart, you’ll see ✅ or ❌ for:
Trend → Are EMAs aligned?
RSI → Above 50 (bull) or below 50 (bear)?
Stoch OK → Not extreme?
Near EMA50 → Close enough to EMA50?
Above/Below OK → Price position vs. EMA50 matches trend?
Signal Now → Entry triggered?
Confidence row:
🟢 Green = Strongest
🟩 Light green = Strong
🟧 Orange = Medium
🟨 Yellow = Low
⬜ Gray = None
4. Alerts Setup
Go to TradingView Alerts (⏰ icon).
Choose the script under “Condition”.
Select alert type:
Long Setup
Short Setup
Long Cross
Short Cross
Set notification method (popup, sound, email, mobile).
Click Create.
Now TradingView will notify you automatically when signals appear.
5. Example Workflow
Wait for Confidence = Strong/Strongest.
Check if market session supports volatility (e.g., XAU in London/NY).
Review SL/TP suggestions:
Long → Entry: current price, SL: close - risk_pts, TP: close + risk_pts × RR.
Short → Entry: current price, SL: close + risk_pts, TP: close - risk_pts × RR.
Adjust based on your own price action analysis.
📊 Best Practices
Use on H1 + D1 combo → align higher timeframe bias with intraday entries.
Risk only 1–2% of account per trade (position sizing required).
Filter with market sessions (Asia, Europe, US).
Strongest signals work best with trending pairs (e.g., XAUUSD, USDJPY, BTCUSD).

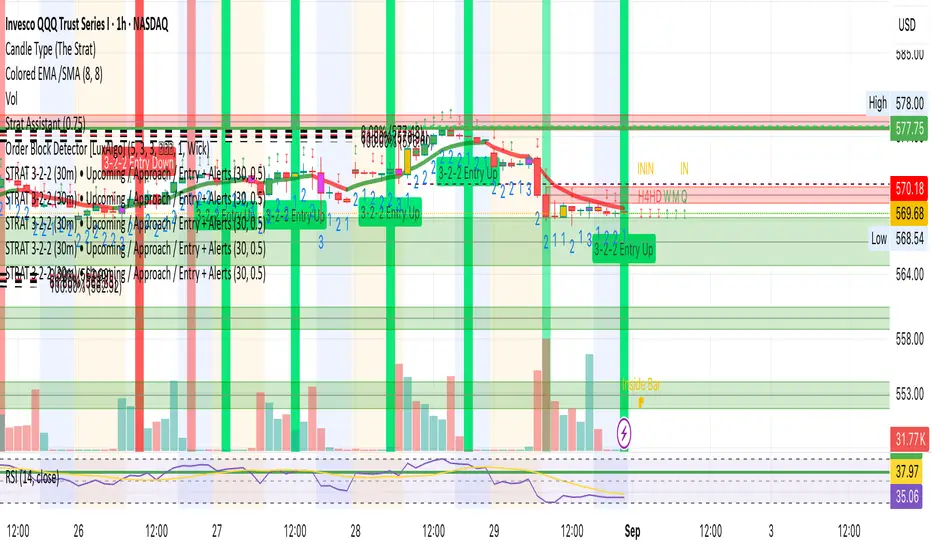
STRAT 3-2-2 (30m) • Upcoming / Approach / Entry + AlertsThis indicator is built for The STRAT trading method, specifically the 3-2-2 reversal pattern. It monitors price action on the 30-minute timeframe (HTF = 30m) and visually/alert-wise highlights where a 3-2-2 setup, approach, or entry trigger occurs.
---
⚙️ How it works
1. Detects bar types:
3 (Outside Bar) = range breaks both high & low of the previous bar
2u (Up bar) = higher high, not outside
2d (Down bar) = lower low, not outside
1 (Inside bar) = fully contained within prior bar
2. Looks for 3-2-2 setups:
Bullish 3-2-2 = 3 → 2d → 2u (expect reversal UP)
Bearish 3-2-2 = 3 → 2u → 2d (expect reversal DOWN)
3. Defines trigger levels:
Bullish trigger = high of the first “2d” bar
Bearish trigger = low of the first “2u” bar
4. Signals 3 phases:
Upcoming: pattern is forming, second “2” hasn’t triggered yet
Approach: price comes within 50% (adjustable) of the trigger level
Entry: price breaks the trigger (actual reversal confirmation)
5. Visualization:
Labels above/below candles show “Approach” and “Entry”
Background or bar colors (toggle in settings) highlight Setup / Approach / Entry
Optional dotted line marks the trigger level for clarity
---
🔔 Alerts
Two alert systems are built in:
1. Safe static conditions (for normal TradingView alert setup):
APPROACH: Bullish 3-2-2 (30m)
APPROACH: Bearish 3-2-2 (30m)
ENTRY: Bullish 3-2-2 (30m)
ENTRY: Bearish 3-2-2 (30m)
2. Dynamic messages (using alert() calls with price info):
If you create an alert with “Any alert() function call”, the pop-up will include the trigger price.
---
📋 Inputs (Settings)
Signal timeframe (HTF) → default 30m
Confirm signals at HTF bar close → waits for bar close (non-repainting)
Approach = % of first '2' bar range → default 50%
Show labels → On/Off
Color candles instead of background → toggle between candle color vs. chart background
ORB Breakouts with alerts"ORB Breakouts with Alerts" is a utility indicator that highlights an Opening Range Breakout (ORB) setup during a user-defined intraday time window. It allows traders to visualize price consolidation ranges and receive alerts when price breaks above or below the session high/low.
🔧 Features:
*Customizable session time (start and end), adjustable to local time using a timezone offset.
*Automatically plots:
*A shaded box around the session's high and low.
*Horizontal lines at session high and low levels.
*Optional "BUY"/"SELL" labels to mark breakout directions.
*Visual breakout signals when price crosses above or below the session range.
*Built-in alerts to notify when breakouts occur.
*Configurable styling options including box color, highlight color, and label placement.
⚙️ How It Works:
*During the defined time range, the script tracks the highest high and lowest low.
*After the session ends:
*A box is drawn to represent the opening range.
*Breakouts above the high or below the low trigger visual markers and optional alerts.
*Alerts are limited to one per direction per day to reduce noise.
⚠️ This indicator is a technical analysis tool only and does not provide financial advice or trade recommendations. Always use with proper risk management and in conjunction with your trading plan.

Sunmool's Next Day Model FVG AlertNY Killzone FVG Alert - ICT Fair Value Gap Detection Indicator
This comprehensive Pine Script indicator is specifically designed for traders following ICT (Inner Circle Trader) methodology and Smart Money Concepts. The indicator automatically detects Fair Value Gaps (FVG) that occur during the New York Killzone session, providing real-time alerts when these critical market imbalances are identified.
Key Features:
🎯 Fair Value Gap Detection
Automatically identifies bullish and bearish Fair Value Gaps using the classic 3-candle pattern
Filters gaps based on customizable minimum size thresholds to avoid insignificant imbalances
Provides visual representation through colored boxes and labels for easy identification
⏰ New York Killzone Focus
Specifically monitors the NY Killzone session (default: 7:00 AM - 10:00 AM EST)
Fully customizable session times to accommodate different trading preferences
Only detects FVGs when all three candles forming the gap occur within the killzone timeframe
📅 ICT Next Day Model Compliance
Automatically excludes Mondays from FVG detection as per ICT Next Day Model principles
Optional Monday exclusion can be toggled on/off based on trading strategy
Ensures alignment with professional ICT trading methodologies
🔔 Advanced Alert System
Three distinct alert conditions: Bullish FVG, Bearish FVG, and Combined alerts
Customizable alert messages for different notification preferences
Compatible with TradingView's full alert system including email, SMS, and webhook notifications
🎨 Visual Customization
Adjustable colors for bullish and bearish FVG boxes
Configurable box extension length for better visualization
Optional background highlighting during killzone sessions
Clean, professional chart presentation that doesn't clutter your analysis
📊 Technical Specifications
Works on all timeframes, though most effective on intraday charts (1m, 5m, 15m)
Timezone-aware calculations ensure accurate session detection globally
Efficient code structure minimizes processing load and chart lag
Compatible with other indicators and doesn't interfere with existing chart setups
🎯 Ideal For:
ICT methodology traders seeking automated FVG detection
Smart Money Concepts practitioners
Scalpers and day traders focusing on NY session
Traders looking to identify high-probability entry zones
Anyone interested in market structure and liquidity concepts
📈 Trading Applications:
Fair Value Gaps often serve as areas where price may return to "fill" the imbalance, making them excellent zones for:
Potential reversal areas
Take profit targets
Stop loss placement reference points
Market structure analysis
Confluence with other ICT concepts
⚙️ Customizable Parameters:
FVG minimum size filter
Killzone session start/end times
Visual display options
Alert preferences
Color schemes and styling options
This indicator brings institutional trading concepts to retail traders, helping identify the same market inefficiencies that smart money targets. By focusing specifically on the New York Killzone - one of the most liquid and volatile trading sessions - it provides high-quality signals during optimal market conditions.
Whether you're new to ICT concepts or an experienced trader looking to automate your FVG detection, this indicator provides the precision and reliability needed for professional trading analysis.

Trend Display Table (with Change Alerts)📌 Indicator: Trend Display Table (with Change Alerts)
This indicator helps identify trend direction based on a 15-minute 20 SMA compared against a 10 EMA applied to that SMA.
Trend Logic:
Bullish → 20 SMA crosses above 10 EMA (on SMA values)
Bearish → 20 SMA crosses below 10 EMA (on SMA values)
Neutral → No crossover (trend continues from previous state)
Display:
A compact trend table appears on the chart (top-right), showing the current trend with customizable colors, font size, and background.
Alerts:
Alerts are triggered only when the trend changes (from Bullish → Bearish or Bearish → Bullish).
This prevents repeated alerts on every bar.
✅ Useful for:
Confirming higher timeframe trend bias
Filtering trades in choppy markets
Getting notified instantly when the trend flips
