Gap Reversion StrategyToday I am releasing to the community an original short-term, high-probability gap trading strategy, backed by a 20 year backtest. This strategy capitalizes on the mean reverting behavior of equity ETFs, which is largely driven by fear in the market. The strategy buys into that fear at a level that has historically mean reverted within ~5 days. Larry Connors has published useful research and variations of strategies based on this behavior that I would recommend any quantitative trader read.
What it does:
This strategy, for 1 day charts on equity ETFs, looks for an overnight gap down when the RSI is also in/near an oversold position. Then, it places a limit order further below the opening of the gapped-down day. It then exits the position based on a higher RSI level. The limit buy order is cancelled if the price doesn't reach your limit price that day. So, the larger you make the gap and limit %, the less signals you will have.
Features:
Inputs to allow the adjustment of the limit order %, the gap %, and the RSI entry/exit levels.
An option to have the limit order be based on a % of ATR instead of a % of asset price.
An optional filter that can turn-off trades when the VIX is unusually high.
A built in stop.
Built in alerts.
Disclaimer: This is not financial advice. Open-source scripts I publish in the community are largely meant to spark ideas that can be used as building blocks for part of a more robust trade management strategy. If you would like to implement a version of any script, I would recommend making significant additions/modifications to the strategy & risk management functions. If you don’t know how to program in Pine, then hire a Pine-coder. We can help!
Search in scripts for "alert"

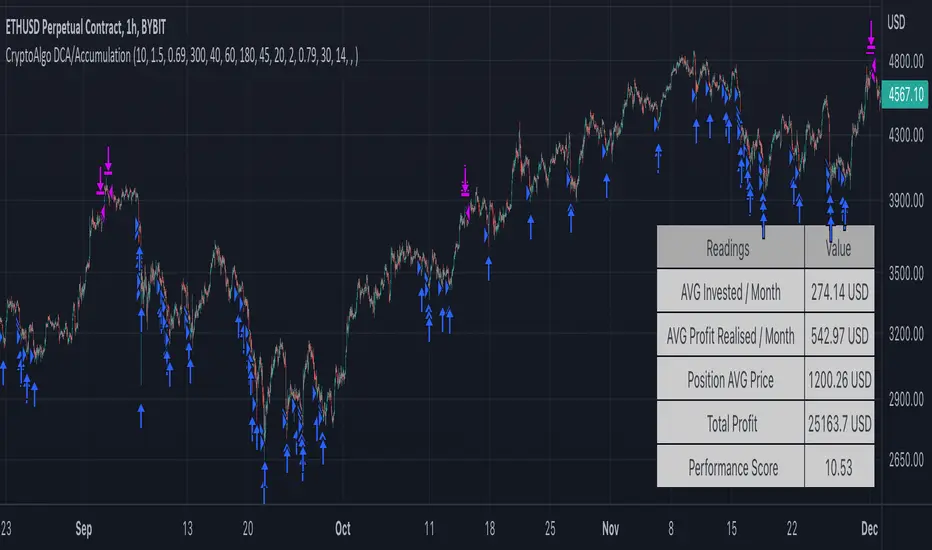
CryptoAlgo DCA / AccumulationThis is a Dollar Cost Average (DCA) / Accumulation strategy. Every time there is a long signal it will buy a fixed USD amount that you have specified in the settings and keep buying at the dips and corrections in the market. This strategy is low-risk, however it assumes you have a long time horizon of at least 2+ years. The longer your holding-period, the better your returns.
There is 3 different entry conditions you can choose from:
The first entry condition is bollinger bands. Bollinger bands is a set of trendlines plotted two standard deviations (positively and negatively) away from a simple moving average (SMA) of an assets price. Every time a candle closes below the lower trendline the strategy will buy.
The second entry condition is the Relative Strength Index (RSI). The RSI is a momentum indicator used in technical analysis that measures the magnitude of recent price changes to evaluate overbought or oversold conditions in the price of a stock or other asset. Every time the RSI is meaning oversold and goes below a point of your choosing the strategy will buy.
The third entry condition is based on pivot points and moving averages that will determine small term trend changes in the market and low price points. Every time there is a bullish trend reversal the strategy will buy.
All three of these entry conditions can be controlled by a higher timeframe RSI that will stop entries when the RSI is above a certain point where the market is overbought and not ideal for accumulation.
The take profits in this strategy is dynamic and will signal trend changes like the third entry condition by using pivot points and moving averages. Since this is a DCA/ Accumulation strategy and will accumulate for the long term it will only exit a small percentage of the accumulated position. This will ensure that you take profit as the asset is appreciating in price while keeping the majority of the position for greater profit in the future.
At the bottom right corner of the chart you will be able to see the key results of the DCA
The first reading is the Average amount USD that the strategy is investing on average every month. This value will help you identify the best settings for you and what USD amount the strategy should enter at the signals so that it stays below the amount you are willing to invest every month. Keep in mind that this is an average and that there will be a lot of deviation up or down based on where the market is going. If the market is having a correction the strategy will signal a lot more entries than when it is going up.
The second reading is the average profit per month. This is also an average and the result will go up exponentially from the starting point as the strategy accumulates and the market appreciates in price.
The third reading is the position average price. This is the average price all the accumulated USD in the asset.
The fourth reading is the total profit. This is the result of both the realised profit from taking profit and the accumulated usd amount left in the position.
The last reading is the performance score. This is a scoring system that i created that looks at the data from the readings and weighs it based on importance and then spits out a number that will help identify the best settings. The higher the number the better the performance, meaning more profit and better DCA.
When you have found the right settings you can insert the messages from your automatic trading platform at the bottom of the inputs and then create an alert with your unique webhook address along with the alert message below:
{{strategy.order.alert_message}}
You will be able to adjust all parameters in the settings.
Enjoy!
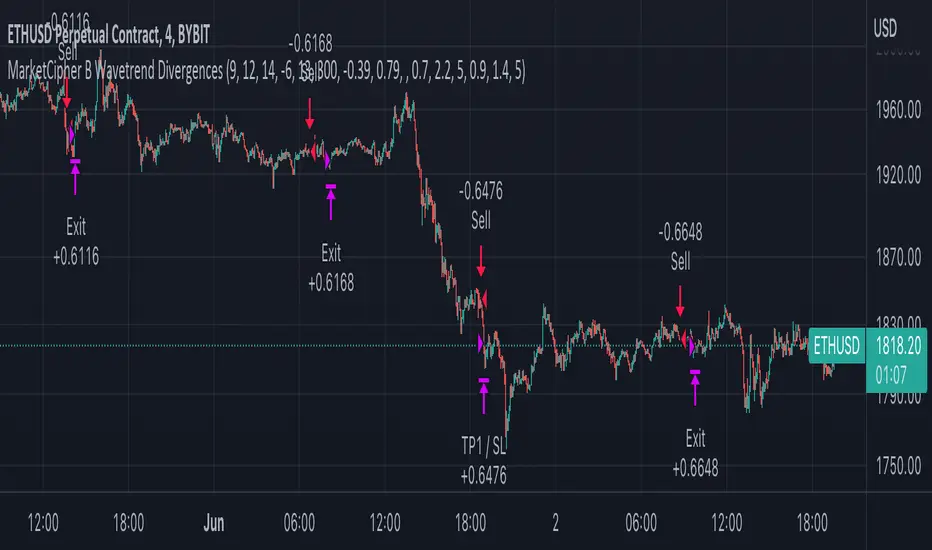
MarketCipher B Wavetrend DivergencesCreated for the MarketCipher Community and friends :)
I have published this before but it was taken down by Tradingview and PineCoders because they wanted a more in depth description so here it is:
This strategy is mainly based on Wavetrend Oscillator by LazyBear / blue momentum waves on MarketCipher B.
The Wavetrend indicator is a combination of 2 oscillator lines that signals the short term direction of the price once the lines cross. The Wavetrend indicator is useful but only once a divergence has been identified based on the crosses and the price which is what this strategy partly uses to open trades.
Here is a list and description of the different conditions that goes into the entries and exits.
Long trade:
1) Bullish divergence, regular or hidden
2) Price is above Exponential Moving Average
3) Chande Momentum Oscillator value is above x
Short trade:
1) Bearish divergence, regular or hidden
2) Price is below Exponential Moving Average
3) Chande Momentum Oscillator value is below x
The Exponential Moving Average (EMA) is a type of moving average that is price based, lagging (or reactive) indicator that displays the average price of a security over a set period of time. The EMA is however different from a normal moving average and values the recent price action. A Moving Average is a good way to confirm trends which is what it is used for in this strategy. If enabled the strategy will only open long trades above the EMA and only short trades below the EMA.
The Chande Momentum Oscillator is a technical momentum indicator and was designed specifically to track the movement and momentum of a security. The oscillator calculates the difference between the sum of both recent gains and recent losses, then dividing the result by the sum of all price movement over the same period. In this strategy it is used like the EMA to filter out bad trades that goes against the trend. The EMA is better at trading the overall trend but the Chande Momentum Oscillator is a lot better at identifying short term market conditions that are favorable for entering at divergences.
One of the most important aspects when creating a trading strategy is to know when to take profit and to make it as dynamic as possible so that it changes to the market conditions. This is what i have tried to do and the reason why this divergence trading strategy works well.
These are the 3 different exit conditions:
1) A dynamic take profit that will signal a short term trend reversal that is based on pivot points and moving averages.
2) Another dynamic take profit based on pivot points that like the previous take profit is used to determine and anticipate potential changes in market price and reversals.
3) A normal % fixed take profit
Photo of what the dynamic take profit looks like on the chart:
The pivot pointexit comes from this indicator that i have helped update and modify from the original script:
When you have found the right settings you can insert the messages from your automatic trading platform at the bottom of the inputs and then create an alert with your unique webhook address along with the alert message below:
{{strategy.order.alert_message}}
I hope this strategy will be useful to automate part of your trading or help you identify and backtest divergences for your manual trading.
Future updates to come.
Enjoy!
TWAP + MA crossover Strategy [Dynamic Signal Lab]Dear TV'ers,
Hereby the strategy script for the TWAP/moving average crossover, with unique taking profit options. moving averages include: EMA , WMA , DEMA , TEMA , VAR, WWMA, ZLEMA , TSF , HULL and TILL.
Use the TWAP as the slow moving average and use another moving average as the faster/more responsive moving average. Finally, you can use a green fill to visualize how much you are in profit from your entry point.
Good strategies always involve gradual taking profit, which is also possible in this script.
You can gradually take profit (and set how much%), using the following criteria:
* minimum consecutive green/red candles
* minimum amount of green/red candles in the last 2-8 candles
* both of the above criteria.
The current default properties should be modified to make this strategy cost-effective, but typically 15minutes and higher timeframes (up to 6hr) seem to work well for larger (top10 cap) crypto projects. Don't use this script for small-caps as it will get you rekt.
Additionally, you'll also be able to continuously take profit, making sure you lock in all those sweet profits. Use this script for backtesting and the indicator compagnon to fire your alerts.

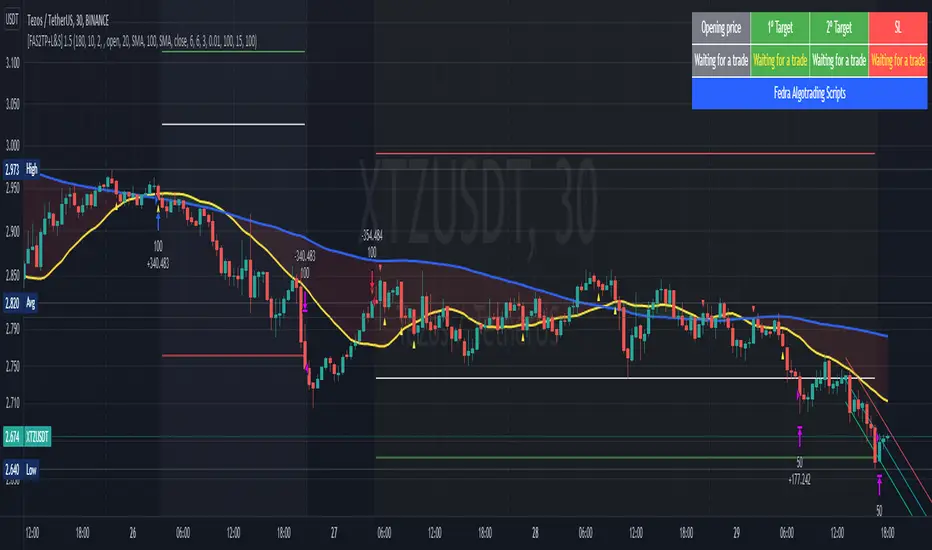
[Fedra Algotrading Strategy 2tp+L&S] Futures Long or ShortStrategy for crypto market, designed for automatic algorithmic trading with bots.
Can place long and short orders
Calculates your entries based on the breakout of the simple deviation of the linear regression of the last X periods.
Configures TP (green line) and SL (red line) percentages, the TP is a trailing TP.
Optionally, you can set a first TP (white line) that sells half of the position.
Advanced trend filter to not open trades against the market. SMA (yellow line), WMA (blue line) and secret sauce
Includes an advanced system to control the backtest period (choose how many days to backtest).
Risk management by volume of capital or amount of losing trades (kill switches that will exit the trade and stop the script)
The script includes default commissions of 0.2% per trade (configurable).
- Dinamic table with Price positions to plan your limit orders if you are trading manually
- Highly customizable and optimizable.
If you want to trade longs and shorts, it is advisable to create 2 different alerts. In most cases, the optimal parameters for longs are not the same as for shorts. In a forthcoming update I will enable separate configurations.
For better performance the script uses real time price information, for this reason Tradingview may warn you that there is "repainting", as the backtest information does not contain the information of each tick but only the open, close, high and low values of each candle.
To avoid this, you can disable the "calculate on every tick" option from the strategy settings panel.
Dynamic length MA Strategy [Dynamic Signal Lab]Dear TV'ers,
Hereby the strategy for the dynamic moving average crossover, with some flexible taking profit options.
All moving averages have the option to dynamically change lengths and different source options. They include:
* Hull MA
* volume-weighted Hull MA
* Simple MA
* Money Flow Index
* Chande Momentum Oscilator
* Arnaud Legoux MA
* Weighted MA
* Linear regression
What makes this strategy special is the fact that you can dynamically shorten the length of moving average length depending on how much you are in profit. The more you are in profit, the shorter the length of the MA will become.
The current default properties should be modified to make this strategy cost-effective, but typically 30minutes and higher timeframes seem to work well for larger (top10 cap) crypto projects. Dont use this script for small-caps as it will get you rekt.
Additionally, you'll also be able to continuously take profit, making sure you lock in all those sweet profits.
Use this script for doing backtesting and the indicator compagnon to fire your alerts.

DayTradingFutures Cross-StrategyOVERVIEW
This indicator was designed to help beginners use a cross over strategy that can be used for entries, exits and to for trend direction.
█ COMPONENTS
Here is a brief overview of the indicator:
Weighted Moving Averages
I find that by using a weighted moving average ( WMA ) to show a crossover, is very close to using a MACD signal line cross or using a RSI signal crossing over the 50/Mid Line. In my main strategy, I use the 5period (fast) and with the crossing of the 20period (slow) WMA for entries and the 50period WMA to show the short term trend. Please note, that I use the 50 period for day trading, if you are using a swing trade or plan on holding positions long term, a higher period may be preferred . All of the moving averages are customizable by color, length, and timeframe. **I feel comfortable trading this strategy at the 5min,10min, and 15min charts.
1 — 5 WMA- this is the white moving average closest to price and is the first part of our small cloud.
2 — 20 WMA - this is the yellow moving average and is the second part of or small cloud.
3 — 50 WMA - this is the directional trend.
Moving Average Clouds
The cloud (which is optional) appears when the trader should be looking to go Long or Sell Short. The dividing line is when both the 5 and 20 periods are over the 50 period.
Trade Management
This is a tool to help with setting your stop loss, break even, and target levels. Currently you can set these based on the current ATR ( Average True Range ).
The “Buy” and “Sell” signals are the ATR indicator based on your risk tolerance (fully customizable). Different ticker symbols will require different ATR values, please back test! When applying your stop loss, drag the stop line to small arrow of the signal callout.
Trading Session
The indicator was designed for beginners to trade during the New York Session (08:30 – 16:00 CST). However, the indicator will ONLY show signals AFTER opening and BEFORE close (09:00 – 14:30 CST). The reason for this is that there is greater volatility during the open and I do not recommend to be in a trade at the end of the session.
Buy and Sell Alerts
Alerts can also be set, when an entry can be made. This prevents a person from having to watch the charts for an extended period of time.
Faults of this strategy:
Time of RANGES/CONSOLIDATION periods and EXTREME VOLITITY KILLs this strategy!! Do not trade this strategy during these periods!!
Disclaimer:
NO strategy is 100% effective! I am not responsible for any loss trades or malfunctions of this code. I recommend to paper trade any new strategy before trading with real money! I am not a financial advisor, trading can be very risky!

AlphaScalp [Backtest, No RealTime]AlphaScalp tries to find volatility moves and profits from the small pullbacks.
Even though the performance of this script in a fair amount of cases will beat HODL it is not the purpose. AlphaScalp aims for a high accuracy and profitfactor to ensure a more or less stable profit taking.
The properties like " MA Length " and the " Short - " or " Long line % " tweaks the risk by increasing or lowering the requirements for a buy (Long or Short). Close/Exit of each order is then handled by TP, SL or volatility stop.
For high volatility assets it is recommended to use the " Sell LONG on Volatility DOWN " and " Sell SHORT on Volatility UP " to ensure a TA approach for StopLoss. Normal SL is also possible to set but is not recommended on high volatility assets since you quickly can be stopped out by wicks.
AlphaScalp works best on high volatility assets with a solid liquidity and volume - but it will also work on stocks and low volatility assets.
AlphaScalp is designed for scalping and is thereby recommended to use between 5M-1H.
This version is free for your to backtest on all assets - but be aware that alerts on RealTime bars are disabled - meaning you can add alerts but they will not trigger in real time. To ensure you have the latest backtesting results, you need to have the script added to your chart, save your chart and the refresh the page.
Enjoy and please let me know if you have any questions

MZ SRSI Strategy V1.0Strategy Introduction
This strategy starts from selection of 1st Moving Average from one of following:
SMA
EMA
DEMA
TEMA
LRC
WMA
MF
VAMA
TMA
HMA
JMA
Kijun v2
EDSMA
McGinley
Then it calculates the RSI of selected 1st Moving Average
In the end it calculates Moving Average of previously calculated RSI and for this purpose 2nd Moving Average is also selected from above list.
Cross of RSI and its Moving Average generates Strategy Alerts
Only long trades are enabled currently
Default Settings
I've set the default selection to the perfect options for 1D and 4h timeframes. You can modify both MAs selection and their length according to your selected timeframe.
Following default settings are used:
Heiken Ashi Candles are selected by default as source
1st Moving Average selection is set to LRC (Linear Regression Curve)
Length of 1st Moving Average is set to 50
RSI length is set to 2 because it is supposed to be fast
2nd Moving Average of RSI is set to TMA (Triangular Moving Average)
Length of 1st Moving Average is set to 5
Start date is set to 2011
Backtesting can also be done selecting %age of equity
Suggestions for Usage
Mostly winning trades have no prominent drawdown so losing trades can be abolished with Stoploss. Would soon add Stoploss, MTF and Takeprofit options in next version. Also if you want an alerts version of it then just comment below and would publish it later. I’ve found this strategy useful on 1D and 4h timeframes with described default settings.

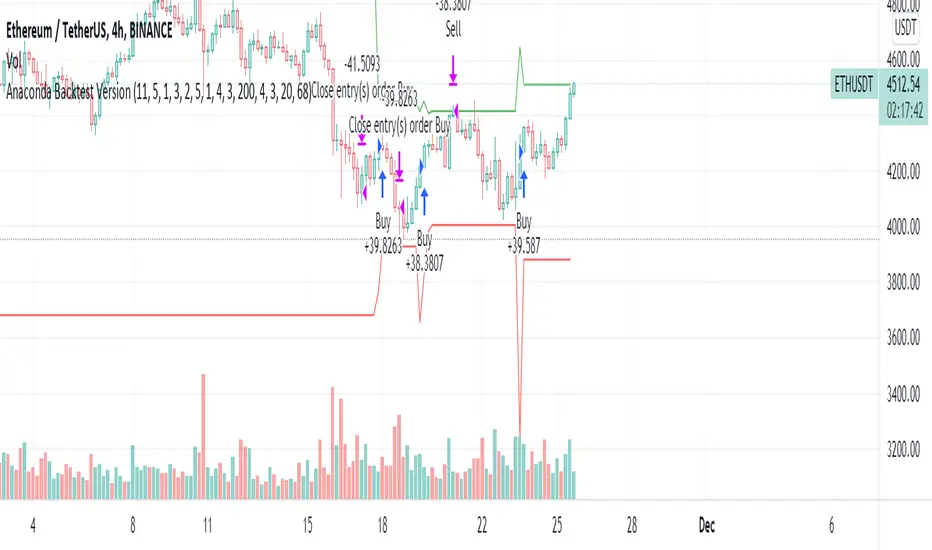
Anaconda Backtest VersionThis is the Anaconda strategy backtest version, no alerts. It will execute orders up to current_date - 2 days.
This is a LONG only strategy.
Anaconda waits for some thresholds to enter long. Once it enters long, it will setup profit and stoploss targets. These targets are updated if some conditions are met. The position is closed when the price hits profit or stoploss targets or when a certain bearish threshold is met.
No portfolio management is integrated. Positions are supposed to be entered with 100% equity and closed at 100%.
The strategy works better for large timeframes : 1h, 2h, 3h, 4h, 1D ...
You can apply the strategy to any symbol supported by TardingView and fine-tune the settings for the selected market/timeframe.
The strategy is supposed to be used on regular candles.
security() function has not been used. No special candles have been used (heikin ashi, renko etc.). Trailing stop (trail_* variables) have not been used.
==================
EXAMPLE SETTINGS
==================
These are the example settings for some assets that make the strategy perform well in the backtest mode.
Settings are listed in order of appearance in the strategy settings dialog in TradingView.
Please note that exaggerated profits for some symbols may come from the fact that the minimum ticker size of that symbol has been increased (from 0.0001 to 0.001 for example) between the start date and end date of the backtest. So you will see some trades closing outside the candle's ohlc range. Unfortunately, this is a limitation in TV and can't do much about it.
BNB/USDT (4h) : 11,5,1,3,10,4,1,4,5,200,6,2,19 (rsi threshold = 50)
FTM/USDT (1h) : 11,8,3,4,5,5,1,5,7,400,5,3,20 (rsi threshold=50)
ETH/USDT (4h) : 11,5,1,3,2,5,1,4,3,200,4,3,20 (rsi threshold = 68)
MATIC/USDT (1h) : 9,10,3,4,6,7,1,6,7,200,2,5,18 (rsi threshold = 70)
DASH/USDT (4h) : 8,8,3,3,4,4,1,7,5,200,3,2,21 (no rsi)
BAT/USDT (4h) : 8,8,3,3,7,7,1,8,6,200,3,2,21 (rsi threshold = 40)
BAT/USDT (1h) : 9,9,3,6,6,7,1,7,7,300,6,4,21 (no rsi)
DOGE/USDT (1h) : 11,8,3,4,4,9,1,4,6,200,3,2,18 (rsi thresold = 70)
NKN/USDT (1h) : 6,7,3,4,2,8,3,5,8,200,6,3,15 (rsi threshold = 50)
BTC/USDT (4h) : 6,5,3,4,7,6,5,5,6,200,2,3,15 (no rsi)
BTC/USDT (3h) : 6,5,3,4,7,5,1,6,4,300,2,2,17 (no rsi)
NRTH_ Smart SignalsA Custom Unique indicator by NRTH_
Comes included with the Premium Package.
NRTH_ Smart Signals is made up of over 5+ indicators and custom calculation methods. Get access to a full set of trading tools & relevant data all within one indicator to give you the levels of confluence you need.
Smart Signals works in any market & allows users to:
Detect the direction of trends in the price using two different algorithms designed for both trend following and contrarian traders.
Get automatic pivot point levels in real-time.
Filter out noise with the MA Trend Filter
Built-In Alerts
Visual Risk Management
Customizable Entry Rules
2 Calculation Methods
Get Confirmation
Use our MA Trend filter to detect the direction of trends for any asset & on any timeframe allowing traders to increase their confidence in positions and follow trends. The larger the cloud, the larger the trend.
Choose between the two calculation methods:
Leading
More sensitive
Designed to predict moves based on market data
Lagging
Less sensitive
Waits for confirmation signals
Both calculation methods have the possibility to adjust the sensitivity of these signals to market price variations, as well as the option to make them less sensitive to ranging markets so that you can trade only the variations you want.
The algo uses both momentum and trend calculation to find an entry, highly recommended use with the built-in MA Filter for best results.
Trade 24/7 without pressing a button
Smart Signals has integrated alerts which give you the ability to automate your signals with 3rd party applications. Simply adjust the sensitivities for your market and trade on autopilot.
You can also use Heikin Ashi Charts with the algo IF you only place limit orders on the exact price line that the trade outputs to ensure accurate real-time results
(Heikin Ashi trading is NOT recommended for automated trading, manual limit orders must be placed in order to match real-time results with backtested data)
Backtesting Results Info
Period 7/7/2021-15/11/2021
Entry value at $1000 with 10x leverage
Binance standard taker fee rate (0.04%)
ATR Exits : 1:2 RR
-------------------------------------------
Disclaimer
Copyright NRTH_ Indicators 2021.
NRTH_ and all affiliated parties are not registered as financial advisors. The products & services NRTH_ offers are for educational purposes only and should not be construed as financial advice. You must be aware of the risks and be willing to bear any level of risk to invest in financial markets. Past performance is not necessarily indicative of future results. NRTH_ and all individuals associated assume no responsibility for your trading results or investments.
All investments involve risk, and the past performance of a security, industry, sector, market, financial product, trading strategy, or individual’s trading does not guarantee future results or returns. Investors are fully responsible for any investment decisions they make. Such decisions should be based solely on an evaluation of their financial circumstances, investment objectives, risk tolerance, and liquidity needs.
Instagram

[Fedra Algotrading Strategy Futures Signals]Linear Regression + Take Profit and Percentage Stop Loss
Optimize the parameters in backtesting to find the best entries, define your profit and risk strategy, take advantage of statistics and make trades without letting the psychological factor make you commit mistakes.
The strategy chooses the time to buy when the price breaks down the deviation of the linear regression calculated on the basis of the last lows prices and allows you to generate alerts.
It also includes an emergency exit at Break Even (1.5%) when it detects a negative trend in the short term.
It also has an advanced trend filter to avoid opening trades against the market.
*************************************
Regresión lineal + Take Profit y Stop loss porcentual
Optimice los parámetros en backtesting para encontrar las mejores entradas, defina su estrategia de profit y riesgo, apreveche las estadísticas y haga operaciones son dejar que el factor psicológico le haga cometer errores.
La estrategia elige el momento de compra cuando el precio rompe hacia abajo la desviación de la regresión lineal calculada en base a lows últimos precios y permite generar alertas.
También incluye una salida de emergencia en Break Even (1.5%) cuando detecta una tendencia negativa en el corto plazo.
Tiene también un filtro avanzado de tendencia para no abrir operaciones en contra del mercado.
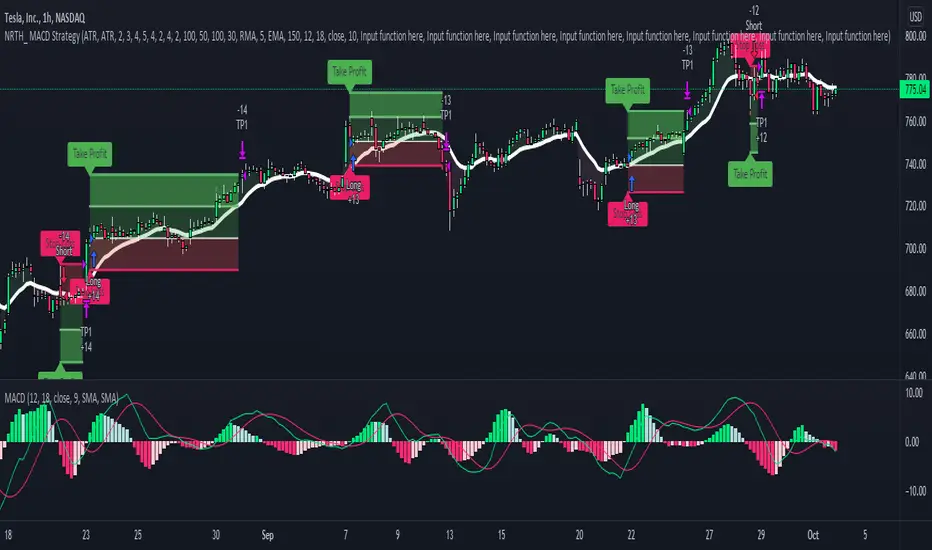
MACD StrategyNRTH_ MACD strategy, packed with alerts, visual backtesting, and ready for automation.
Comes included with the Premium Package.
Indicator features
Built-In Alerts
Visual Risk Management
Customizable Entry Rules
Usage Tips
Works on any timeframe, tweak period lengths accordingly.
Recommended for use on higher timeframes, with the MA Filter
Simple, and customizable MACD strategy, trade with a defined exit strategy and entry parameters.
Works for all markets with the ability to customize to your liking.
Backtesting Results Info
Period 1/1/2021-1/10/2021
Entry value at $1000 with 10x leverage
ATR Exits : 1:2 RR
-------------------------------------------
Disclaimer
Copyright NRTH_ Indicators 2021.
NRTH_ and all affiliated parties are not registered as financial advisors. The products & services NRTH_ offers are for educational purposes only and should not be construed as financial advice. You must be aware of the risks and be willing to bear any level of risk to invest in financial markets. Past performance is not necessarily indicative of future results. NRTH_ and all individuals associated assume no responsibility for your trading results or investments.
All investments involve risk, and the past performance of a security, industry, sector, market, financial product, trading strategy, or individual’s trading does not guarantee future results or returns. Investors are fully responsible for any investment decisions they make. Such decisions should be based solely on an evaluation of their financial circumstances, investment objectives, risk tolerance, and liquidity needs.
Price Change Scalping Strategy v1.0Introduction
This strategy uses a price rate of change (ROC) momentum calculation to determine the percent change in price between a defined range of bars. The calculated ROC value is then compared to the Upper Threshold and Lower Threshold values to determine if a trade setup is to be activated. If the threshold is crossed, a trade setup will occur based on the indicator settings. Entry, Take Profit, and Stop Loss prices are calculated and displayed on the chart. Once the Entry Price is crossed, a long or short position is created (depending on the direction) and once the Take Profit price is crossed, the position is closed. If the Entry Price is not crossed within a specific number of bars, the trade setup is canceled, and it will proceed to monitor price changes for the next set up.
How is it original and useful?
This strategy is unique in that the strategy version fully supports the TradingView backtester, which will enable you to perform experiments with various settings to evaluate performance using the historical chart data. The study version implements numerous custom alerts for you to build TradingView notifications around specific price action events and stay informed with market activity in real-time. Both script versions will provide the same configuration abilities where you can define:
Define a short or long trading strategy.
Price change data source and offset settings.
Your layering placement relative to the entry price.
Your trading parameters like take profit and stop loss offsets, exchange commission rates, trading start time, and order size multiplication for each layer.
Flexible trade eligibility rules that can use other chart indicators, like RSI or EMA, to exclude the selection of entry prices for trading.
The visibility of detailed statistics from the chart history pertaining to trading sessions started and closed, session durations, win rate, price action drops and bounces, as well as layer utilization.
How does it compare to other scripts in the Public Library?
The strategy offers a very detailed, comprehensive settings to address all types of markets found on TradingView where you can implement the price change scalping strategy. The strategy version can be considered the first of its kind on TradingView to leverage the backtester to provide informative, detailed performance measurements surrounding this unique trading strategy. The study version will contain numerous custom alerts to aid in your notification preferences and stay informed on the indicator's activities:
Price Crossed Above Threshold
Price Crossed Below Threshold
Enter Long Position
Exit Long Position
Enter Short Position
Exit Short Position
Price Crossed DCA Layer 1 (Long)
Price Crossed DCA Layer 2 (Long)
Price Crossed DCA Layer 3 (Long)
Price Crossed DCA Layer 4 (Long)
Price Crossed DCA Layer 5 (Long)
Price Crossed DCA Layer 6 (Long)
Price Crossed DCA Layer 7 (Long)
Price Crossed DCA Layer 8 (Long)
Price Crossed DCA Layer 1 (Short)
Price Crossed DCA Layer 2 (Short)
Price Crossed DCA Layer 3 (Short)
Price Crossed DCA Layer 4 (Short)
Price Crossed DCA Layer 5 (Short)
Price Crossed DCA Layer 6 (Short)
Price Crossed DCA Layer 7 (Short)
Price Crossed DCA Layer 8 (Short)
Strategy Results
The default settings are designed to define a "loose" price change settings to ensure that the indicator will render chart elements when first loaded as well as to allow the backtester to gather order executions and display performance summary. The strategy version is using $10,000 initial capital, a commission rate of 0.1% for both entries and exits, and a 1 tick slippage setting. It is also using 2.74506% of the equity with a Order Size Multiplier of 1.33, using 8 total DCA layers, and a take profit of 2% with no stop loss. All other settings are defaults.
It is recommended that the indicator be "tuned" for your specific market in order to best implement the price change strategy and obtain better desirable results. You do so by scrolling through the chart's history and observing moments when prices tend to move rapidly. Measure the number or bars it typcially takes for the price to change at a specific rate. Using this information, you can adjust the Price Change Settings accordingly to configure the indicator for the chart.
Always keep in mind that past performance may not be indicative of future results. Settings that seem favorable for one market may be found to be disastrous in another. Therefore, do take the time needed to understand how the settings will behave with the given chart symbol.
Enjoy! 😊👍
How to obtain access to the script?
You have two choices:
Use the "Website" link below to obtain access to this indicator, or
Send us a private message (PM) in TradingView itself.

Quickfingers Luc's Base Breaking Strategy v2.5Introduction
The strategy attempts to implement a popular price action strategy by Luc Thomas (a.k.a. Quickfingers Luc) typically referred to as a QFL base-breaking strategy. The strategy revolves around price action movements that reveal “bases”, which are price levels of support that have a significant, rapid price surges called “bounces”. Once a base is revealed, the base price level is used as reference to implement multiple entries below the base using a layering technique of dollar-cost averaging to place multiple limit orders at various price levels below the base price. As price action breaks below the base price, the limit orders will be filled, and the take profit, breakeven and stop loss prices will be recalculated.
How is it original and useful?
This strategy is unique in that the strategy version fully supports the TradingView backtester, which will enable you to perform experiments with various settings to evaluate performance using the historical chart data. The study version implements numerous custom alerts for you to build TradingView notifications around specific price action events and stay informed with market activity in real-time. Both script versions will provide the same configuration abilities where you can define:
Base confirmation settings, including volume analysis.
Your preferred layering strategy of either Dollar-cost averaging (DCA) or grid-like layers along with precise layer placement.
Your trading parameters like take profit and stop loss offsets, exchange commission rates, trading start time, and position size multiplication for each layer.
Flexible trade eligibility rules that can use other chart indicators, like RSI or EMA, to exclude the selection of base prices for trading.
The visibility of detailed statistics from the chart history pertaining to trading sessions started and closed, session durations, win rate, price action drops and bounces, as well as layer utilization.
How does it compare to other scripts in the Public Library?
The strategy offers a very detailed, comprehensive settings to address all types of markets found on TradingView where you can implement the QFL base-breaking strategy. The strategy version can be considered the first of its kind on TradingView to leverage the backtester to provide informative, detailed performance measurements surrounding this unique trading strategy. The study version will contain numerous custom alerts to aid in your notification preferences and stay informed on the indicator's activities:
Base Created
Base Cracked
Base Respected
Any Layer Cracked
Layer 1 Cracked
Layer 2 Cracked
Layer 3 Cracked
Layer 4 Cracked
Layer 5 Cracked
Layer 6 Cracked
Layer 7 Cracked
Layer 8 Cracked
Layer 9 Cracked
Layer 1 Respected
Layer 2 Respected
Layer 3 Respected
Layer 4 Respected
Layer 5 Respected
Layer 6 Respected
Layer 7 Respected
Layer 8 Respected
Take Profit Crossed
Stop Loss Crossed
What does it do and how does it do it?
It is recommended that you start with a chart that is on an hourly timeframe with the "Scale Price Chart Only" chart setting enabled. When applied to the chart for the first time, the default settings will work to render base price levels in orange and 8 DCA layers in blue using a Fibonacci-like sequence for the deviation offset relative to the base price. As you scroll through the chart's history you should see price action crossing the DCA layers, denoted with blue triangles, and a green take-profit line will render with green triangle denoting the crossing. Lastly, when a trade session begins upon the crossing of the first layer, the indicator will continue to identify base price levels, but the color of the price lines will be gray. When the trade session concludes upon the crossing of the take profit line, the indicator will switch the most recent base price line from gray to orange to make it active and eligible for trading.
As price action develops, the indicator will use the "Base Confirmation Settings" to look back by counting the number of bars to the left and right of a pivot low point, measure the price drops and bounces, and volume amounts to validate that they are within the specified values. If so, the indicator will draw an orange triangle beneath the candle bar to denote it as the pivot low point and begin rendering the orange line as the base price. The DCA layers will be calculated and offset relative to the base price using thin blue lines.
Optionally, the breakeven price line will be drawn to help visualize the true breakeven price which takes into consideration the exchange fees being applied. Base line, take profit, stop loss and DCA layer crossings will be denoted with colorful shapes to help visually recognize the events on the chart.
The volume is validated only at the pivot low candle. It will measure the volume against the moving average to determine base confirmation. A volume factor of 1 will mean that the volume must be at least the same value as the moving average value. A volume factor of 2 means it must be twice the moving average value.
Lastly, the very last bar will render a table of statistics that summarize all the events that have taken place since the indicator began simulating trading sessions from the chart's history.
Strategy Results
The default settings are designed to define a "weak" QFL base to ensure that the indicator will render chart elements when first loaded as well as to allow the backtester to gather order executions and display performance summary. The strategy version is using $10,000 initial capital, a commission rate of 0.1% for both entries and exits, and a 1 tick slippage setting. It is also using 3.4887% of the equity with a Position Size Multiplier of 1.35, using 8 total DCA layers, and a take profit of 5% with no stop loss. All other settings are defaults.
It is recommended that the indicator be "tuned" for your specific market in order to best implement the QFL trading strategy and obtain better desirable results. You do so by using the statistics table and observe the Mean Price Drop and Bounce values to learn what the indicator is detecting when it measures from the pivot low points. Using this information, you can adjust the Base Confirmation Settings accordingly, along with any volume specifications you require, to configure the indicator for the chart.
Always keep in mind that past performance may not be indicative of future results. Settings that seem favorable for one market may be found to be disastrous in another. Therefore, do take the time needed to understand how the settings will behave with the given chart symbol.
Enjoy! 😊👍
How to obtain access to the script?
You have two choices:
Use the "Website" link below to obtain access to this indicator, or
Send us a private message (PM) in TradingView itself.

SMA-Extendido-Estrategia por NeilDescription:
Strategy that identifies entry and exit operations, using 3 moving averages and 5 strategies. New strategies are implemented such as the prediction of closing operations, independent of the events that justify entry operations.
How does it work:
1) Long strategy: if SMA5 crosses up to SMA200 and SMA200 is bullish, a buy operation begins, if SMA5 crosses down to SMA200 and SMA200 is bearish, a sale begins.
2) Short strategy with smooth filtering of operations: if SMA5 crosses up to SMA20 and SMA20 is bullish and (SMA5 are above SMA200) a buy operation is initiated. If SMA5 crosses down to SMA20 and SMA20 is bearish and (SMA5 are below SMA200) a sell trade is initiated
3) Short strategy with strong filtering of operations: if SMA5 crosses up to SMA20 and SMA20 is bullish and (SMA5 and SMA20 are above SMA200 and SMA200 is bullish) a buy is initiated, in other words, buy operations occur only if SMA5 and SMA20 are above SMA200; if SMA5 crosses down to SMA20 and SMA20 is bearish and (SMA5 and SMA20 are below SMA200 and SMA200 is bearish) a sell is initiated, that is, sell operations occur only if SMA5 and SMA20 are below SMA200
4) Short strategy without filtering operations: if SMA5 crosses up to SMA20 and SMA20 is bullish, a buy is initiated (the location of MA200 does not matter). If SMA5 crosses down to SMA20 and SMA20 is bearish, a sell is initiated (it does not matter where the MA200 is located)
5) Prediction of closing operations: the algorithm evaluates potential closing operations differently and considers the following rules: If there is an active buy trade and SMA5 crosses down to SMA20, we close the current buy (the location of the SMA200 does not matter). If there is an active sell trade and SMA5 crosses up to SMA20, we close the sale in progress (the location of the SMA200 does not matter)
How to use it:
Press the "Indicators" option, go to the "Public Librarian" segment, write the name "SMA-Extendido-Estrategia por Neil", double-click on the record in question and you will have it added in your work panel, now, just It remains to be used to identify the inputs and outputs and you can do it visually or by defining the automatic notification alerts.

EMA StrategyThis is a simple EMA cross strategy. This script was published by CaptJava. I added in the ability to check off a box and allow shorting, the ability to select a back testing date range and also the ability to enter the buy message and sell message in the properties. You then create the webhook alert and put only this in the message:
{{strategy.order.alert_message}}
That will pull in your alert message dynamically.
I may add more features to this over time.

RSI Strategy w/ Trailing SL / TP Optimized for Crypto [Strategy]This strategy is designed to use the RSI and EMA filters. A 200 period EMA is used for short / long filters, and the 50 period EMA is used to determine the direction of the short term trend.
In addition, the script uses "rate of change" for the fast EMA (trend), volume , RSI (momentum), and price (volatility) and only takes trades when all are in optimal conditions.
I.E., the EMA is in an uptrend, the volume is increasing, price is in an uptrend, and the RSI is in an uptrend, so we will place a Long trade.
This strategy uses EMAs as a trailing stop loss and take profit. As this is a trend following strategy, the idea is to maximize profits when correct and minimize losses when
wrong.
It was designed specifically using crypto pairs, and was optimized for the 10 minute chart.
My goal was to get the best use out of the RSI indicator. I was originally an MACD fanboy, but have recently converted.
Want to help me improve this code or strategy? Have suggestions for improvement? Leave them in the comments below.
Thanks for using my script! I hope it works well for you and good luck in the markets.
If you have any questions, please leave them in the comments and I'll do my best to respond.
This script does not repaint as it only relies on close data to make a decision to enter a trade.
How to use this strategy:
___________________________
Enable Long Entries? - Used to enable or disable the strategy from executing long entries.
Enable Short Entries? - Used to enable or disable the strategy from executing short entries.
How Many Bars To Look Back for Hi/Lo: - This is used for the Stop Loss and Take Profit targets. An integer of bars is used to look back and calculate the values.
RSI Length (Rec: 8) - The length of the RSI
Source - The RSI Source
Use Slow EMA? - If checked, a 200 period EMA will be used to filter entries long or short (only take shorts when the price is below, long when above). In addition, the script will close any trades that cross the 200 period EMA. By default this is disabled.
EMA Slow - the period of the Slow EMA (200 by default)
EMA Slow Src - what to use to calculate the Slow EMA (high by default)
EMA Fast - The Fast EMA (50 period) is used to calculate the direction of the short term trend. This also factored into the Rates of Change.
EMA Fast Src - what to use to calculate the Fast EMA
ATR Length - If used, the ATR length is used to calculate the Stop Loss and Take Profit targets.
SL Multiplier - The distance away from the initial value to multiply the Stop Loss
TP Multiplier - The distance away from the initial value to multiply the Take Profit.
Use EMA as SL / TP? - If true (default) a 3 period EMA is used to calculate Stop Loss and Take Profit targets. Else, an ATR is used to calculate these values.
Stop Loss / Take Profit Offset - Default: 3 - this is used to shift the EMA / ATR Stop Loss and Take Profit lines to the right X bars. This is to ensure that they are hit properly and not exceeded.
Short Len Vol - Use to calculate the volume of the short length, used in rate of change calculations
Long Len - Use to calculate the volume of the long length, used in rate of change calculations
RSI Long Entry Val - Minimum RSI crossover value to enter a trade Long. If the RSI is below this value, trade entries are not valid.
RSI Long Cutoff Threshold - Long entry RSI value cutoff to no longer enter trades. If the RSI is above this value, trades entries are not valid.
RSI Short Entry Val - Minimum RSI crossover value to enter a trade Short. If the RSI is above this value, trade entries are not valid.
RSI Short Cutoff Threshold - Short entry RSI value cutoff to no longer enter trades. If the RSI is below this value, trades entries are not valid.
ROC Fast EMA - Calculates the rate of change between the Fast Ema now and 'X' bars ago. \n\n For a long entry, a positive value is needed, and for a short entry, a negative value is needed.
ROC Price - Calculates the rate of change between the most recent price close and 'X' bars ago. \n\n For a long entry, a positive value is needed, and for a short entry, a negative value is needed.
ROC RSI - Calculates the rate of change between the RSI now and 'X' bars ago. \n\n For a long entry, a positive value is needed, and for a short entry, a negative value is needed.
Use Close for SL - Default = Off - If checked, when a candle hits the stop loss, the trade will close on the next candle. If unchecked, the trade will remain open until the candle closes at or beyond the stop loss lines.
Custom Message Boxes - Primarily used for bots, but can be used to also insert your own messages for your trading alerts.

SeaSide420 StrategyThis Strategy by SeaSide420 uses IchiMoku, Engulfing candles and 3 moving averages to find entry to buy and sell orders. It will hold buys and sells at the same time, it will close orders by StopLoss, or Trailing StopLoss or Target Profit. In the example chart here, only the trailing stop is active. It does have commission already included in this result. The initial test equity is set to 1 (1 BTC) so if you use this on say, a FOREX pair, you might want to check your settings, for example, set the initial equity to 100,000 USD as it normally is. I set this to 1 BTC to show that Holding 1 BTC for 2 years would not be as profitable as trading 1 BTC with this strategy for 2 years. The commission level is the same as Binance (0.1%), and the example pair is a Binance instrument, where Bitcoin trades can be in and out this way (CFD). Here it is shown on Daily chart, and with other timeframes/pairs, you may need to adjust the settings (MA period etc). New settings are achieved by you testing them yourself. This is published as an experimental script for use through API to do Automated trading on crypto exchanges. Questions welcome. Strategy free to use, Script private (PM me about it) I have not tested the alerts, but i did include alerts when open and close orders. Let me know if it works or not.

Crypto Strategy for Bearish Markets (Binance, FTX, Futures...)BINANCE:BTCUSDTPERP
Even in months like May '21 you can win by going long on Bitcoin. This strategy proves it and is not overwhelmed by Elon's ...
The backtest was carried out during the month of May of this year and, as you can see, all the long operations opened during the fall were successful.
So if we are going to continue to have a bear market for some time, why not take advantage of it while we remain bulls?
This strategy uses Dollar-Cost-Average (DCA) to average the entry price. Thanks to this, it is able to close profitable trades even in times of great volatility and bearish pressure.
It includes alerts that can be configured that will be sent every time the conditions to operate are met. These alerts can also be linked with 3commas for a fully automatic operation.
For Leverage Futures or Margin traders, all you have to do is divide the initial capital by the leverage used.
Enjoy!

Bot go_up strategyHello. This strategy is based on go_up alerts.
Our task is to find the local minimum. The trade is entered on the basis of RSI and SMA according to a specific formula, which is embedded in the code. When the RSI crosses the SMA upside down, a long position is entered. You can change the length of the RSI . The longer the length, the less frequent, but more accurate the entrance, and vice versa. You can use a different time frame.
The settings have:
1) RSI length, the lower the length, the more often the entry.
2) Testing results for any period of time
3) Take profit for any percentage
4) Stop order for any percentage
5) If there is a check mark ✅, then purchases will always be made, and if not, then purchases will be made, BUT, if the next payback is lower than the previous one, it does not matter by what percentage.
6) If there is a check mark ✅, then each trace of the purchase will be made provided that it is lower by the percentage specified, even if the conditions of the purchase are triggered.
7) The filled area is made for visual display of consolidation zones
Default settings:
RSI length 15, step 1.5, take profit 15, stop order 30.
Also in the settings there is a pyramid of the order, keep this in mind. Enter a deal for a small part of the deposit, and not for all the money at once! You can remove pyramiding and see the results with one entry.
For a more visual understanding, overlay the go_up script.
You can choose a strategy for yourself based on history! If you need examples of strategies, then write to me, my contacts are in the column: instructions from the author.
Successful trades, dear friends, I am glad that you trust me!

PSAR-Risk Strategy Analysis ToolThis is the strategy version of my PRS indicator, information of how it works and parameters explanation is located there. This generates performance chart and an exportable trading log, but it's incapable of sending alerts (the reason of the fork). Use this tool for backtesting information and the original PRS to generate the alerts, once the optimal input values have been found with this tool.

Heikin Ashi+RSI+EMA Strategy 2.0 v4 [Cryptocurrency] by GodtrixHi,
I know a lot of people are looking for a more sophisticated and customizable strategy tool, I'm facing the same problem too, so I created one for myself and decided to share it for free trials and if you think this tool do what you wanted, you can contact me for the subscription "Premium" version.
I'll keep it simple with point forms, if you have any further inquiries or questions, please feel free to message me. Thank you.
Best profit plan with this strategy is you trade on Future leverage while you hold on to your coin, so that when price goes up, your coin value goes up, and at the same time, you trade with your leverage to earn even more, easily doubling up your total profit.
Benefits:
Fully customizable and you can easily personalized it and FINE TUNE it according to the market or coin you trading on.
The strategy is based on REAL PRACTICAL trading skills, so it works in real-world.
I fixed the "repainting" issue so the backtest it shows you IS ACCURATE when you run for real-time.
We all know one indicator is not going to help you win your trades, so this strategy combines ALL three: EMA for long+short term trend, HA for short term trend, RSI for entry/exit
This strategy is designed for LONG trade (Buy low, Sell high), not for SHORT trade.
This is not day trading, it is more to mid-term trading, where there's only few trades per month
Mainly is coded to work with 3Commas bot auto trading, so you only need to key in your Bot ID & Email Token.
Bot trading NOTE:
You need to replace the Alert Message with this: {{strategy.order.alert_message}}
One Alert will work for both Buy and Sell Order
If you using other Bot service, you can enter Custom Command too, so it works on any bot service.
Lastly,
regarding the setting advice, I would say you try playing with different settings and your objective is to achieve a backtest result that has:
1) Profitable is > 80%
2) Losing trades is nearly 0 or below 25% of your winning trades. Trick is using far stop loss %
3) Net Profit be almost same or more than "Buy & Hold Profit"
If you interested in our subscription version, message me for price.
Best Luck & a million dollar profit to you,
Godtrix BITSTAMP:BTCUSD BINANCE:DOTUSDT
