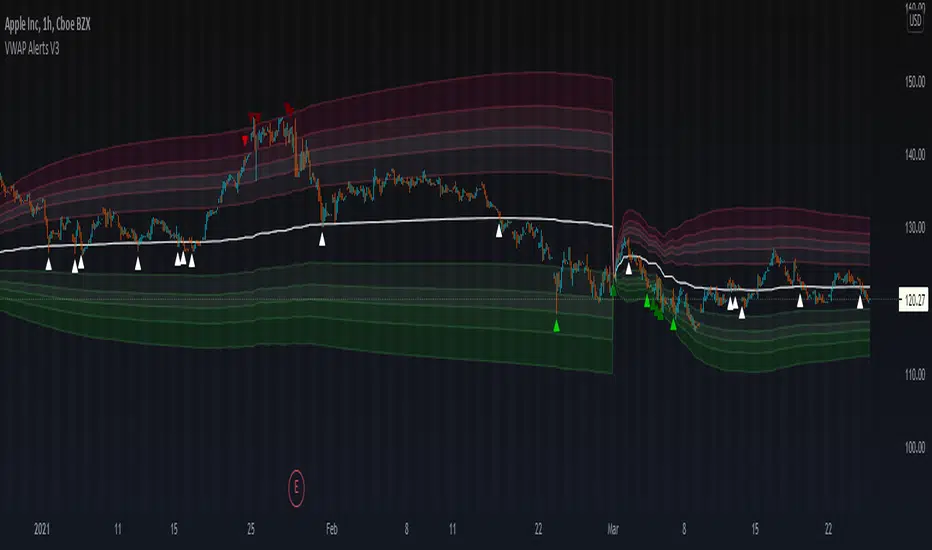
VWAP Alerts V3VWAP Alerts signal over bought/over sold conditions, relative to volume weighted average price, while deviation bands plot an extremely accurate point of mean reversion.
VWAP Alerts V3 includes multiple timeframe selection, along with multiplier input for deviation band setting
Alerts can be set for each individual band, for extreme oversold/overbought conditions, use "Vwap Low Deviation 4" and "Vwap High Deviation 4".
Alerts can also be set for VWAP bounces, by simply setting "VWAP Alert"
Search in scripts for "alert"
Bollinger Bands + RSI Alerts for 3commas/DCA botHey Folks !
This is in indicator that generates buy alerts combining Bollinger Bands and RSI.
RSI validates the BB signal by confirming we are not in an oversold area.
Interval: 3m to 15m
Recommended settings for 3commas DCA bot
- TP/TTP: 0.3%/0.1%,
- Base Order: Your choice ,
- Safety Order: 1.2 * Your choice of base order
- Safety Order Volume Scale: 1.2,
- Safety Order Step Scale: 1.5,
- Price Deviation to Open Safety Order (% from initial order): 0.25%,
- Max Safety Trades Count: 7
- DO NOT USE STOP LOSS
> Create Alert with Buy Alert and link it to "Message for deal start signal"

Ichimoku Basic AlertsStarted with Ichimoku Kinko Hyo by Mizuki32. Converted to study and added alerting and cloud confirmation.
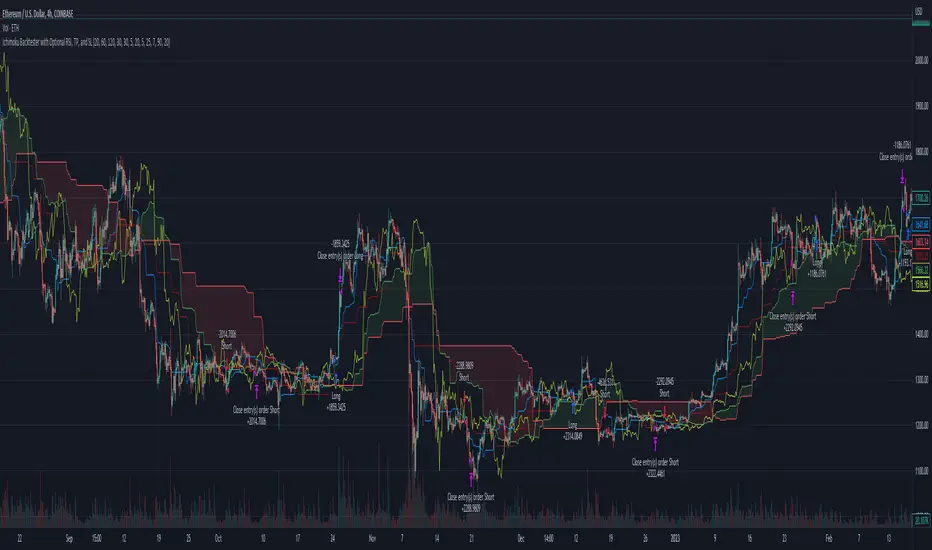
MACD With Trend Filter: Visual Backtest Module TemplateSample Strategy: MACD Crossover with trend filter options
MA Filter : Price Close Above MA, Search for Buy, Price Close Below MA, Search for Sell
ADX Filter : Take trade only when ADX is above certain treshold
MACD Signal : MACD Cross above signal line while under 0 line indicate Buy Signal
MACD Cross below signal line while above 0 line indicate Sell Signal
-----------------------------
Using Alert Module:
Enable Alert --> Enable TV's alert and plot signal to chart
Alert Type --> Set to take Buy only, Sell only or Both alert
----------------------------
Using Backtest Module:
Enable Backtest --> Enable Backtest simulation
Backtest Type --> Set to take Buy only, Sell only or Both
SL Type -->
ATR : Set SL in ATR times Multiplier below/above entry price
Fixed : Set SL in fixed point below entry point (in 'Dollar'). e.g. for Stocks -> 0.5 equals to 50cent while for EURUSD currency -> 0.005 equal to 50 pips
HiLo Bar : Set SL at highest/lowest wick of previous bar plus/minus Fixed point. e.g. EURUSD HiLo=3 and Fixed Point = 0.0005, buy trade will place SL 5 Pips below lowest of previous 3 bar
SL ATR Period --> Set Lookback Period used for SL's ATR calculation
SL ATR Multi --> Set ATR Multiplier for SL
SL Fixed --> Set Fixed Level for SL (Use when SL Type is either Fixed or HiLo Bar)
SL Bar --> Set Number of previous bar to check for SL placement
TP RR Ratio --> Set TP based on RR multiplier. e.g. 2 means TP level will be twice further from entry point compared to Entry-SL distance.
Notes: The point is for preliminary testing, so it only supports 1 trade at a time and no Trailing Stop
----------------------------
Disclaimer:
This script main objective is to create my personal indicator template so that i just have to modify the indicator module for preliminary testing in future.
Testing Alert Module so i can re-use it as template in future study/indicator
Testing Visual Backtest Module so i can re-use it as template in future study/indicator
i believe using Strategy function is a better approach for this but the entry/exit level seems to be hit n miss (at least for me, still trying to figure what i did wrong)
also, i rather code the strategy in other platform where i can use the more accurate tick data if i want to validate backtest statistics.
My study scripts was built only to test/visualize an idea to see its viability and if it can be used to optimize existing strategy.
credit: ADX code are originally from "ADX and DI" by @BeikabuOyaji although i re-wrote so i can have cleaner read and use RMA instead of SMA

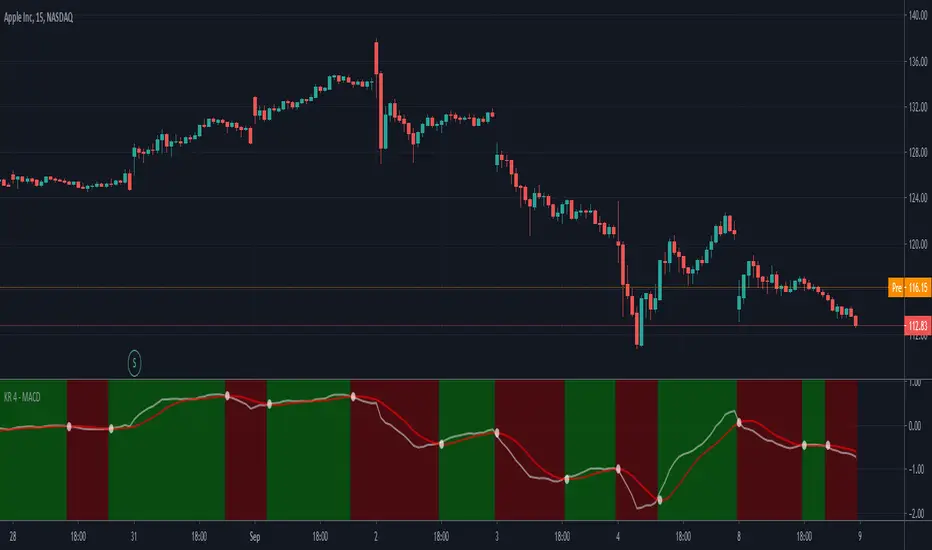
MACD with Buy & Sell alerts by Keiron RichieA redesign of the Moving Average Convergence Divergence (MACD) indicator to include background color changes for easy identification and includes Buy/Sell Alerts.
When the MACD (White line) crosses above the Signal (Red Line) the background changes to GREEN.
Likewise, when the MACD (White line) crosses under the Signal (Red Line) the background changes to RED.
Buy & Sell alerts are included.
MA Pull [VK] - alert version of vkscalperThis is the alert version of vkscalper
you will need to change the settings for different TF also try changing MA types
Ability to choose MA types
Ability to plot stop loss / take profit lines
simply select buy alert or sell alert for alerts

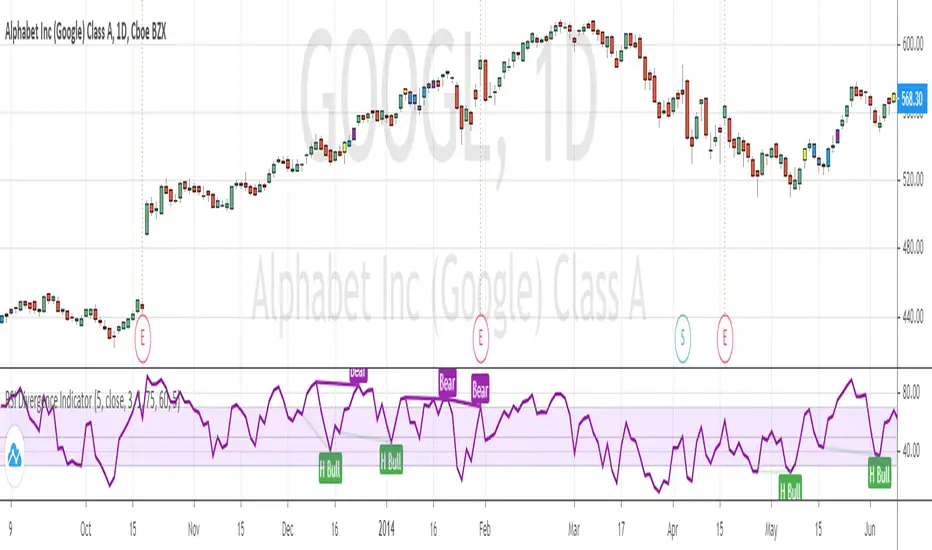
RSI Divergence Indicator (with alerts)Many have requested me for indicator version with alerts for the RSI Divergence strategy. Here is the one ...
Please note alert triggers in delay by number of bars defined in the settings. (same as strategy) ...
Bar color also changes when alert triggers ...
Yellow Bar shows BUY
Purple Bar shows EXIT ( Exit the Long position ... NO SHORTing )
On each Yellow Bar can be added to existing position
On each Purple Bar , exit partial position OR exit the whole position
Appreciate your feedback.
Warning
Use for education purpose only ...
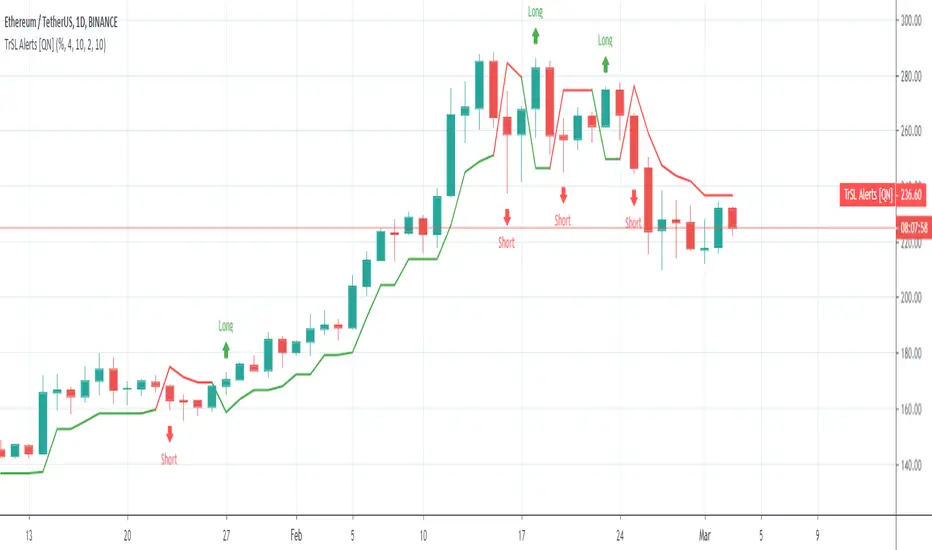
Trailing SL Alerts [QuantNomad]It's alerts version of my Trailing SL strategy:
Use "Once Per Bar" param when creating alerts.
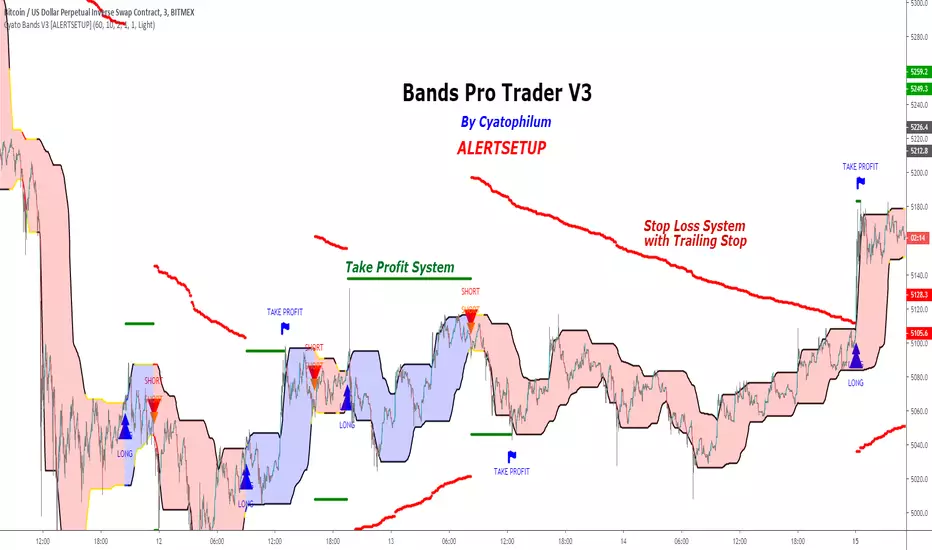
Cyatophilum Bands Pro Trader V3 [ALERTSETUP]An Original Automated Strategy that can be used for Manual or Bot Trading, on any timeframe and market.
>> Presentation <<
This script comes with a Backtest Version
How it works
No, these are NOT Bollinger Bands..
The Cyatophilum Bands are an original formula that I created. You will probably never find it anywhere else.
Their behavior is the following:
When they are horizontal it means the trend is going sideways and they represent supports (lower band) and resistances (upper band).
When they are climbing or falling it means the trend is either bullish or bearish and they represent Trend Lines.
The strategy enters Long on a Bull Breakout and enters Short on a Bear Breakout.
The exits are triggered either on a Trend Reversal, a Stop Loss or a Take Profit.
FEATURES
Take Profit System
Stop Loss System
Show Net profit Line
More features here
Finding a profitable configuration is GUARANTEED
0. Choose your symbol and timeframe. Then add the Backtest version to your chart. If at any time you decide to change your timeframe, go back to step 1.
1. Open the strategy tester and look at the buy & hold line.
If it is mostly climbing (last value greater than 0) then it means we are in a bull market. You should then opt or a long only strategy.
If it is mostly dropping (last value lower than 0) then it means we are in a bear market. You should then opt or a short only strategy.
Note : This first step is really important. Trading against the market has very little chances to succeed.
2. Go into the Strategy Input Parameters:
check "Enable Long Results" and uncheck "Enable Short Results" if you are in a long only strategy.
check "Enable Short Results" and uncheck "Enable Long Results" if you are in a short only strategy.
3. Open the Strategy Tester and open the Strategy Properties.
We are going to find the base parameters for the Bands.
The "Bands Lookback" is the main parameter to configure for any strategy. It corresponds to how strong of a support and resistance the bands will behave. The lower the timeframe, the higher lookback you will need. It can move from 10 to 60. For example 60 is a good value for a 3 minute timeframe. Try different values, and look at the "net profit" value in the Overview tab of the Strategy Tester. Keep the Lookback value that shows the best net profit value.
Then play with the "Bands Smoothing" from 2 to 20 and keep the best net profit value.
The "Band Smoothing" is used to reduce noise.
Usually, the default value (10) is what gives the best results.
From this point you should already be able to have a profitable strategy (net profit>0), but we can improve it using the Stop Loss and the Take Profit feature.
4. To activate the Stop Loss feature, click on the "SECURITY" checkbox
You should see horizontal red lines appear.
A Long/short exit alert will be triggered if the price were to cross this line. (A red Xcross will appear)
Choose the Stop Loss percentage.
On top of that, you can enable the feature "Trailing Stop". It will make the red line follow the price, at a speed that you can configure with the "Trailing Speed" parameter.
Now, sometimes a stop is triggered and it was just a fakeout. You can enable "Re-entries after a stop" to avoid missing additional opportunities.
5. To activate the Take Profit feature, click on the "TAKE PROFIT" checkbox
You should see horizontal green lines appear.
A Long/short exit alert will be triggered if the price were to cross this line. (A flag will appear)
Choose the Take Profit percentage.
A low takeprofit will provide a safer strategy but can reduce potential profits.
A higher takeprofit will increase risk but can provide higher potential profits.
6. Money Management
You can configure the backtest according to your own money management.
Let's say you have 10 000 $ as initial capital and want to trade only 5%, set the Order Size to 5% of Equity.
You can increase net profit by increasing the order size but this is at your own risk.
How to create alerts explained here
Sample Uses Cases
Use it literally anywhere
This indicator can be used on any timeframe and market (not only cryptocurrencies).
About the Backtest below
The Net Profit (Gross profit - Gross loss) is calculated with a commission of 0.05% on each order.
No leverage used. This is a long strategy.
Each trade is made with 10 % of equity from an inital capital of 10 000$. The net profit can be bigger by increasing the % of equity but this a trader's rule to minimise the risk.
I am selling access to all my indicators on my website : blockchainfiesta.com
To get a 2 days free trial, just leave a comment , thanks !
Join my Discord for help, configurations, requests, etc. discord.gg
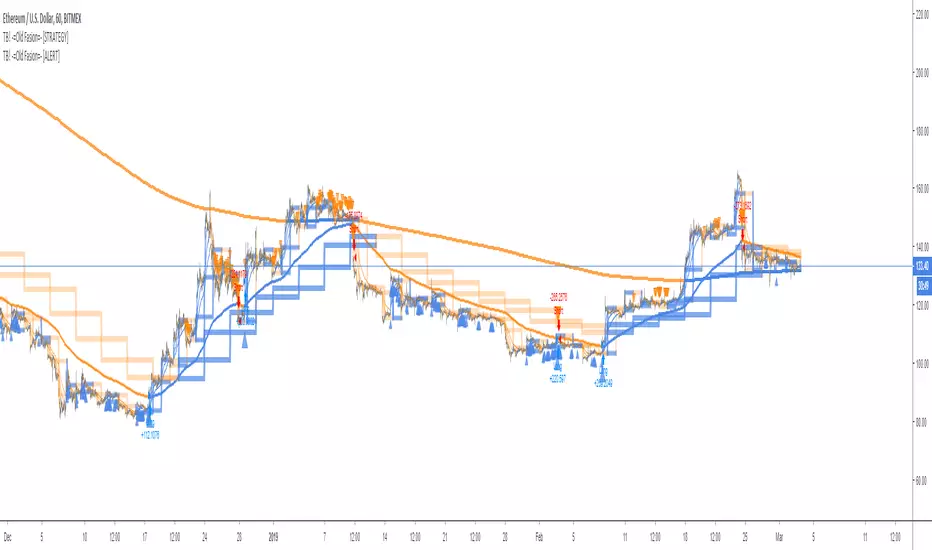
TB! -=Old Fasion=- [ALERT]Good Old Fasion sma/rma trading done as it should be done!
Great for hedging
- Bitfinex
- Poloniex
- Bitmex
- Deribit
No repaint, no false alerts or any other kind of nonsense.
This the Alert version.
You can use it to send alerts to GunBot, Haasbot, Dragonbot, Trexen, Autoview or whatever makes you happy.
ASX300 Golden Cross stock alerts (A2M-ANZ)Golden Cross happens when the SMA50 crossover the SMA200, which usually signals profitable bullish trend and good buy entry. For example, for Aurelia Metals the Golden Cross buy signal had 250% buy and hold profit in about a year.
This indicator hunts for the Golden Cross of the first 20 stocks in the ASX300 (A2M to ANZ), once it it happens the indicator plots the name of the stock that had Golden cross which could be use as entry for that stock. As you can see various stocks were plotted in the chart, those had crossedover at the time of plotting.
Due to TradingView Pinescript limitations, only 20 stocks can be watched in one indicator. Therefore 15 Golden Cross indicators are required to watch the entire ASX300.
This can also be applied to crypto coins with some adjustments in the script, so you can be alerted of the Golden Cross in crypto coins and buy bullish coins.

Waves Market CapHello traders!
This is Market Cap chart of Waves cryptocurrency with some additional features.
What is included
Dynamic market capitalization chart
Customizable SMA of the market capitalization
Crossovers highlighting
Alerts for crossovers
Alert for the specified positive % change
Alert for the specified negative % change
How to get access
Buy for only 20$ to get lifetime access to this indicator
Like and follow for more cool indicators!
Happy Trading!

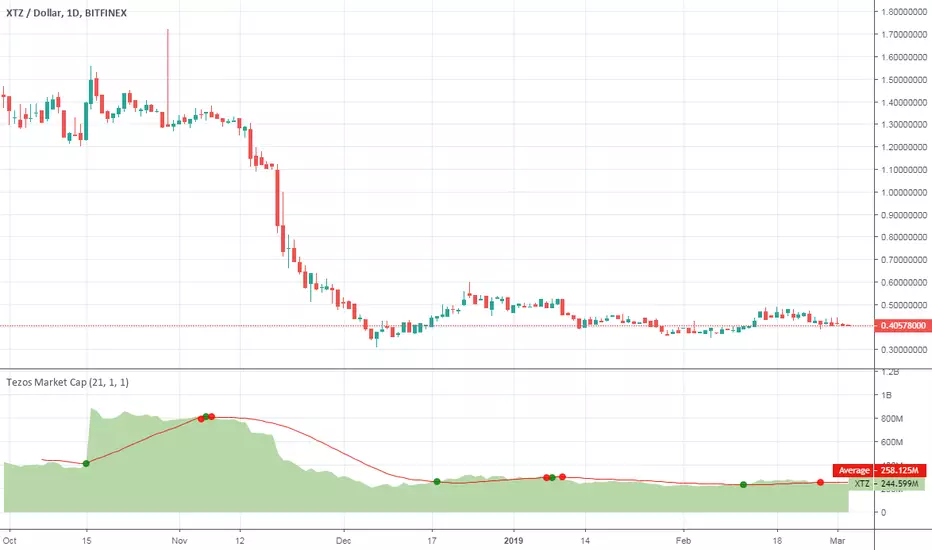
Tezos Market CapHello traders!
This is Market Cap chart of Tezos cryptocurrency with some features.
What is included
Dynamic market capitalization chart
Customizable SMA of the market capitalization
Crossovers highlighting
Alerts for crossovers
Alert for the specified positive % change
Alert for the specified negative % change
How to get access
Buy for only 20$ to get lifetime access to this indicator
Like and follow for more cool indicators!
Happy Trading!
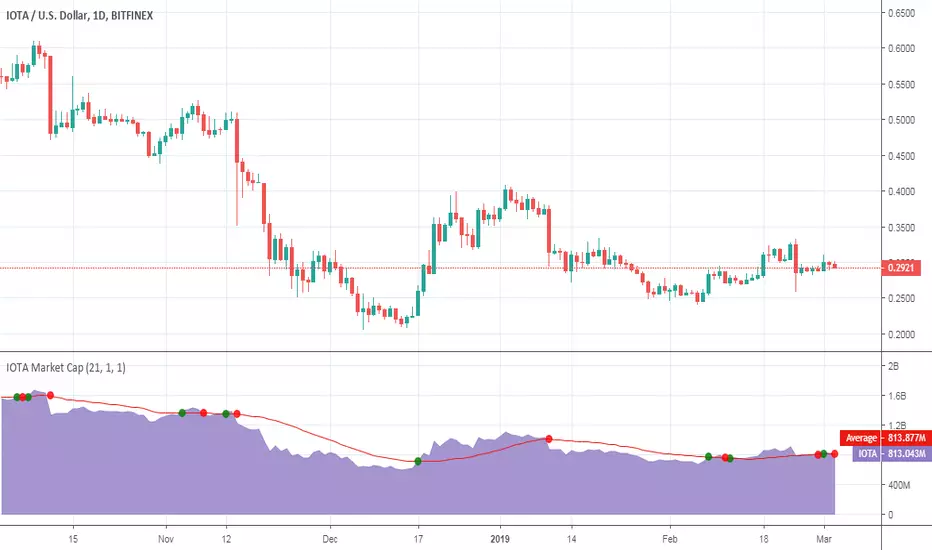
IOTA Market CapHello traders!
This is Market Cap chart of IOTA cryptocurrency with some features.
What is included
Dynamic market capitalization chart
Customizable SMA of the market capitalization
Crossovers highlighting
Alerts for crossovers
Alert for the specified positive % change
Alert for the specified negative % change
How to get access
Buy for only 20$ to get lifetime access to this indicator
Like and follow for more cool indicators!
Happy Trading!
Zcash Market CapHello traders!
This is Market Cap chart of Zcash cryptocurrency with some features.
What is included
Dynamic market capitalization chart
Customizable SMA of the market capitalization
Crossovers highlighting
Alerts for crossovers
Alert for the specified positive % change
Alert for the specified negative % change
How to get access
Buy for only 20$ to get lifetime access to this indicator
Like and follow for more cool indicators!
Happy Trading!

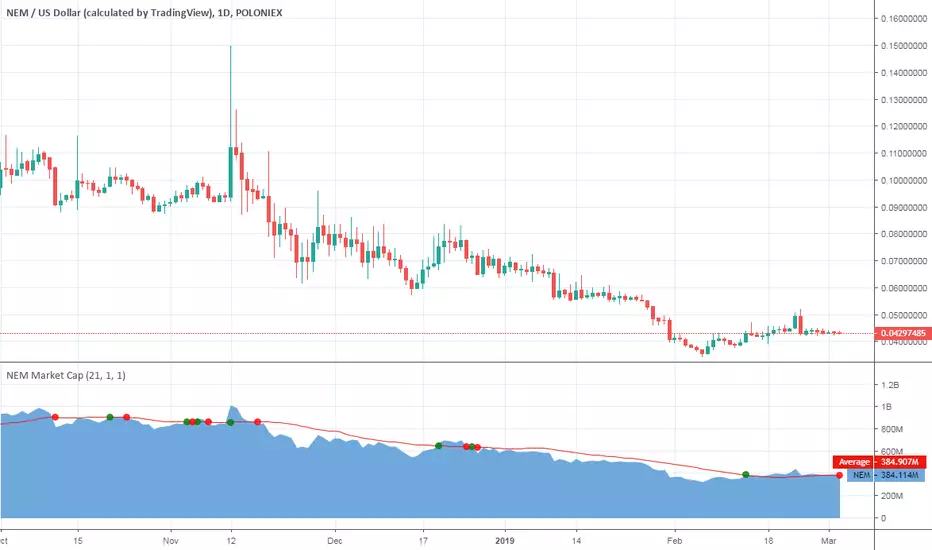
NEM Market CapHello traders!
This is Market Cap chart of NEM cryptocurrency with some features.
What is included
Dynamic market capitalization chart
Customizable SMA of the market capitalization
Crossovers highlighting
Alerts for crossovers
Alert for the specified positive % change
Alert for the specified negative % change
How to get access
Buy for only 20$ to get lifetime access to this indicator
Like and follow for more cool indicators!
Happy Trading!
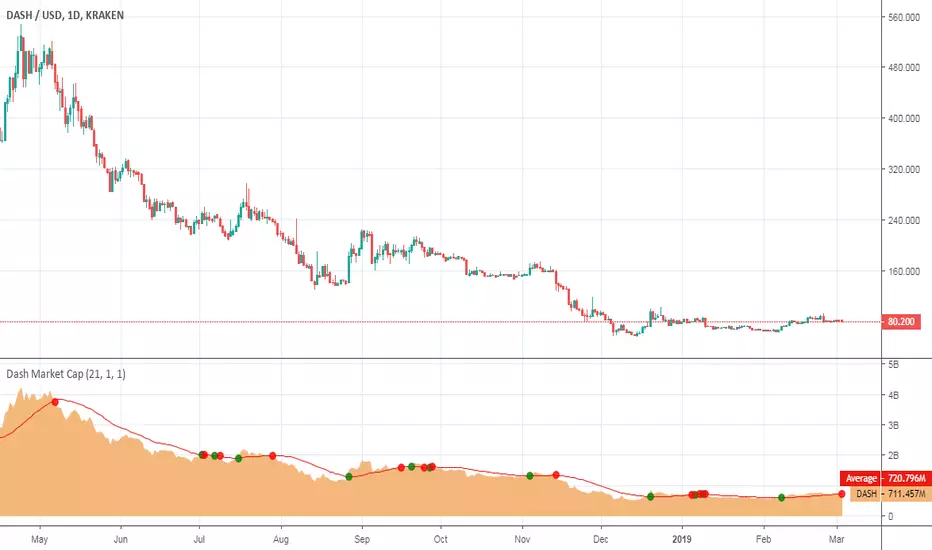
Dash Market CapHello traders!
This is Market Cap chart of Dash cryptocurrency with some features.
What is included
Dynamic market capitalization chart
Customizable SMA of the market capitalization
Crossovers highlighting
Alerts for crossovers
Alert for the specified positive % change
Alert for the specified negative % change
How to get access
Buy for only 20$ to get lifetime access to this indicator
Like and follow for more cool indicators!
Happy Trading!

Volume_Master_420Volume is a key component to moniter for trading; this indicator has volume and many other key indicators built in
The Aqua and Fuchsia bg colors are multi fisher confluence signals. Aqua ==> long bias; Fuchsia ==> short bias
The blue and red bg colors are when certain 'bar shapes' of volume print with confidence scores (usually good bars to add on a trend)
The white circles are when volume is making highs or lows of 52 periods back
The blue dots below are the 'atlas' signal showing when BBands are shrinking in a statistically significant way ==> large moves incoming
The volume itself is based on trend volume accumulation by just uncle L;
I have added alerts for when the tva flips from - to + (long alert) and the opposite + to - (short alert)
GL HF
xoxo
Snoop

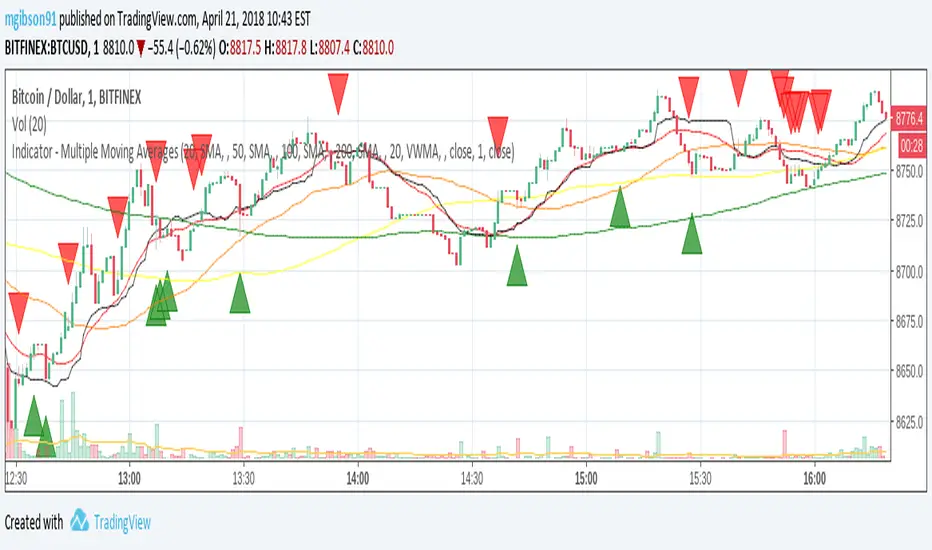
MG - Multiple Moving Averages & Candle Wick Alerts - 1.0Features:
- Each moving average has customizable length, type and source
- The ability to change the source of all moving averages with one input (changing an individual MA source will override the general for that MA)
- At a glance comparison of 20 SMA and 20 VWMA to gauge volume trend
- Wick alerts which can be toggled for each moving average.
- Bullish wick alerts are when the wick is the only part of the candle to drop below the moving average
- Bearish wick alerts are when the wick is the only part of the candle to reach above the moving average
- Simple candle closed alert if you want a notification, for example each hour.
Defaults: Four SMAs (20, 50, 100, 200) and a 20 VWMA .
Recommended Usage:
- Set the general source (sets the source of all moving averages) to 'low' when in an uptrend and 'high' in a downtrend to maximize Risk : Reward.
- Use Fibonacci levels, oscillators .etc for confluence
NOTE: The moving average component of this indicator is the same as the previous indicator ()
Two Bar Break Line Alerts R1.0 by JustUncleLThis indicator with default settings is designed for BINARY OPTIONS trading. The indicator can also be used for Forex trading with some setting changes. The script shows Two Bar Pullback Break lines and alerts when those Break lines are Touched (broken) creating a short term momentum entry condition.
For a Bullish Break (Green Up Arrow) to occur: first must have two (or three) consecutive bear (red) candles which is followed by a bull (green) candle creating a pivot point. The breakout occurs then the High of the current Bull (green) exceeds the highest point of the previous two (or three) pivotal bear candles. The green channel Line shows where the current Bullish BreakOut occurs.
For a Bearish Break (Red Down Arrow) to occur: first must have two (or three) consecutive bull (green) candles which is followed by a bear (red) candle creating a pivot point. The breakout occurs when the Low of the current Bear (red) drops below the lowest point of the previous two (or three) pivotal Bull candles. The red channel Line shows where the current Bearish BreakOut occurs.
The break Line Arrows can optionally be filtered by the Coloured MA (enabled by default), a longer term directional MA (disabled by default) and/or a MACD condition (enabled by default) as a momentum filter.
You can optionally select three Bar break lines instead of two. The three bar break lines are actually equivalent to Guppy's Three Bar Count Back Line method for trade entries (see Guppy's video reference below).
Included in this indicator is an ability to display some basic Binary Option statistics, when enabled (enabled by default) it shows Successful Bars in Yellow and failed Bars in Black and the last Nine numbers on the script title line represent the Binary option Statistics in order:
%ITM rate
Total orders
Successful Orders
Failed Orders
Total candles tested
Candles per Day
Trades per Day
Max Consecutive Wins
Max Consecutive Losses
You can start the Binary Option statistics from a specific Date, which is handy for checking more recent history.
HINTS:
BINARY OPTIONS trading: use 5min, 15m, 1hr or even Daily charts. Trade after the price touches one of the Breakout lines and the Arrow first appears. Wait for the price to come back from Break Line by 1 or 2 pips, the alert arrow must stay on and candle change to black, then take Binary trade expiry End of Candle. If price pull back and arrow turns off, don't trade this candle, move on you probably don't have momentum, there will be plenty of other trigger events. The backtesting results are good with ITM rates 65% to 72% on many currency pairs, commodities and indices. Realtime trading has confirmed the backtesting results and they could even be bettered, provided you are selective on which signals to trade (strong MACD support etc), that you are patient and disciplined to this trading method.
FOREX trading: the default settings should work with scalping. For longer term trades try with settings change to a more standard MACD filter or slower to catch the longer term momentum swings and the idea would be to trade the first Break Line alert that occurs after a decent Pullback in the direction of the trend. Setting the SL to just above/below the Pivot High/Low and set target to two or three times SL.
References:
"Fundamentals of Price Action Trading for Forex, Stocks, Options and Futures" video:
www.youtube.com
Other videos by "basecamptrading" on Naked Trading.
"Taking Profits in Today's Market by Daryl Guppy" video:
www.youtube.com

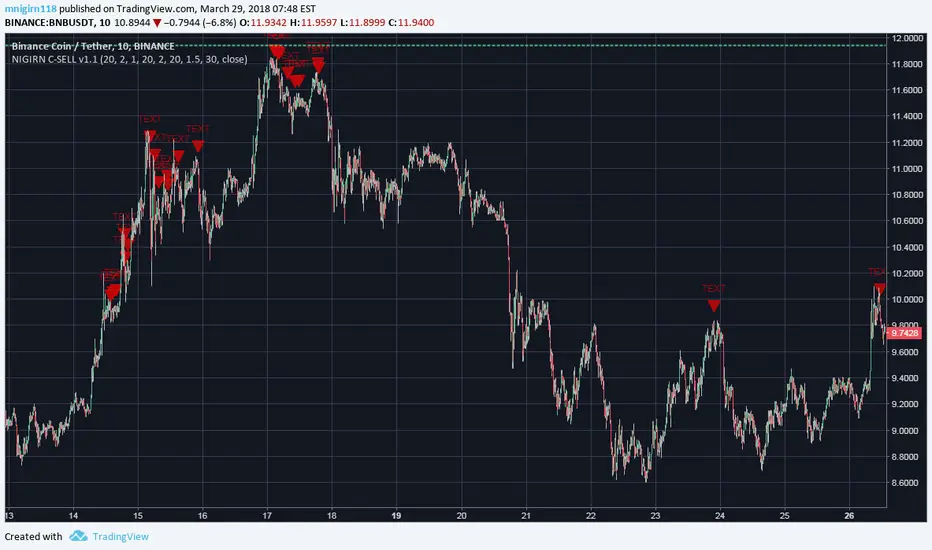
NIGIRN CRYTPO SELL SIGNALER v1.1#####################################
NIGIRN CRYTPO SELL SIGNALER v1.0
-------------------------------------------------
NOTIFIES THE USER VIA AN ALERT 'TEXT' OF POTENTIAL SELL OPPORTUNITIES IN CRYPTOCURRENCY MARKET TYPES. USERS WOULD INDICATE THE ALERTS USING THE CREATE ALERTS FEATURE AVAILABLE IN TRADING VIEW.
INCORPORATES SEVERAL INDICATOR STRATEGIES COMBINED AND ATTEMPTS TO SIGNAL USERS DURING DOWNWARD TRENDS AND AT CLOSING HIGH POINTS. 80% PERCENT SUCCESSFUL AT THIS TIME. USERS WHEN RECEIVING TEXTS ARE ENCOURAGED TO EXAMINE THE CHARTS THEMSELVES TO VERIFY THE SELL. IT IS NOT SUPER TIME SENSITIVE AS IT IS BASED ON LONGER TRENDS & VOLATILITY .
USER MAY CHANGE THE CHART RESOLUTIONS TO FIND THE BEST APPROACH.
DISCLAIMER: TRADING IN CRYPTOCURRENCY IS A RISKY PROPOSITION. HOPEUFLLY THIS WILL HELP BUT, USE AT YOUR OWN RISK.
M. NIGIRN
#####################################
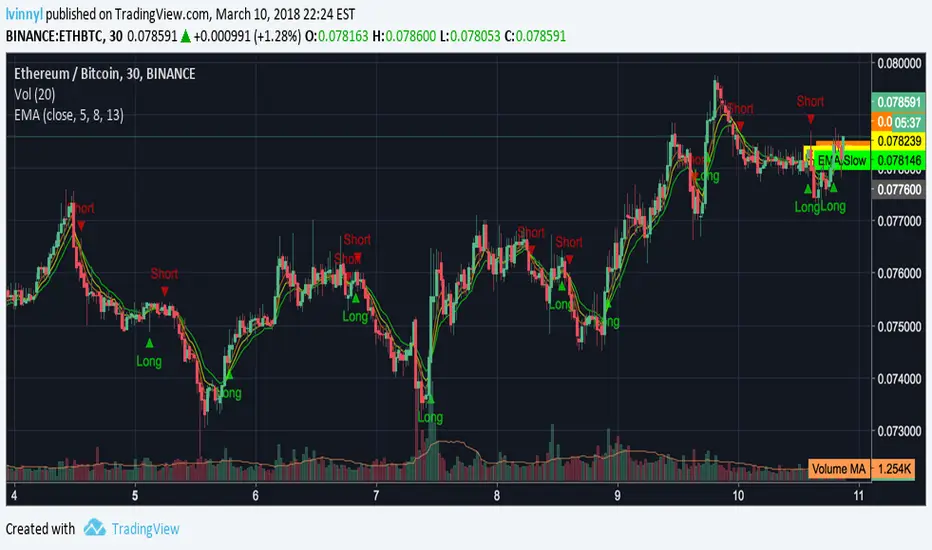
Triple EMA Cross Study with Alerts by lvinnylThis is a pretty simple study that uses three exponential moving averages (fast, normal, and slow) and fires a long alert when the fast EMA is above the normal EMA and the normal EMA is above the slow EMA. The short alert will fire once the inverse is true (slow is above normal and normal is above fast).
The settings allow you to choose your data source and the fast, normal and slow EMAs for your personal customization. The alerts are called "Long Condition" and "Short Condition".
There is also a strategy version that supports custom back test time frames.
Tips are welcomed...
BTC: 3B9vjMxrbdtbmZ3r3iGyq1uxxsnbkKNFzv
LTC: MU3oDbfDGeSxcAZc2VkMz31gKFDHAh5eF7
ETH: 0x6c432B24c4c62c3D2A8C55e6132FF1267A914110
Enjoy!