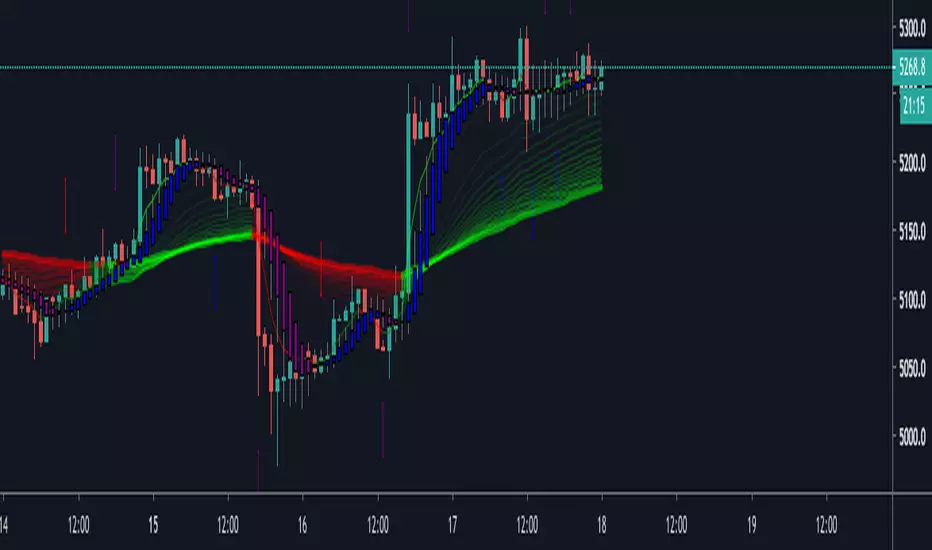
SHA & MMAR Strategy Alert IndicatorIndicator w/ alerts for 'Slow-Heiken Ashi & Madrid Moving Average Strategy'.
High win-percentage with cryptocurrencies on a 1H timechart.
Search in scripts for "alert"
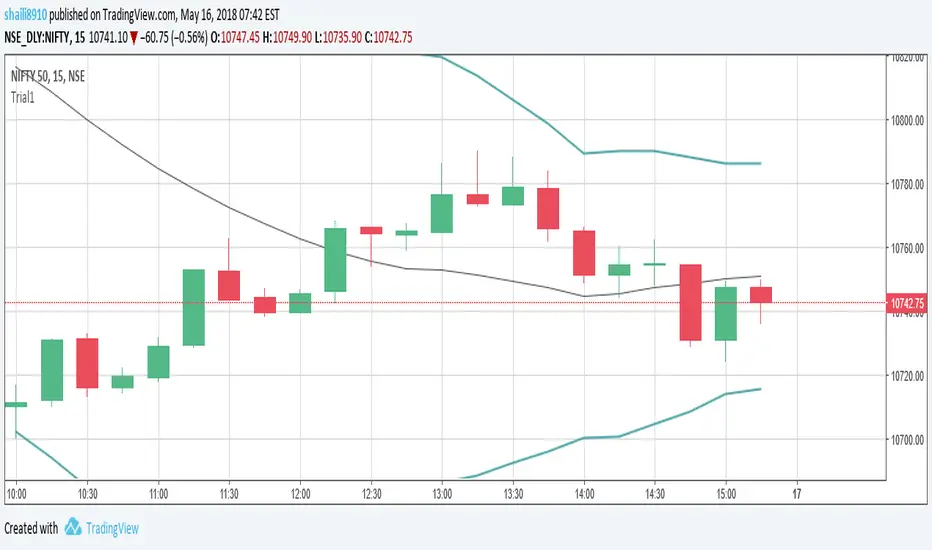
Kozlod - Heikin-Ashi Bar Color Change AlertsYou can use this script to setup alerts on Heikin-Ashi bar color change.
You have to apply this script to usual candles and not Heikin-Ashi!!!
Background color indicates HA bar color. On change you'll see green/red arrows and alert will be fired.
Also you can find in the code calculations of all HA OHLC values.

VWAP AlertsVWAP Alerts for intraday VWAP bounces and VWAP deviation mean reversions. I am currently finalizing the alert section make it more streamlined.
Thanks to @TheYangGuizi for an amazing script

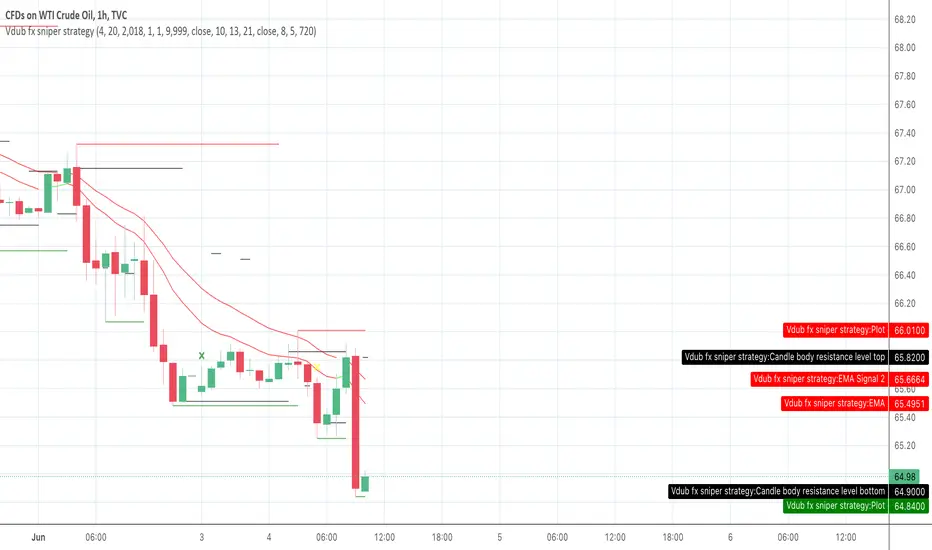
Vdub fx sniper strategy with alertsThis mimics the performance of the strategy created by Vdub FX Sniper, the user should buy when it marks green and sell when it marks yellow, however i can't get to the alert system trigger effectively, any ideas?
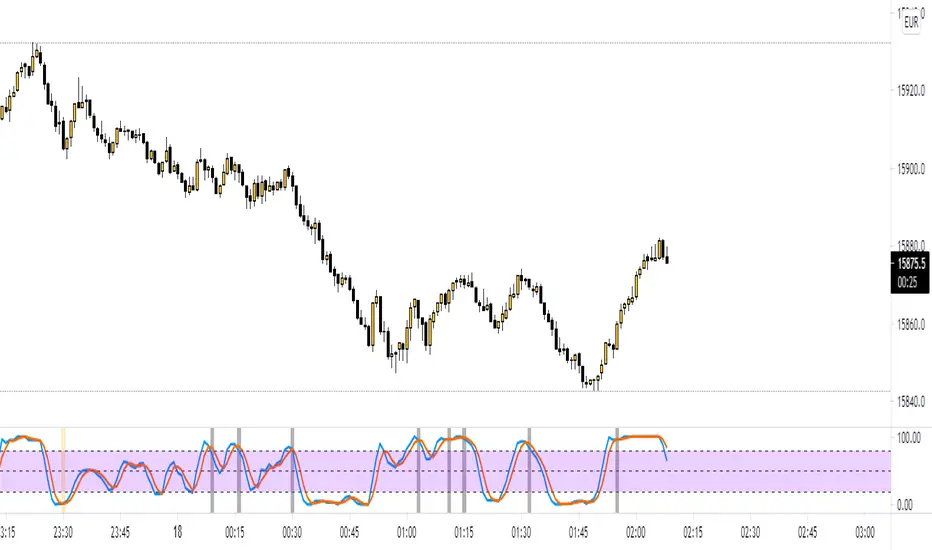
Bollinger Bands %b & RSI & Stochastic Smoothed Indicator & AlertThis indicator displays RSI, a normalized Bollinger Band &b (Usual 0 -1 range of BB normalized to the OBOS range of RSI), and a normalized smoothed Stochastic (again, normalized to the OBOS of RSI) simultaneously with a single indicator.
It also displays buy and sell signals based upon the above.
The stochastic can be turned on and off, and the sell signal calculation will be changed accordingly (Stochastic not used to calculate buy signal).
All periods, OBOS levels, deviation, etc, are user adjustable. The buy and sell arrows can be optionally turned off.
The indicator supports alerts for the buy and sell signals.
This is a considerably rewritten, cleaned up, and updated version of my BB %b & RSI Indicator and Alert with many more features, and including a stochastic.
This indicator is mainly for use with Cryptocurrencies in shorter time periods to display possible trade opportunities. Can also be used with Forex.

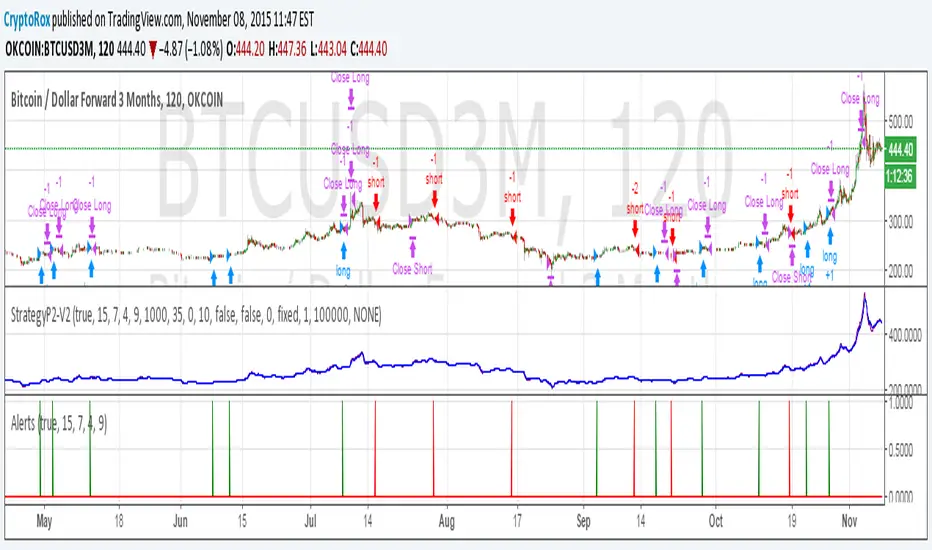
P2-V2 - AlertsThis is the alert script for the P2-V2 Strategy. For some reason pasting it into the P2-V2 description results in some of the lines becoming corrupt. So figured the best way would be to publish it.
original strategy
CM_UCS_MODIFIED SLINGSHOT [ALERTS]Here is a tool to help trigger entry alerts on CM_UCS_Slingshot_Modified.
This alert code picks up the Conservative Entry Signals.

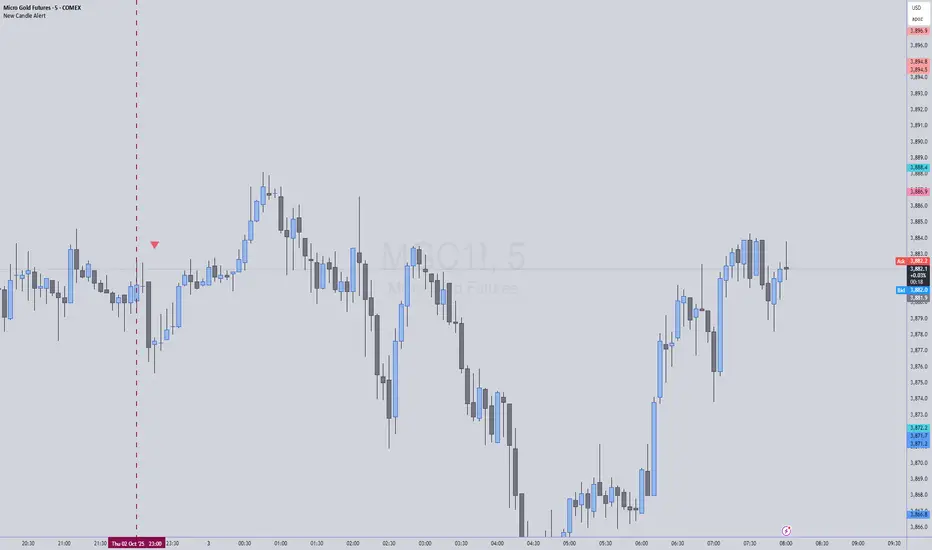
New Candle Alert with Time WindowJust needed a way to specify a time window on a timeframe and get alerts for each new candle
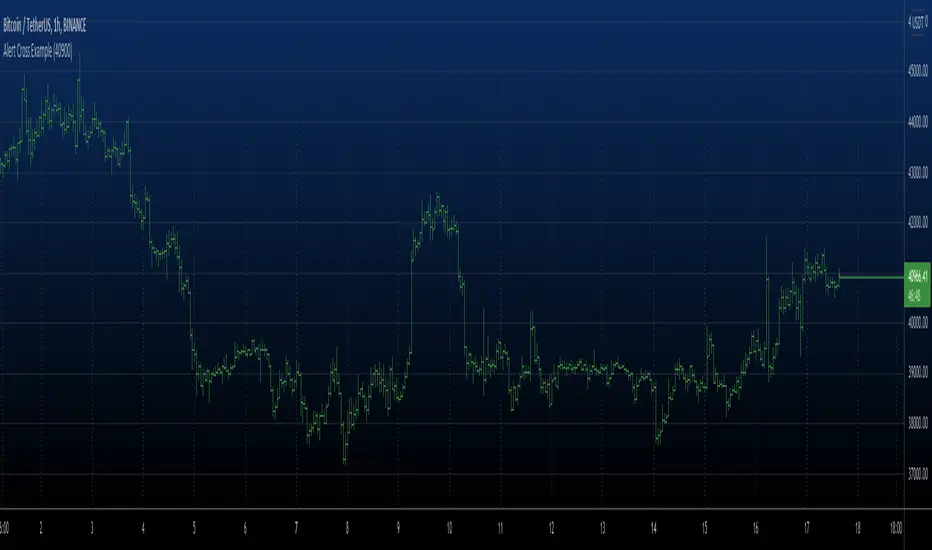
Alert Cross Example Alert example with set level.
Set level price in the input dialog and it will send
cross alerts
Stochastic RSI w/ Crossover Alerts (by WJ)NOTE:
// STOCH RSI CODE TAKEN FROM DEFAULT INDICATOR
// I HAVE ONLY MADE SOME ADJUSTMENTS FOR VISUAL AID
// I MADE THIS FOR MY OWN USE BUT HAVE DECIDED TO PUBLISH AND SHARE IN CASE ANYBODY WANTS TO USE IT
This is the normal default built-in Stochastic RSI indicator which I have added some stuff for visual aid:
Added middle line (50)
Stoch RSI background turns green when K line crosses D line UPWARDS, K line is below the 50 level, and price is above 200 EMA
Stoch RSI background turns red when K line crosses D line DOWNWARDS, K line is above the 50 level, and price is below 200 EMA
Alert notification on the crossover candle with background colour change conditions met
Simple Study for Sean (threshold-triggered alert)This script illustrates how to create simple alerts, triggered by a share price moving above (or below) an arbitrary threshold.

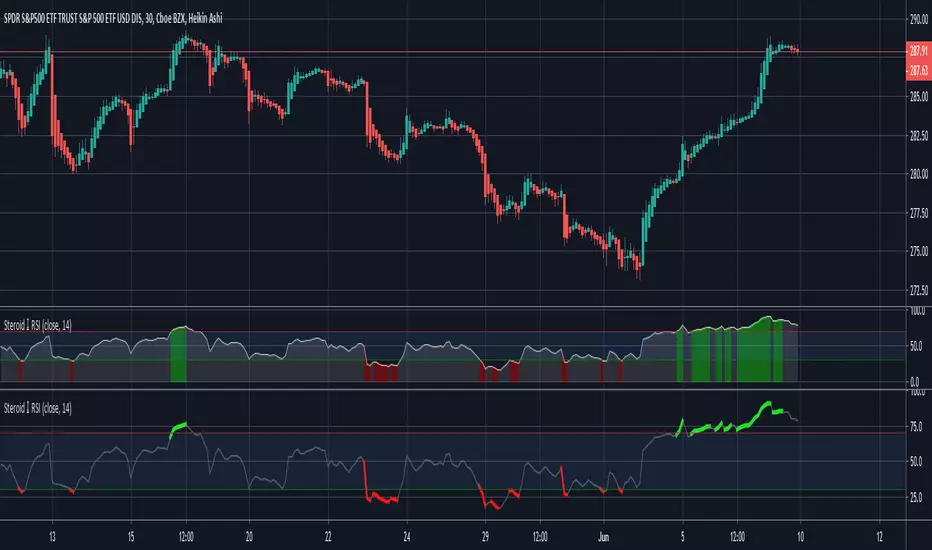
Steroid RSI w/ Overbought & Oversold Alert/@version=2
//By Tantamount
//RSI with overbought and oversold alert features! Highly configurable indicator that includes a Topography map feature, used to detect & easily show threshold crossovers.
//RSI is used to measure the velocity and change of directional price movements. It is very useful to help determine when an asset is reaching an overbought or oversold condition.
//This RSI tool comes loaded with features and is easily configurable back to standard RSI or configure with your own preferences.
Customize to your liking:
Topo map view or standard with highlighted crossover color.
If you like this tool and would like to DONATE/TIP:
Stellar XLM address: GA5XIGA5C7QTPTWXQHY6MCJRMTRZDOSHR6EFIBNDQTCQHG262N4GGKTM
Bitcoin BTC address: 3QwPUnZvAKBXBMU7WMckNgDyfv6PApYduA
Bollinger Band Open Gap Alert V1This is the bare bones of what I'm trying to achieve through pine script. The purpose of the script is to:
1. On a 15m chart, calculate and plot upper & lower Bollinger bands and simple moving average of 20 periods. (DONE)
2. On a new day, when the first 15m candle of a session forms, I want to check if a) the low of the new candle is outside the upper Bollinger band (also known as an open gap up) or b) if the high of the candle is the outside the lower Bollinger band (also known as open gap down). In other words, I want to know if the Bollinger Bands are not touching the new candle's wicks/shadows. (DONE)
3. Alert me if the above happens. (DONE)
4. Run the indicator through an entire watch list. I'm not sure if that's possible, yet. (HELP)
For the above job, this is what I could come up with. I need guidance for the last step . And any suggestions for corrections or improvements would be greatly appreciated!
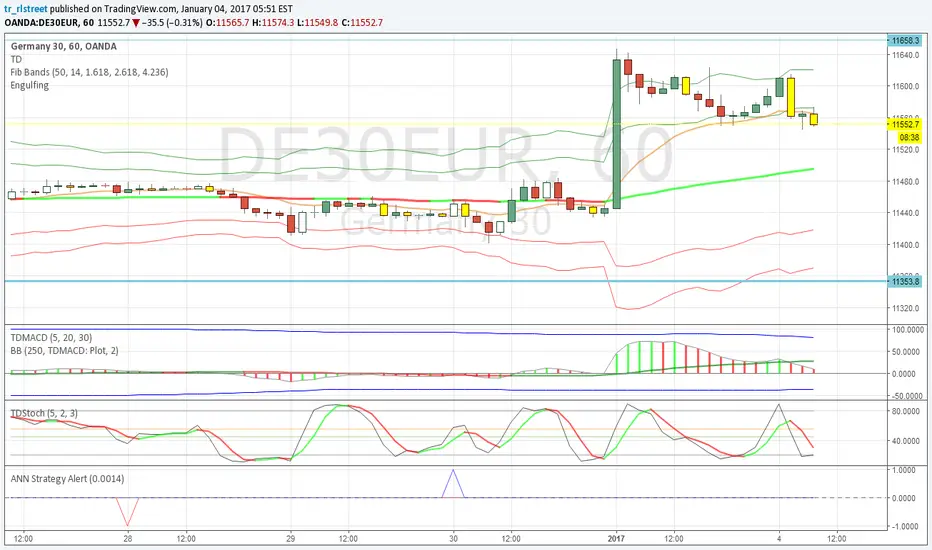
ANN Strategy AlertBased on ANN Strategy by Sirlof2009.
Changed it from strategy to indicator and made appearance less noisy
I use it just for creating alerts (predictionS<0 => Short and predictionL >0 => Long)
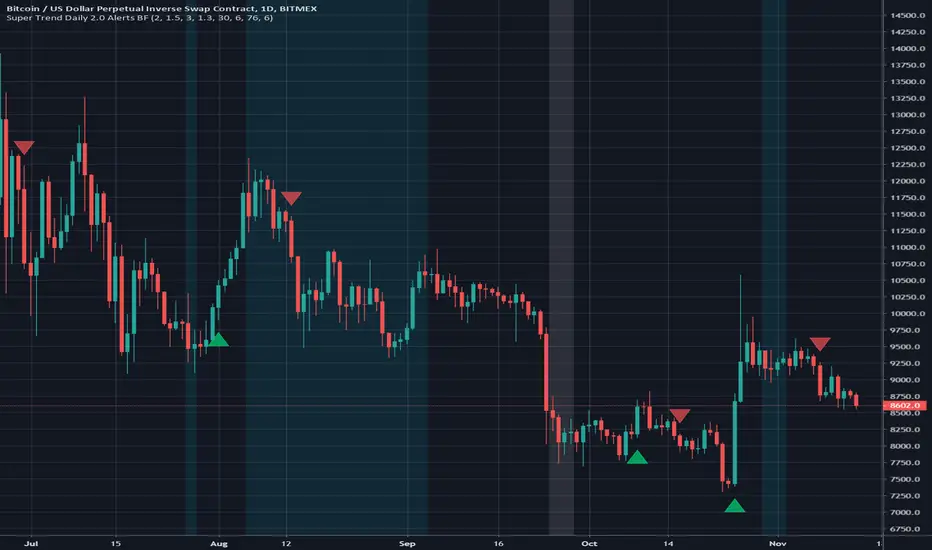
Super Trend Daily 2.0 Alerts BFThis is an alerts script for my Super Trend 2.0 indicator . It is intended as a companion script so you can backtest using the Strategy script and generate alerts using this Study script.
This Study script has the same default settings as the Strategy script and its only purpose is to provide alerts for the long and short signals the Strategy generates. Obviously, if you want to generate alerts based on a Strategy backtest, please ensure the settings are the same in the Study as in the Strategy.
For illustration, I have plotted arrows on the chart for long and short signals, and also colored the background to show when the rate of change function determines a choppy/sideways market.
ALERTS
There are 2 alerts set up:
Long Entry
Short Entry
ILLUSTRATION
Green arrow = Long Entry
Red arrow = Short Entry
White background = No short trades
Aqua background = No long trades
EXAMPLE USE CASE
1. Open a Bitcoin/USD chart on 1D timeframe.
2. Open this script and the Super Trend 2.0 indicator script.
3. Backtest with the Strategy Backtester and change the settings if you like until you get a desirable outcome for your own purposes.
4. Once you are happy with the backtest, change the settings in the Alerts script (this one) so they match the Strategy settings.
5. Set up the alerts according to your preferences.
3 EMA with Alerts 2025This indicator plots three key EMAs (20, 50, and 200) directly on the chart, making it easy to track short-, medium-, and long-term trends. A color-coded table is displayed in the top-right corner for quick reference.
The script also includes smart alerts that trigger only when the state changes:
• 🔵 EMA 20 crossing above EMA 50 & EMA 200 → Bullish signal
• 🔴 EMA 20 crossing below EMA 50 & EMA 200 → Bearish signal
This tool is designed for traders who want clean visuals, reliable alerts, and simplified trend recognition in 2025 markets.

Zay Gwet AlertEMA 9, VWAP and ORB 15 minutes alert in Burmese. When the market across the EMA 9 will give alert to buy or sell. And when the market across the VWAP and ORB 15 will alert as well. Especially for Burmese community as it is in Burmese language.

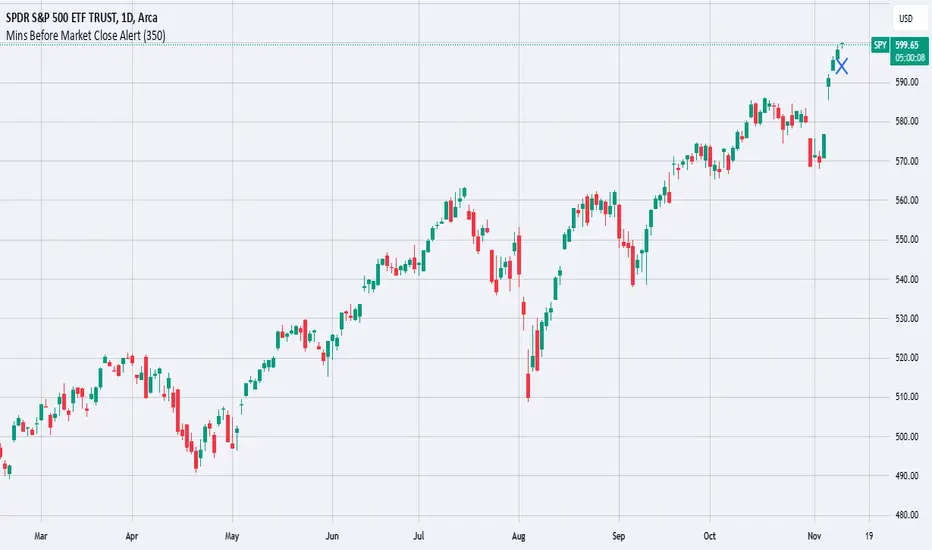
Mins Before Market Close AlertThis script will set an alert X mins before the market closes.
This is meant to be added to daily charts (calculations based off of daily bars).
This script can be useful for sending webhooks before the market closes to close open positions or to open new ones.
Simply add it to your daily chart and set up your desired alert (email, webhook, sound, etc.).
You can also change the chart marker to a different shape, color, or location to your preference.
Enjoy this simple alert!
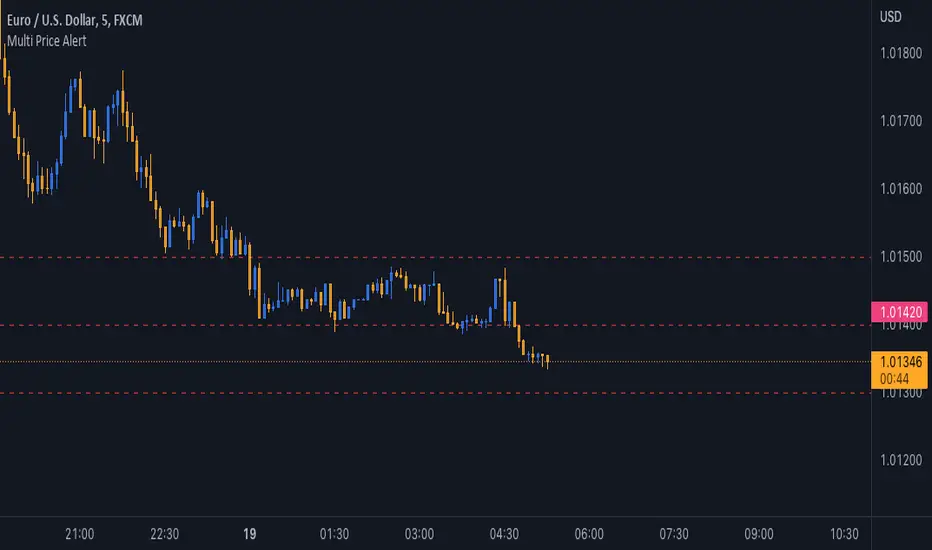
Multi Price AlertSometimes you need set some alert at specific price levels on a chart.
Now you able to set ten different price levels to get alert at this prices.
With this Indicator also Basic Accounts can set more than one alert at price levels.
How to Use :
1- Enable Indicator on your Chart
2- Input your prices on Indicator Settings
3- Active Indicator Alert on 1m Chart (Select Multi Price Alert on Conditions Menu & Once Per Bar on Options)
5- Enjoy !
Notice : If change at prices, you should remove and reset Alert again.
Good trading to all ...
Simple Watchlist with % Change Screener & AlertsHi fellow traders..
TV has generously increased the number of alerts!!
A Simple Watchlist with heatmap based on % change on daily timeframe.
Gives % change and RSI
you can set the percentage in the input box and then set alerts on your favorite watchlist.
Alerts also include days high and low..
Simple Table and array based code.
set for scrip close >10 can be easily changed in line 43..
Hope you Like it!

Hull MA with BB (With Alerts)This is a combination of the standard Bollinger bands with a VWAP(Pink line), and the 'Hull Trend with Kahlman' script by user capissimo, and the NMA (Moving Average 3.0 (3rd Generation)) script by everget.
You can find the original scripts here:
This indicator gives you several confirmations of a good entry and exit positions for Crypto currency like bitcoin and most alt coins. I use this on a 15min, 30min, 1hour, and 4hour chart for best results.
How to use:
Entry Signals:
-A candle closes above the NMA (Yellow Step Line). AND
-You see a Long (text) flag. AND
-The candles are near the bottom of the Bollinger bands and heading upwards.
Exit Signals:
-Candles have passed below and closed below the NMA (Yellow Step Line). AND
-You see a Short (text) flag.
It's important to use these confirmations with other indicators so you have the best entry/exit positions, and make sure you are on normal candles and not HA or any other types.
There are alerts built in that you can setup for the Short and Long text flags that you see. These are generally good alerts to follow. I use the alerts as a reminder to check the charts and see if my other indicators line up for a good trade.

Easy Entry/Exit Trend Colors (With Alerts)This is an updated version of user Algokid's script called 'AK MACD BB INDICATOR V 1.00'. You can find that original script here:
I added many alerts along with the Bullish and Bearish alerts when the MACD crosses over the Upperband or crosses down on the Lowerband.
I personally use this indicator with Crypto charts (Bitcoin on a 15min, 1hour, and 4 hour timeframe) as one of many confirmations that it's a good time to enter a trade. This script was made to be easy to follow with the colors of GREEN triangles being a good uptrend or entry confirmation, and RED being a confirmation to sell/short or exit your trade.
It's important to use this indicator in combination with other indicators that can give you more confirmations to enter or exit a trade, and make sure you are on normal candles and not HA or any other candles as you can get wildly inaccurate results.
This script also has the Death & Golden crosses, which is the slow and fast moving averages crossing over each other. I don't use this as an additional confirmation, it's just nice to know where the cross happens.

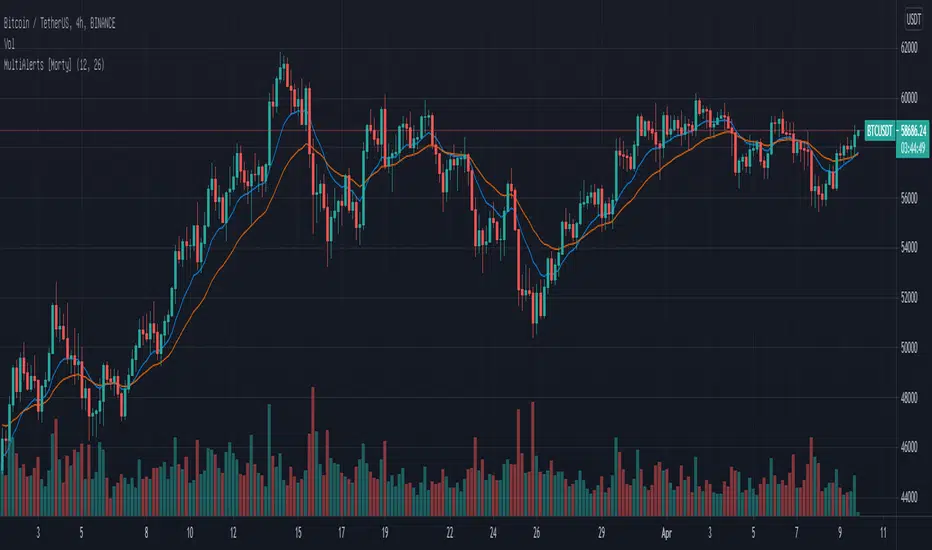
Multiple Alerts by MortyMultiple Alerts by Morty
Version 1.0, Updated at 20210322
When the following signals meet the conditions, alerts will be triggered.
close price cross SMA
SMA_fast cross SMA_slow
MACD cross signal
RSI overbought and oversold
close price cross Bollinger Bands
Momentum cross 0 level
This script will also plot two MAs, EMA default ( SMA optional ).