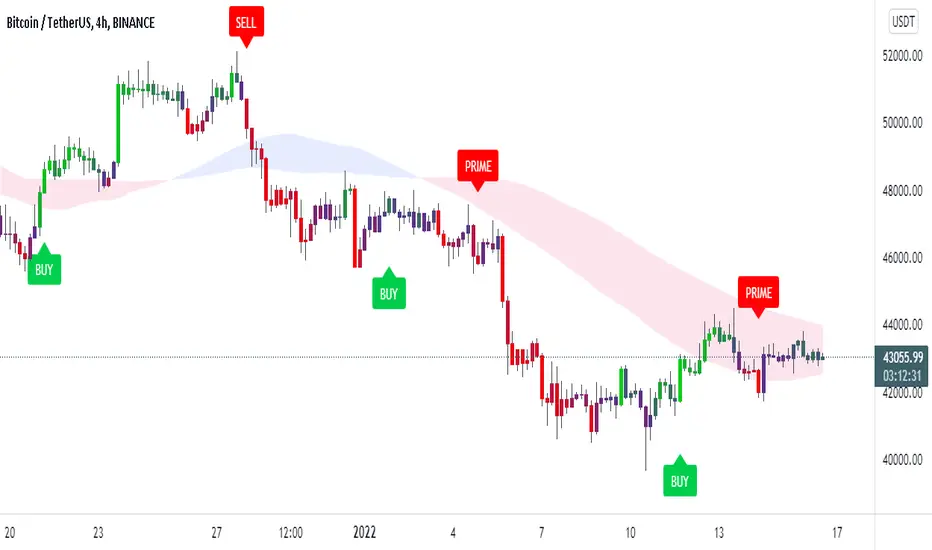
Trendorithm PrimeTrendorithm Prime is a toolkit made up of several different innovative indicators, designed by our team of developers. Get access now and create your own, unique trading strategies using our - all in one algorithm.
Our algorithm works in any market and focuses on finding the direction of the trends and remove noise from the price, for smooth understanding of the market.
Extra Confirmation
Using binomial distribution, the past values are processed to interpret the direction of trend.
After that, the signals are triggered based the volatility of the market,which is derived from the averages of candle size. All of these signals were optimised for each timeframe using timeframe multiplier.
Setting a lesser value on quotient adjusts the lookback length and volatility conditions, thus producing more number of signals that supports scalping trades. Higher the number in quotient, the frequency of trades reduce which helps the trader to hold trades for longer time.
Our Confirmation Signals helps to analyze the direction of trends for all markets and all timeframes, it boosts Trader’s confidence prior taking trades.
We made our Confirmation Signals flexible in order to suit any kind of trading style.
By adjusting the Quotient value in the settings, Traders can control the frequency of signals generated easily.
The Confirmation Signals includes a special type of signal called "Prime" which includes candle coloring to see the strength of the trend.
Our Candle-system is designed in 3 different colorings.
Green ( Bullish )
Red ( Bearish )
Purple (possible reversal or the possible formation of a new trend)
Trendo Cloud
The power of moving averages is always ultimate. This cloud made up of multiple moving averages acts as a dynamic support and resistance. The color and width of the cloud is used to find potential entry and exit points for trades.
Trend Catcher and Trend Chaser
The trend catcher is a trend-following indicator moves close to the price that aims to estimate the recent trend of price. It indicates green in uptrend and red in case of a downtrend.
The trend chaser is similar to the previous Trend Catcher, but it aims to chase long-term trends.
They are specially calculated from the highs and lows of price. Acts as a filter for confirmation signals and provides clarity for the direction of trend.
All of these functionalities tend to help users understand the market conditions as trending or ranging.
If you are using this script, you acknowledge that past performances are not indicative of future results and that there are a lot of factors required that go into being a profitable trader.
You can see the Author’s instructions below to get access to this prime indicator.
Search in scripts for "algo"
Pivot Reversal Strategy + alerts via TradingConnector to indicesSoftware part of algotrading is simpler than you think. TradingView is a great place to do this actually. To present it, I'm publishing each of the default strategies you can find in Pinescript editor's "built-in" list with slight modification - I'm only adding 2 lines of code, which will trigger alerts, ready to be forwarded to your broker via TradingConnector and instantly executed there. Alerts added in this script: 14 and 22.
How it works:
1. TradingView alert fires.
2. TradingConnector catches it and forwards to MetaTrader4/5 you got from your broker.
3. Trade gets executed inside MetaTrader within 1 second of fired alert.
When configuring alert, make sure to select "alert() function calls only" in CreateAlert popup. One alert per ticker is required.
Adding stop-loss, take-profit, trailing-stop, break-even or executing pending orders is also possible. These topics have been covered in other example posts.
This routing works for Forex, indices, stocks, crypto - anything your broker offers via their MetaTrader4 or 5.
Disclaimer: This concept is presented for educational purposes only. Profitable results of trading this strategy are not guaranteed even if the backtest suggests so. By no means this post can be considered a trading advice. You trade at your own risk.
If you are thinking to execute this particular strategy, make sure to find the instrument, settings and timeframe which you like most. You can do this by your own research only.

RSI Strategy with alerts via TradingConnector to ForexSoftware part of algotrading is simpler than you think. TradingView is a great place to do this actually. To present it, I'm publishing each of the default strategies you can find in Pinescript editor's "built-in" list with slight modification - I'm only adding 2 lines of code, which will trigger alerts, ready to be forwarded to your broker via TradingConnector and instantly executed there. Alerts added in this script: 12 and 17.
How it works:
1. TradingView alert fires.
2. TradingConnector catches it and forwards to MetaTrader4/5 you got from your broker.
3. Trade gets executed inside MetaTrader within 1 second of fired alert.
When configuring alert, make sure to select "alert() function calls only" in CreateAlert popup. One alert per ticker is required.
Adding stop-loss, take-profit, trailing-stop, break-even or executing pending orders is also possible. These topics have been covered in other example posts.
This routing works for Forex, indices, stocks, crypto - anything your broker offers via their MetaTrader4 or 5.
Disclaimer: This concept is presented for educational purposes only. Profitable results of trading this strategy are not guaranteed even if the backtest suggests so. By no means this post can be considered a trading advice. You trade at your own risk.
If you are thinking to execute this particular strategy, make sure to find the instrument, settings and timeframe which you like most. You can do this by your own research only.

Pivot Points AlgoThis is a Pivot Points Algo (PPA).
PPA uses an adaptive pivot algorithm that adapts to different market situations based on various factors.
PPA also includes depth filtering to make it more precise at its signal decision.
======= Signal Types ======
Main Signal of BUY and SELL shown by buy/sell labels.
Mini Signals of BUY and SELL shown by buy/sell arrows and shows additional breakouts after the Main Signal occurred.
Optional reversal signals show a possible reversal in trend (small triangle).
======= Alerts =======
Main Signals alerts - Alerts when a main Buy or Sell is triggered (Shown as Labels).
Combo Alerts - Alerts when main or mini signals of Buy and Sell are triggered (Shown as Arrows).
======= Assets and Time frames =======
Can be used on various assets, stocks, forex, crypto and works great for day trading as well as swing trading and long term investing.
PPA is designed to adjust to any time frame!
======= General info =======
The purpose of this indicator is to signal possible breakouts with a high rate of success.
PPA has been extensively tested and fine tuned to provide traders and investors with a valuable tool for timing long and short entries. However, no system is 100% perfect, and it is good practice to have a plan in place and use stop losses or other tools to mitigate unforeseen risk.
Also, note, I don't hide what PPA is doing as opposed to some other commercial indicators on the market. You can view pivot lines and pivot bands and so on.
The magic is the inner system itself which works for you to pinpoint the best entrance possible, I recommend confirming your own methods to make sure you want to take the trade.
To subscribe to Pivot Points Algo service see “Author's instructions” below.
For any question you can PM me.
Happy and profitable trading!

HatiKO Envelopes v3Published source code is subject to the terms of the GNU Affero General Public License v3.0
Old flaws have been resolved.
This script describes and provides backtesting functionality to internal strategy of algorithmic crypto trading software "HatiKO bot".
Suitable for backtesting any Cryptocurrency Pair on any Exchange/Platform, any Timeframe.
Core Mechanics of this strategy are based on theory of price always returning to Moving Average + Envelopes indicator (Moving_average_envelope from Wiki)
Developement of this script and trading software is inspired by:
"Essential Technical Analysis: Tools and Techniques to Spot Market Trends" by Leigh Stevens (published on 12th of April 2002)
"Moving Average Envelopes" by ChartSchool, StockCharts platform (published on 13th of April 2015 or earlier)
"Коля Колеснік" from Crypto Times channel ("Метод сетка", published on 19th of August 2018)
"3 ways to use Moving Average Envelopes" by Rich Fitton, published on Trader's Nest (published on 28st of November 2018 or earlier)
noro's "Robot WhiteBox ShiftMA" strategy v1 script, published on TradingView platform (published on 29th of August 2018)
"Moving Average Envelopes: A Popular Trading Tool" Investopedia article (published 25th of June 2019)
and KROOL1980's blogpost on Argolabs ("Гридерство или Сетка как источник прибыли на форекс", published on 27th of February 2015)
Core Features:
1) Up to 9 Envelopes in each direction (Long/Short)
2) Use any of 6 different basis MAs, optionally use different MAs for Opening and Closure
3) Use different Timeframes for MA calculation, without any repainting and lookahead bias.
4) Fixed order size, not Martingale strategy
5) Close open position earlier by using Deviation parameter
6) PineScript v4 code
7) Anti-Spire (protection against situations like LTCUSD (Bitmex) 12/26/2020)
9) Lottery for each level
10) Total profit for the day. When activated, a histogram is drawn.
Options description:
Lot - % from your initial balance to use for order size calculation
Timeframe Short - Timeframe to use for Short Opening MA calculation, can be chosen from dropdown list, default is Current Graph Timeframe
MA Type Short - Type of MA to use for Short Opening MA calculation, can be chosen from dropdown list, default is SMA
Data Short - Source of Price for Short Opening MA calculation, can be chosen from dropdown list, default is OHLC4
MA Length Short - Period used for Short Opening MA calculation, should be >=1, default is 3
MA offset Short - Offset for MA value used for Short Envelopes calculation, should be >= 0, default is 0
Timeframe Long - Timeframe to use for Long Opening MA calculation, can be chosen from dropdown list, default is Current Graph Timeframe
MA Type Long - Type of MA to use for Long Opening MA calculation, can be chosen from dropdown list, default is SMA
Data Long - Source of Price for Long Opening MA calculation, can be chosen from dropdown list, default is OHLC4
MA Length Long - Period used for Long Opening MA calculation, should be >=1, default is 3
MA offset Long - Offset for MA value used for Long Envelopes calculation, should be >= 0, default is 0
Mode close MA Short - Enable different MA for Short position Closure, default is "false". If false, Closure MA = Opening MA
Timeframe Short Close - Timeframe to use for Short Position Closure MA calculation, can be chosen from dropdown list, default is Current Graph Timeframe
MA Type Close Short - Type of MA to use for Short Position Closure MA calculation, can be chosen from dropdown list, default is SMA
Data Short Close - Source of Price for Short Closure MA calculation, can be chosen from dropdown list, default is OHLC4
MA Length Short Close - Period used for Short Opening MA calculation, should be >=1, default is 3
Short Deviation - % to move from MA value, used to close position above or beyond MA, can be negative, default is 0
MA offset Short Close - Offset for MA value used for Short Position Closure calculation, should be >= 0, default is 0
Mode close MA Long - Enable different MA for Long position Closure, default is "false". If false, Closure MA = Opening MA
Timeframe Long Close - Timeframe to use for Long Position Closure MA calculation, can be chosen from dropdown list, default is Current Graph Timeframe
MA Type Close Long - Type of MA to use for Long Position Closure MA calculation, can be chosen from dropdown list, default is SMA
Data Long Close - Source of Price for Long Closure MA calculation, can be chosen from dropdown list, default is OHLC4
MA Length Long Close - Period used for Long Opening MA calculation, should be >=1, default is 3
Long Deviation - % to move from MA value, used to close position above or beyond MA, can be negative, default is 0
MA offset Long Close - Offset for MA value used for Long Position Closure calculation, should be >= 0, default is 0
Short 1..9 - % from MA value to put Envelopes at, for Shorts numbers should be positive, the higher is number, the higher should be Short n position, example: "Short 1 = 1, Short 2 = 2, etc."
Long 1..9 - % from MA value to put Envelopes at, for Longs numbers should be negative, the lower is number, the lower should be Long n position, example: "Long 1 = -1, Long 2 = -2, etc."
Graph notes:
Green lines - Long Envelopes .
Red lines - Short Envelopes .
Orange line - MA for closing of Short positions.
Lime line - MA for closing of Long positions.
Histogram - Profit for the last day. Black = 0, Green> 0, Red <0.
Old flaws have been resolved.
At the moment, there is one bug - if the closing and opening occurs on the same candle, then there is no close on the same candle. The situation is possible with small values of Envelope.
**************************************************************************************************************************************************************************************************************
Опубликованный исходный код регулируется Условиями Стандартной Общественной Лицензии GNU Affero v3.0
Старые недоработки были решены.
Этот скрипт описывает и предоставляет функции бектеста для внутренней стратегии алгоритмического программного обеспечения "HatiKO bot".
Подходит для тестирования любой криптовалютной пары на любой бирже/платформе, на любом таймфрейме.
Кор-механика этой стратегии основана на теории всегда возвращающейся к значению МА цены с использованием индикатора Envelopes (Moving_average_envelope from Wiki)
Разработка этого скрипта и программного обеспечения для торговли вдохновлена следующими источниками:
Книга "Essential Technical Analysis: Tools and Techniques to Spot Market Trends" Ли Стивенса (опубликовано 12 апреля 2002 года)
«Moving Average Envelopes» от ChartSchool, платформа StockCharts (опубликовано 13 апреля 2015 года или раньше)
«Коля Колеснік» с канала Crypto Times («Метод сетка», опубликовано 19 августа 2018 года)
«Moving Average Envelopes: A Popular Trading Tool», статья Investopedia (опубликовано 25 июня 2019 года)
Блог KROOL1980 из Argolabs («Гридерство или Сетка как источник прибыли на форекс», опубликовано 27 февраля 2015 года)
Основные особенности:
1) До 9-х Ордеров в каждом из направлении (Лонг / Шорт)
2) Выбор из 6-ти разных базовых МА, опционально используйте разные МА для открытия и закрытия.
3) Используйте разные таймфреймы для расчета MA, без перерисовки и "эффекта стеклянного шара".
4) Фиксированный размер ордера, а не стратегия Мартингейла
5) Возможность закрытия открытой позиции заблаговременно, используя параметр Deviation
6) Код реализован на PineScript v4
7) Антишпиль ( защита от ситуаций типа LTCUSD ( Bitmex ) 26.12.2020 )
9) Лотность для каждого уровня
10) Суммарный профит за день. При активации рисуется гистограмма.
Описание параметров:
Lot - % от вашего первоначального баланса, используется при расчете размера Ордера
Timeframe Short - таймфрейм, используемый для расчета МА Открытия Шорт позиций, может быть выбран из списка, по умолчанию - таймфрейм текущего графика
MA Type Short - тип MA, используемый для расчета МА Открытия Шорт позиций, может быть выбран из списка, по умолчанию SMA
Data Short - источник цены для расчета МА Открытия Шорт позиций, может быть выбран из списка, по умолчанию OHLC4
MA Length Short - период, используемый для расчета МА Открытия Шорт позиций, должен быть >= 1, по умолчанию 3
MA Offset Short - смещение значения MA, используемого для расчета Шорт Ордеров, должно быть >= 0, по умолчанию 0
Timeframe Long - таймфрейм, используемый для расчета МА Открытия Лонг позиций, может быть выбран из списка, по умолчанию - таймфрейм текущего графика
MA Type Long - тип MA, используемый для расчета МА Открытия Лонг позиций, может быть выбран из списка, по умолчанию SMA
Data Long - источник цены для расчета МА Открытия Лонг позиций, может быть выбран из списка, по умолчанию OHLC4
MA Length Long - период, используемый для расчета МА Открытия Лонг позиций, должен быть >= 1, по умолчанию 3
MA Offset Long - смещение значения MA, используемого для расчета Лонг Ордеров, должно быть >= 0, по умолчанию 0
Mode close MA Short - Включает отдельное MA для закрытия Шорт позиции, по умолчанию «false». Если false, MA Закрытия = MA Открытия
Timeframe Short Close - таймфрейм, используемый для расчета МА Закрытия Шорт позиций, может быть выбран из списка, по умолчанию - таймфрейм текущего графика
MA Type Close Short - тип MA, используемый при расчете МА Закрытия Шорт позиции. Mожно выбрать из списка, по умолчанию SMA
Data Short Close - источник цены для расчета МА Закрытия Шорт позиций, может быть выбран из списка, по умолчанию OHLC4
MA Length Short Close - период, используемый для расчета МА Закрытия Шорт позиции, должен быть >= 1, по умолчанию 3
Short Deviation - % отклонения от значения MA, используется для закрытия позиции выше или ниже рассчитанного значения MA, может быть отрицательным, по умолчанию 0
MA Offset Short Close - смещение значения MA, используемого для расчета закрытия Шорт позиции, должно быть >= 0, по умолчанию 0
Mode close MA Long - Включает разные MA для закрытия Лонг позиции, по умолчанию «false». Если false, MA Закрытия = MA Открытия
Timeframe Long Close - таймфрейм, используемый для расчета МА Закрытия Лонг позиций, может быть выбран из списка, по умолчанию - таймфрейм текущего графика
MA Type Close Long - тип MA, используемый при расчете МА Закрытия Лонг позиции. Mожно выбрать из списка, по умолчанию SMA
Data Long Close - источник цены для расчета МА Закрытия Лонг позиций, может быть выбран из списка, по умолчанию OHLC4
MA Length Long Close - период, используемый для расчета МА Закрытия Лонг позиции, должен быть >= 1, по умолчанию 3
Long Deviation -% для перехода от значения MA, используется для закрытия позиции выше или ниже рассчитанного значения MA, может быть отрицательным, по умолчанию 0
MA Offset Long Close - смещение значения MA, используемого для расчета закрытия Лонг позиции, должно быть >= 0, по умолчанию 0
Short 1..9 - % от значения MA для размещения Ордеров, для Шорт Ордеров должен быть положительным, чем выше номер, тем выше должна располагаться позиция Short n, например: « Short 1 = 1, Short 2 = 2 и т.д. "
Long 1..9 - % от значения MA для размещения Ордеров, для Лонг Ордеров должно быть отрицательным, чем ниже число, тем ниже должна располагаться позиция Long n, например: « Long 1 = -1, Long 2 = -2, и т.д."
Пояснения к графику:
Зеленые линии - Лонг Ордера.
Красные линии - Шорт Ордера.
Оранжевая линия - MA Закрытия Шорт позиций.
Лаймовая линия - MA Закрытия Лонг позиций.
Гистограмма - Профит за последние сутки.Черная = 0, Зеленая > 0, красная < 0.
Старые недоработки были решены.
На данный момент есть один баг - если закрытие и открытие происходит на одной свече, то на этой же свече нет закрытия. Ситуация возможна при небольших значениях Envelope.
Published source code is subject to the terms of the GNU Affero General Public License v3.0
Old flaws have been resolved.
This script describes and provides backtesting functionality to internal strategy of algorithmic crypto trading software "HatiKO bot".
Suitable for backtesting any Cryptocurrency Pair on any Exchange/Platform, any Timeframe.
Core Mechanics of this strategy are based on theory of price always returning to Moving Average + Envelopes indicator (Moving_average_envelope from Wiki)
Developement of this script and trading software is inspired by:
"Essential Technical Analysis: Tools and Techniques to Spot Market Trends" by Leigh Stevens (published on 12th of April 2002)
"Moving Average Envelopes" by ChartSchool, StockCharts platform (published on 13th of April 2015 or earlier)
"Коля Колеснік" from Crypto Times channel ("Метод сетка", published on 19th of August 2018)
"3 ways to use Moving Average Envelopes" by Rich Fitton, published on Trader's Nest (published on 28st of November 2018 or earlier)
noro's "Robot WhiteBox ShiftMA" strategy v1 script, published on TradingView platform (published on 29th of August 2018)
"Moving Average Envelopes: A Popular Trading Tool" Investopedia article (published 25th of June 2019)
and KROOL1980's blogpost on Argolabs ("Гридерство или Сетка как источник прибыли на форекс", published on 27th of February 2015)
Core Features:
1) Up to 9 Envelopes in each direction (Long/Short)
2) Use any of 6 different basis MAs, optionally use different MAs for Opening and Closure
3) Use different Timeframes for MA calculation, without any repainting and lookahead bias.
4) Fixed order size, not Martingale strategy
5) Close open position earlier by using Deviation parameter
6) PineScript v4 code
7) Anti-Spire (protection against situations like LTCUSD (Bitmex) 12/26/2020)
9) Lottery for each level
10) Total profit for the day. When activated, a histogram is drawn.
Options description:
Lot - % from your initial balance to use for order size calculation
Timeframe Short - Timeframe to use for Short Opening MA calculation, can be chosen from dropdown list, default is Current Graph Timeframe
MA Type Short - Type of MA to use for Short Opening MA calculation, can be chosen from dropdown list, default is SMA
Data Short - Source of Price for Short Opening MA calculation, can be chosen from dropdown list, default is OHLC4
MA Length Short - Period used for Short Opening MA calculation, should be >=1, default is 3
MA offset Short - Offset for MA value used for Short Envelopes calculation, should be >= 0, default is 0
Timeframe Long - Timeframe to use for Long Opening MA calculation, can be chosen from dropdown list, default is Current Graph Timeframe
MA Type Long - Type of MA to use for Long Opening MA calculation, can be chosen from dropdown list, default is SMA
Data Long - Source of Price for Long Opening MA calculation, can be chosen from dropdown list, default is OHLC4
MA Length Long - Period used for Long Opening MA calculation, should be >=1, default is 3
MA offset Long - Offset for MA value used for Long Envelopes calculation, should be >= 0, default is 0
Mode close MA Short - Enable different MA for Short position Closure, default is "false". If false, Closure MA = Opening MA
Timeframe Short Close - Timeframe to use for Short Position Closure MA calculation, can be chosen from dropdown list, default is Current Graph Timeframe
MA Type Close Short - Type of MA to use for Short Position Closure MA calculation, can be chosen from dropdown list, default is SMA
Data Short Close - Source of Price for Short Closure MA calculation, can be chosen from dropdown list, default is OHLC4
MA Length Short Close - Period used for Short Opening MA calculation, should be >=1, default is 3
Short Deviation - % to move from MA value, used to close position above or beyond MA, can be negative, default is 0
MA offset Short Close - Offset for MA value used for Short Position Closure calculation, should be >= 0, default is 0
Mode close MA Long - Enable different MA for Long position Closure, default is "false". If false, Closure MA = Opening MA
Timeframe Long Close - Timeframe to use for Long Position Closure MA calculation, can be chosen from dropdown list, default is Current Graph Timeframe
MA Type Close Long - Type of MA to use for Long Position Closure MA calculation, can be chosen from dropdown list, default is SMA
Data Long Close - Source of Price for Long Closure MA calculation, can be chosen from dropdown list, default is OHLC4
MA Length Long Close - Period used for Long Opening MA calculation, should be >=1, default is 3
Long Deviation - % to move from MA value, used to close position above or beyond MA, can be negative, default is 0
MA offset Long Close - Offset for MA value used for Long Position Closure calculation, should be >= 0, default is 0
Short 1..9 - % from MA value to put Envelopes at, for Shorts numbers should be positive, the higher is number, the higher should be Short n position, example: "Short 1 = 1, Short 2 = 2, etc."
Long 1..9 - % from MA value to put Envelopes at, for Longs numbers should be negative, the lower is number, the lower should be Long n position, example: "Long 1 = -1, Long 2 = -2, etc."
Graph notes:
Green lines - Long Envelopes .
Red lines - Short Envelopes .
Orange line - MA for closing of Short positions.
Lime line - MA for closing of Long positions.
Histogram - Profit for the last day. Black = 0, Green> 0, Red <0.
Old flaws have been resolved.
At the moment, there is one bug - if the closing and opening occurs on the same candle, then there is no close on the same candle. The situation is possible with small values of Envelope.
**************************************************************************************************************************************************************************************************************
Опубликованный исходный код регулируется Условиями Стандартной Общественной Лицензии GNU Affero v3.0
Старые недоработки были решены.
Этот скрипт описывает и предоставляет функции бектеста для внутренней стратегии алгоритмического программного обеспечения "HatiKO bot".
Подходит для тестирования любой криптовалютной пары на любой бирже/платформе, на любом таймфрейме.
Кор-механика этой стратегии основана на теории всегда возвращающейся к значению МА цены с использованием индикатора Envelopes (Moving_average_envelope from Wiki)
Разработка этого скрипта и программного обеспечения для торговли вдохновлена следующими источниками:
Книга "Essential Technical Analysis: Tools and Techniques to Spot Market Trends" Ли Стивенса (опубликовано 12 апреля 2002 года)
«Moving Average Envelopes» от ChartSchool, платформа StockCharts (опубликовано 13 апреля 2015 года или раньше)
«Коля Колеснік» с канала Crypto Times («Метод сетка», опубликовано 19 августа 2018 года)
«Moving Average Envelopes: A Popular Trading Tool», статья Investopedia (опубликовано 25 июня 2019 года)
Блог KROOL1980 из Argolabs («Гридерство или Сетка как источник прибыли на форекс», опубликовано 27 февраля 2015 года)
Основные особенности:
1) До 9-х Ордеров в каждом из направлении (Лонг / Шорт)
2) Выбор из 6-ти разных базовых МА, опционально используйте разные МА для открытия и закрытия.
3) Используйте разные таймфреймы для расчета MA, без перерисовки и "эффекта стеклянного шара".
4) Фиксированный размер ордера, а не стратегия Мартингейла
5) Возможность закрытия открытой позиции заблаговременно, используя параметр Deviation
6) Код реализован на PineScript v4
7) Антишпиль ( защита от ситуаций типа LTCUSD ( Bitmex ) 26.12.2020 )
9) Лотность для каждого уровня
10) Суммарный профит за день. При активации рисуется гистограмма.
Описание параметров:
Lot - % от вашего первоначального баланса, используется при расчете размера Ордера
Timeframe Short - таймфрейм, используемый для расчета МА Открытия Шорт позиций, может быть выбран из списка, по умолчанию - таймфрейм текущего графика
MA Type Short - тип MA, используемый для расчета МА Открытия Шорт позиций, может быть выбран из списка, по умолчанию SMA
Data Short - источник цены для расчета МА Открытия Шорт позиций, может быть выбран из списка, по умолчанию OHLC4
MA Length Short - период, используемый для расчета МА Открытия Шорт позиций, должен быть >= 1, по умолчанию 3
MA Offset Short - смещение значения MA, используемого для расчета Шорт Ордеров, должно быть >= 0, по умолчанию 0
Timeframe Long - таймфрейм, используемый для расчета МА Открытия Лонг позиций, может быть выбран из списка, по умолчанию - таймфрейм текущего графика
MA Type Long - тип MA, используемый для расчета МА Открытия Лонг позиций, может быть выбран из списка, по умолчанию SMA
Data Long - источник цены для расчета МА Открытия Лонг позиций, может быть выбран из списка, по умолчанию OHLC4
MA Length Long - период, используемый для расчета МА Открытия Лонг позиций, должен быть >= 1, по умолчанию 3
MA Offset Long - смещение значения MA, используемого для расчета Лонг Ордеров, должно быть >= 0, по умолчанию 0
Mode close MA Short - Включает отдельное MA для закрытия Шорт позиции, по умолчанию «false». Если false, MA Закрытия = MA Открытия
Timeframe Short Close - таймфрейм, используемый для расчета МА Закрытия Шорт позиций, может быть выбран из списка, по умолчанию - таймфрейм текущего графика
MA Type Close Short - тип MA, используемый при расчете МА Закрытия Шорт позиции. Mожно выбрать из списка, по умолчанию SMA
Data Short Close - источник цены для расчета МА Закрытия Шорт позиций, может быть выбран из списка, по умолчанию OHLC4
MA Length Short Close - период, используемый для расчета МА Закрытия Шорт позиции, должен быть >= 1, по умолчанию 3
Short Deviation - % отклонения от значения MA, используется для закрытия позиции выше или ниже рассчитанного значения MA, может быть отрицательным, по умолчанию 0
MA Offset Short Close - смещение значения MA, используемого для расчета закрытия Шорт позиции, должно быть >= 0, по умолчанию 0
Mode close MA Long - Включает разные MA для закрытия Лонг позиции, по умолчанию «false». Если false, MA Закрытия = MA Открытия
Timeframe Long Close - таймфрейм, используемый для расчета МА Закрытия Лонг позиций, может быть выбран из списка, по умолчанию - таймфрейм текущего графика
MA Type Close Long - тип MA, используемый при расчете МА Закрытия Лонг позиции. Mожно выбрать из списка, по умолчанию SMA
Data Long Close - источник цены для расчета МА Закрытия Лонг позиций, может быть выбран из списка, по умолчанию OHLC4
MA Length Long Close - период, используемый для расчета МА Закрытия Лонг позиции, должен быть >= 1, по умолчанию 3
Long Deviation -% для перехода от значения MA, используется для закрытия позиции выше или ниже рассчитанного значения MA, может быть отрицательным, по умолчанию 0
MA Offset Long Close - смещение значения MA, используемого для расчета закрытия Лонг позиции, должно быть >= 0, по умолчанию 0
Short 1..9 - % от значения MA для размещения Ордеров, для Шорт Ордеров должен быть положительным, чем выше номер, тем выше должна располагаться позиция Short n, например: « Short 1 = 1, Short 2 = 2 и т.д. "
Long 1..9 - % от значения MA для размещения Ордеров, для Лонг Ордеров должно быть отрицательным, чем ниже число, тем ниже должна располагаться позиция Long n, например: « Long 1 = -1, Long 2 = -2, и т.д."
Пояснения к графику:
Зеленые линии - Лонг Ордера.
Красные линии - Шорт Ордера.
Оранжевая линия - MA Закрытия Шорт позиций.
Лаймовая линия - MA Закрытия Лонг позиций.
Гистограмма - Профит за последние сутки.Черная = 0, Зеленая > 0, красная < 0.
Старые недоработки были решены.
На данный момент есть один баг - если закрытие и открытие происходит на одной свече, то на этой же свече нет закрытия. Ситуация возможна при небольших значениях Envelope.

function: Array DownsamplingA low cost function to down sample a array.
specially useful for pattern recognition algorithms.

Reversal Algo (Zeiierman)█ Overview
Reversal Algo (Zeiierman) is an adaptive reversal and momentum detection system that helps identify hidden turning points, pressure zones, and changes in market direction. It brings together advanced modeling techniques such as dynamic volatility bands, adaptive trend tracking, and momentum-based confirmation signals into one clear, visual framework.
Unlike traditional reversal indicators that depend on static oscillators or fixed levels, this tool adapts in real time to market movement. It tracks volatility and directional flow to reveal when momentum is building, slowing down, or preparing to reverse.
Whether applied to short-term scalping, swing positioning, or macro structural validation, this tool provides an adaptive analytical environment that translates complex price dynamics into actionable context.
⚪ Why This One Is Unique
This version of Reversal Algo employs multi-domain adaptive modeling, combining envelope projection, trend inertia estimation, and contrarian equilibrium tracking within a single structure.
Its framework merges nonlinear smoothing manifolds with volatility-compensated directional phase mapping, allowing it to evolve with shifting market states rather than react to them.
Optional AI-driven optimizations enhance precision in unstable regimes by dynamically reshaping envelopes and tracking lines around localized flow curvature.
█ Main Features
⚪ Reversal Cloud
The Reversal Cloud highlights areas of potential expansion, compression, and turning points in price. It adapts to volatility by expanding when markets become unstable and tightening during periods of calm, creating a visual map of market rhythm and elasticity.
When the Cloud widens, it often signals exhaustion or increased turbulence; when it narrows, it suggests balance or an upcoming breakout.
With AI mode enabled, the Cloud automatically fine-tunes its shape to align with live price behavior, keeping its structure responsive and accurate.
⚪ Reversal Signals
Reversal Signals are designed to identify potential market turning points with precision. They combine multiple layers of price behavior—momentum shifts, directional changes, and balance-point deviations—to highlight areas where reversals are statistically more likely. To reduce false clusters, the system intelligently filters out repeated signals within a short time window.
⚪ Reversal/Exit Points
Reversal/Exit Points appear as small, color-coded dots above or below candles. They signal moments where price momentum slows or where the system detects a potential shift in directional strength. These markers are often found near short-term highs or lows, making them ideal for identifying profit-taking zones, re-entry setups, or early warnings of a possible reversal.
⚪ Trend Framework
The Trend Framework provides a clean visualization of the market’s prevailing direction. It smooths out short-term noise to reveal the core trend structure, showing when the market is expanding, contracting, or transitioning between phases.
This framework helps traders quickly see whether price action supports continuation or if the trend is weakening.
⚪ Trend Tracker Line
The Trend Tracker Line is a highly responsive trend detector that reacts quickly to shifts in momentum. It adapts dynamically to volatility, providing an accurate real-time view of directional acceleration and deceleration. This helps traders spot early changes in market tone and evaluate whether a move has the strength to continue.
When AI mode is enabled, the line automatically adjusts its sensitivity to remain stable and consistent across different market conditions.
⚪ Contrarian Bar Coloring
Contrarian Candle Coloring enhances chart readability by visually distinguishing strength from weakness. Green bars highlight areas of building upward momentum, while red bars point to potential pressure or exhaustion. The system continuously adapts its color transitions to reflect subtle momentum shifts, making it easier to recognize when the market is gaining or losing conviction.
An optional AI mode fine-tunes these transitions to match the current market rhythm, ensuring that candle coloration always reflects the underlying flow of strength and weakness.
█ How to Use
⚪ Reversal Trading
The primary purpose of the indicator is to identify reversal opportunities in the market. Reversal or contrarian trading means entering positions against the current directional move in anticipation of a fade or trend rotation. This approach often occurs in high-volatility environments, so it is important to widen your stops, reduce your initial position size, and, if appropriate, scale or average into positions carefully rather than committing all capital at once.
The Reversal Algo provides predefined Buy and Sell signals designed to highlight potential market peaks and troughs. While these signals are highly accurate, they are not meant to call every top or bottom perfectly. In a strong trending market, several reversal signals may appear consecutively before the market fully turns.
⚪ Reversal Signal + Candle Coloring
Combine Reversal Signals with Contrarian Candle Coloring for added confirmation. A practical approach is to wait for a Reversal Signal and then look for a color shift in the candles (for example, from contrarian-colored to standard candles). This color transition acts as confirmation that the active move may be losing strength and that a reversal could be underway.
⚪ Reversal Signals + Reversal Cloud
Consider taking reversal entries only when price interacts with the Reversal Cloud boundaries. The Cloud’s upper and lower layers act as dynamic resistance and support zones. When a Reversal Signal appears near or immediately after price rejection from one of these layers, it adds structural confirmation to the setup and strengthens the case for entry.
⚪ Reversal Signals + Key Levels
One of the most effective ways to trade Reversal Signals is by combining them with key price levels, such as the previous day’s high, low, or close. If price rejects one of these levels while a Reversal Signal prints simultaneously, the confluence of the two events serves as strong validation for a potential turning point.
⚪ Take Profit
The Reversal/Exit Points can function both as entry confirmations and as take-profit zones. If a Reversal Signal was missed but a new Reversal/Exit Point appears near a peak or trough, it can indicate a late-entry opportunity aligned with exhaustion behavior.
These dots are most powerful as profit-taking signals. Since they form near local highs and lows, they often mark regions of temporary imbalance where reversals are likely. When a Reversal/Exit Point forms in the opposite direction of your current position, consider taking partial profits or tightening stops to lock in gains while maintaining participation in the broader move.
█ How It Works
⚪ Reversal Cloud Engine
The Reversal Cloud defines the dynamic upper and lower boundaries of market elasticity by transforming recent price displacements into a smooth volatility field. Through multi-layered envelope modeling, it constructs a continuous topology of expansion and compression zones, revealing where directional energy accumulates or dissipates.
Calculation: Uses layered volatility envelopes that adapt to changing market speed and expansion. A built-in alignment mechanism keeps the upper and lower bands synchronized, while optional AI optimization adjusts the symmetry of the cloud based on short-term directional bias.
⚪ Trend Tracker System
The Trend Tracker isolates directional persistence by modeling angular displacement of price flow over adaptive temporal curvature. It interprets slope evolution as a continuously evolving directional vector field, capturing both acceleration and deceleration within the active regime.
Calculation: Applies adaptive slope modeling to estimate the dominant direction of price flow. The system smooths fluctuations dynamically while maintaining responsiveness to significant shifts in trend velocity. When AI mode is active, an intelligent weighting adjustment refines the tracker’s equilibrium bias for better phase synchronization.
⚪ Trend
The Trend module projects a dual-polarity directional lattice, distinguishing constructive (positive) and distributive (negative) flow environments. It defines equilibrium corridors that expand and contract with evolving trend geometry, offering visual feedback on regime strength and transition probability.
Calculation: Uses weighted directional regression to estimate upper, middle, and lower trend layers. Each structure is color-coded based on price slope and relative position, creating a continuous and easy-to-read trend map.
⚪ Contrarian Bar Coloring Engine
Contrarian bar coloring converts raw bar data into a slope-weighted momentum matrix, visually encoding thrust versus decay phases in real time. It acts as a microstructural interpreter of price inertia, identifying acceleration clusters and momentum fatigue through color transitions.
Calculation: Combines slope analysis and volatility normalization to evaluate how strong or weak each price bar is relative to its trend. The results are reflected in real-time color changes that emphasize momentum strength and fatigue.
⚪ Reversal/Exit System
Reversal and Exit Points are derived from an evolving volatility-based trail that tracks directional exhaustion and reversion potential. These markers visualize transitions in directional energy—helping traders anticipate trend slowdowns or reversal probabilities.
Calculation: Constructs an adaptive volatility trail that contracts as directional momentum weakens. A state-aware detection model identifies inflection points where pressure changes polarity, producing the plotted up/down dots that mark possible reversals or exits. This ensures that each signal dynamically reflects real-time shifts in market energy rather than static thresholds.
⚪ Reversal Signals Core
The Reversal System’s entry framework is designed for precision. It combines several layers of short-term momentum analysis into clear, directionally aligned signals. By balancing different market speeds and measuring how far the price moves from its equilibrium, it identifies high-probability areas where trends may continue or reverse.
Calculation: Implements a composite synchronization framework that aligns short-term momentum phases with equilibrium drift and directional bias. Redundant triggers are filtered out through temporal separation logic, ensuring only the most distinct and reliable signals are displayed. Adaptive thresholds adjust automatically based on volatility and trading mode, maintaining signal consistency across scalp, intraday, and swing environments.
⚪ AI-Adaptive Optimization Layer
The AI layer refines selected modules — Reversal Cloud, Trend Tracker, and Contrarian Candles — by continuously recalibrating their internal weighting curves according to volatility structure and price curvature. It acts as an intelligent stabilizer that adjusts smoothing depth, boundary stiffness, and gradient bias dynamically.
Calculation: Utilizes a Context-Aware Kernel Adjustment Engine, estimating curvature variance and phase imbalance to auto-tune envelope response. The model performs iterative self-alignment to preserve directional fidelity under rapidly changing flow dynamics.
-----------------
Disclaimer
The content provided in my scripts, indicators, ideas, algorithms, and systems is for educational and informational purposes only. It does not constitute financial advice, investment recommendations, or a solicitation to buy or sell any financial instruments. I will not accept liability for any loss or damage, including without limitation any loss of profit, which may arise directly or indirectly from the use of or reliance on such information.
All investments involve risk, and the past performance of a security, industry, sector, market, financial product, trading strategy, backtest, or individual's trading does not guarantee future results or returns. Investors are fully responsible for any investment decisions they make. Such decisions should be based solely on an evaluation of their financial circumstances, investment objectives, risk tolerance, and liquidity needs.
Paid script

Relativity BEARS FUTURES 50X 4H AlgorithmHi,
This system is prepared only for leveraged markets and for Futures and CFD markets.
Leveraged processing apply to cryptocurrency contracts that are also subject to.
System parameters:
Timeframe = 4H (4 Hours)
Leverage = 50X
Position Size = %1 (0.01) Each Trade
Market Direction : Short
System features :
- It targets the Risk /Reward Ratio of 1/3 and above. (Risk/Reward Ratio >= 3 )
- If a Take Profit Point has come in a successful trade but the parameter conformity has not deteriorated, system continues the trade.
- In this way, you can catch strong long trends several times a year.
But it is strict as stop-loss and avoids large declines,whipsaws whenever possible.
- The system tries to avoid unnecessary processes as much as possible.
This means less commission and less sideways market.
- Since it takes advantage of the reverse market, it is suitable not only for long and short but only for short position, ie "bears".
But this neutralizes unnecessary processes.
- Stop-Loss points and Snow-take points are shown in red and green.
-However, if there is a small amount of follow-up available at the computer, it is recommended to put stop-loss only.
Because the system revises both stop-loss and take profit points according to the conditions formed.
Doing this in the right major long trend here allows you to be in trades.
-The system takes into account the risk and only opens transactions where the value corresponding to 10 leverage ratio is greater than the risk.
This provides as much protection from risk as possible.
-Alerts added.
About Backtest :
Since this system uses leveraged market, backtest results are not healthy.
But since it targets the 1/3 Risk Reward Rate (3.00),
we must look Ratio Avg Win/Loss and it must be over 0.5 because :
This ratio means: When we reach 33% of our correct trades in all our trades, we are at breakeven.
This is 100 - 33 = 66
33/66 = 0.5 (Ratio Avg. Win / Avg Loss )
So whenever this rate is over 0.5, we make a profit.
*** The fact that this ratio is over 0.70-1.00 in terms of securing ourselves because there is a maturity in the future indicates that we are doing
successful snowball trades.(Because future contracts have loss of maturity and end dates)
And we achieve success cumulatively.
Important Note : This system is prepared only for these parameters.
These parameters are designed for Futures and CFDs.
It doesn't work in spot markets and Forex Markets.
NOTE :
The system has been prepared as a strategy to present success in a transparent manner.
Please check "Ratio Avg . Win / Avg Loss" rates in backtests.(Especially preferred financial instruments what you trade generally)
Important Note 2 -
Although the system revises the stop and take profit points in the required parameters, the most accurate place is when the signal comes.
It should be entered when the signal comes as much as possible and if this did not happen,
trade must be opened in the nearest bars after the signal comes.
If the position is not closed, renew your position in the new month by observing the maturity conditions.
Here you should pay attention to the maturity, the cost of transportation.
Because the more time to maturity, the more advantageous it will be.
Best regards.

Relativity BULLS FUTURES 50X 4H AlgorithmHi,
This system is prepared only for leveraged markets and for Futures and CFD markets.
Leveraged processing apply to cryptocurrency contracts that are also subject to.
System parameters:
Timeframe = 4H (4 Hours)
Leverage = 50X
Position Size = %1 (0.01) Each Trade
System features :
- It targets the Risk /Reward Ratio of 1/3 and above. (Risk/Reward Ratio >= 3 )
- If a Take Profit Point has come in a successful trade but the parameter conformity has not deteriorated, system continues the trade.
- In this way, you can catch strong long trends several times a year.
But it is strict as stop-loss and avoids large declines,whipsaws whenever possible.
- The system tries to avoid unnecessary processes as much as possible.
This means less commission and less sideways market.
- Since it takes advantage of the reverse market, it is suitable not only for long and short but only for long position, ie "bulls".
But this neutralizes unnecessary processes.
- Stop-Loss points and Snow-take points are shown in red and green.
-However, if there is a small amount of follow-up available at the computer, it is recommended to put stop-loss only.
Because the system revises both stop-loss and take profit points according to the conditions formed.
Doing this in the right major long trend here allows you to be in trades.
-The system takes into account the risk and only opens transactions where the value corresponding to 10 leverage ratio is greater than the risk.
This provides as much protection from risk as possible.
-Alerts added.
About Backtest :
Since this system uses leveraged market, backtest results are not healthy.
But since it targets the 1/3 Risk Reward Rate (3.00),
we must look Ratio Avg Win/Loss and it must be over 0.5 because :
This ratio means: When we reach 33% of our correct trades in all our trades, we are at breakeven.
This is 100 - 33 = 66
33/66 = 0.5
So whenever this rate is over 0.5, we make a profit.
*** The fact that this ratio is over 0.70-1.00 in terms of securing ourselves because there is a maturity in the future indicates that we are doing
successful snowball trades.(Because future contracts have loss of maturity and end dates)
And we achieve success cumulatively.
Important Note : This system is prepared only for these parameters.
These parameters are designed for Futures and CFDs.
It doesn't work in spot markets and Forex Markets.
NOTE :
The system has been prepared as a strategy to present success in a transparent manner.
Please check "Ratio Avg . Win / Avg Loss" rates in backtests.
Important Note 2 -
Although the system revises the stop and take profit points in the required parameters, the most accurate place is when the signal comes.
It should be entered when the signal comes as much as possible and if this did not happen,
trade must be opened in the nearest bars after the signal comes.
If the position is not closed, renew your position in the new month by observing the maturity conditions.
Here you should pay attention to the maturity, the cost of transportation.
Because the more time to maturity, the more advantageous it will be.
Best regards.

Relativity BEARS FUTURES 10X 1D AlgorithmHi,
This system is prepared only for leveraged markets and for Futures and CFD markets.
Leveraged processing apply to cryptocurrency contracts that are also subject to.
System parameters:
Timeframe = 1D (1 Day)
Leverage = 10x
Position Size = %1 (0.01) Each Trade
System features :
- It targets the Risk /Reward Ratio of 1/3 and above. (Risk/Reward Ratio >= 3 )
- If a Take Profit Point has come in a successful trade but the parameter conformity has not deteriorated, system continues the trade.
- In this way, you can catch strong long trends several times a year.
But it is strict as stop-loss and avoids large declines,whipsaws whenever possible.
- The system tries to avoid unnecessary processes as much as possible.
This means less commission and less sideways market.
- Since it takes advantage of the reverse market, it is suitable not only for long and short but only for short position, ie "bears".
But this neutralizes unnecessary processes.
- Stop-Loss points and Snow-take points are shown in red and green.
-However, if there is a small amount of follow-up available at the computer, it is recommended to put stop-loss only.
Because the system revises both stop-loss and take profit points according to the conditions formed.
Doing this in the right major long trend here allows you to be in trades.
-The system takes into account the risk and only opens transactions where the value corresponding to 10 leverage ratio is greater than the risk.
This provides as much protection from risk as possible.
-Alerts added.
About Backtest :
Since this system uses leveraged market, backtest results are not healthy.
But since it targets the 1/3 Risk Reward Rate (3.00),
we must look Ratio Avg Win/Loss and it must be over 0.5 because :
This ratio means: When we reach 33% of our correct trades in all our trades, we are at breakeven.
This is 100 - 33 = 66
33/66 = 0.5
So whenever this rate is over 0.5, we make a profit.
*** The fact that this ratio is over 0.70-1.00 in terms of securing ourselves because there is a maturity in the future indicates that we are doing
successful snowball trades.(Because future contracts have loss of maturity and end dates)
And we achieve success cumulatively.
Important Note : This system is prepared only for these parameters.
These parameters are designed for Futures and CFDs.
It doesn't work in spot markets and Forex Markets.
NOTE :
The system has been prepared as a strategy to present success in a transparent manner.
Please check "Ratio Avg . Win / Loss" rates in backtests.
Important Note 2 -
Although the system revises the stop and take profit points in the required parameters, the most accurate place is when the signal comes.
It should be entered when the signal comes as much as possible and if this did not happen,
trade must be opened in the nearest bars after the signal comes.
Here you should pay attention to the maturity, the cost of transportation.
Because the more time to maturity, the more advantageous it will be.
Best regards.

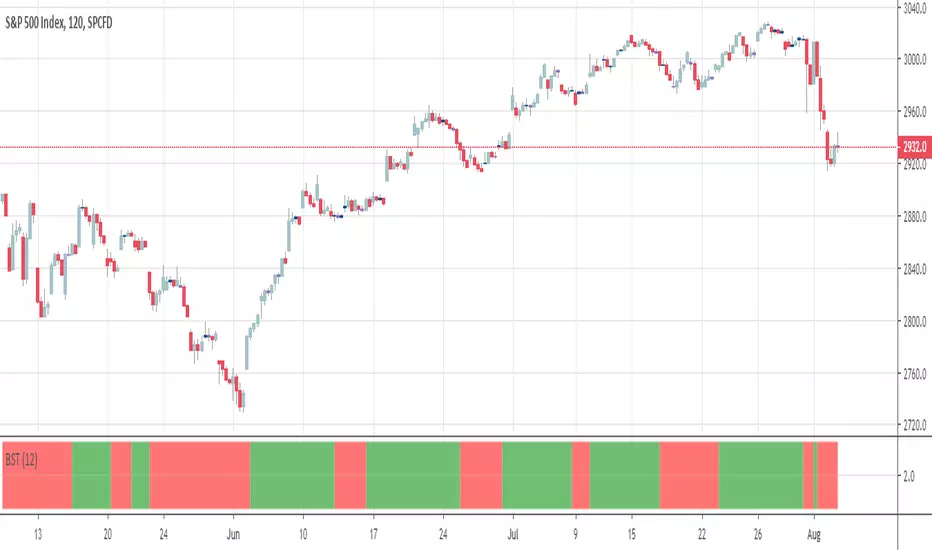
Bitcoin: Top & Bottom Mini-AlgoHere we have a mini-algorithm that tries to show absolute 4-year-cycle top and bottom zones for the case of the BraveNewCoin Liquid Index (BLX) for Bitcoin on the weekly (W) timeframe by using several oscillators as RSI, VPCI etc. employed with a custom logic. When the background gets red we might be near to a cycle peak, and when it gets green we might be near to the absolute bottom of the current cycle. Note that only absolute top/bottoms are indicated (at least since the end of 2013), so that the current strong drop in March 2020 was correctly not tagged, as it wasn't the lowest price of the current cycle.
It is best to combine this mini-algorithm with some of my boundary indicators for BLX, e.g. "Bitcoin: Price Action Integrals", for confluence . For the next peak one could then watch for the mini-algo to go red and for the price to hit the boundary. You can change the background transparency if you like to have this indicator be more unobstrusive on the chart.
For access please contact me via DM on TradingView or on Twitter (linked on my TradingView profile and my signature).

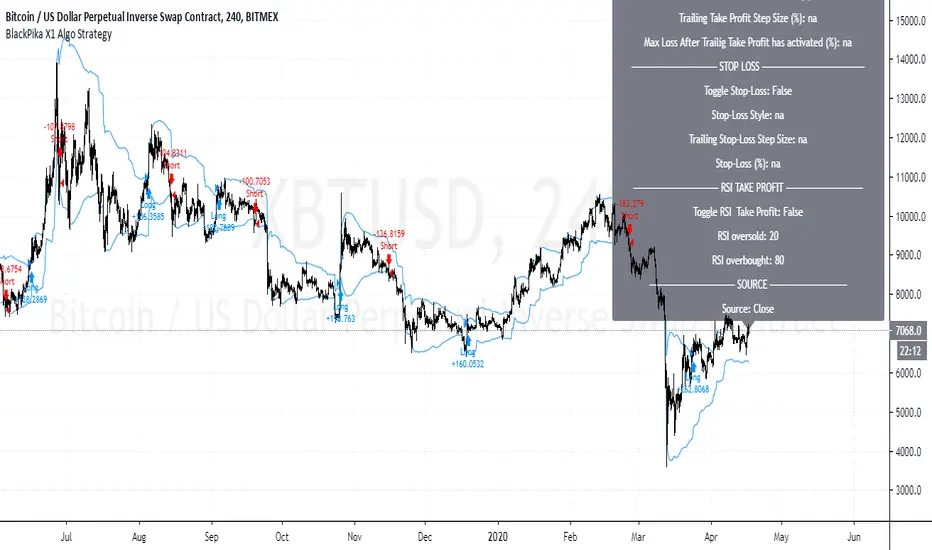
BlackPika X1 Algo StrategyBlackPika X1 Algo is a successor to the original BlackPika Algo.
It uses the following main elements:
RSI
ATR
ADX
Volume
Chopiness Filter
Trailing Profit
Fixed Profit
Trailing Stop loss
Fixed Stop Loss
Donchian channels and some more...
The backtest you see includes a commision of 1% and slippage of 1 tick. and the start date is from 2015
All the above mentioned settings are customisable, and can be adapted to your liking, timeframe and Asset.
Hit me up if you have any questions. This is only a backtest version.
All the best in your trading.
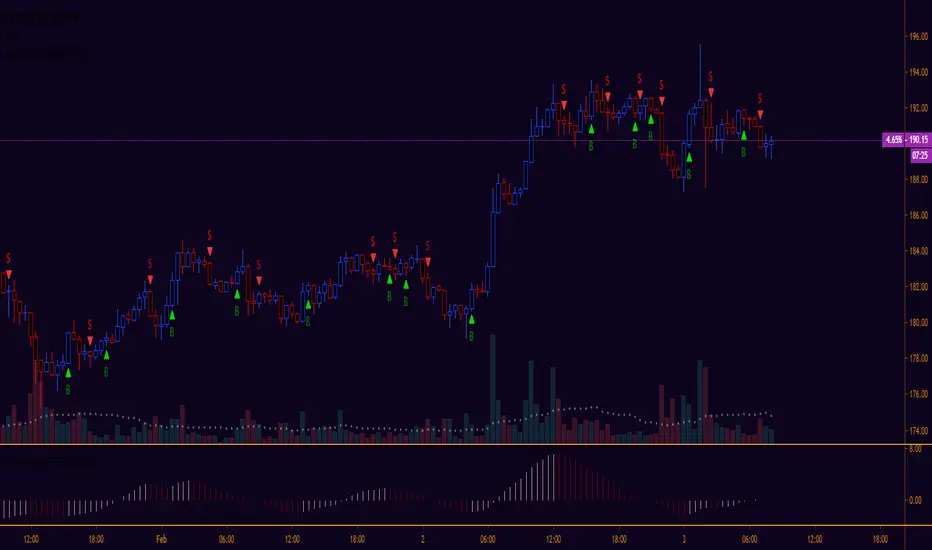
Aggressive Buy/Sell AlgoBacktested, high percentage gains aggressive indicator/algo.
Version 1.
I recommend using this script to form your bias for your selected timeframe.
If you are trading solely based off the indicator, each Buy/Sell signal is not an indication to close a previous position.
For example, if you open a position because of a recent sell signal you do not have to close it on the next buy signal.
If you are running an algo however, it is personal preference.
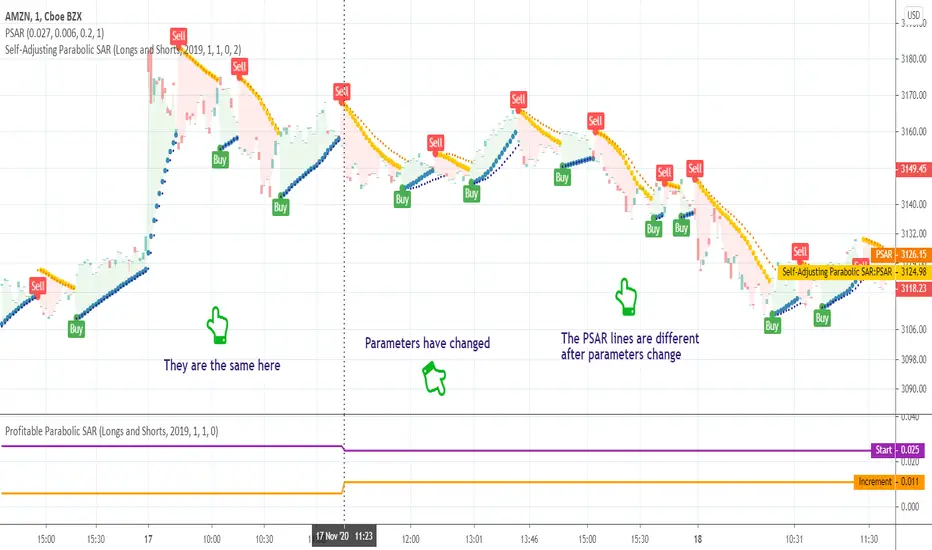
Self-Adjusting Parabolic SARWhat is this tool?
This is an implementation of the well-known Parabolic SAR indicator that can adjust parameters on the fly to achieve a better profitability.
The algorithm was borrowed from Profitable Parabolic SAR and connected to the basic Parabolic SAR implementation. So, now it will switch parameters automatically without any manual work required.
Profitable Parabolic SAR indicator can be found here:
Parabolic SAR indicator can be found here:
Self-Adjusting SuperTrendWhat is this tool?
This is an implementation of the well-known SuperTrend indicator that can adjust parameters on the fly to achieve a better profitability.
The algorithm was borrowed from Profitable SuperTrend and connected to the basic SuperTrend implementation. So, now it will switch parameters automatically without any manual work required.
Alerts
The same alerts as for the basic SuperTrend + special alert to notify user about parameters switching.
Profitable SuperTrend indicator can be found here:
SuperTrend indicator can be found here:
Good luck!

BSTtrend (and a quick note on trading psychology)Hi again :)
Script #2 for tonight, more to come :)
This one is a Pine transcription of a FXCM/LUA script called BSTrend
I used it years ago to trade index on very low timeframes with it. I'm always looking for oscillators that are more reactive than the traditional MACD. And even more reactive than the MACD Zero Lag
This is a proof of concept that Pinescript is my favorite trading programming language vs MT4/LUA/PRT. I just find it easier and the Pinescript community is helping a lot
With the BSTrend you can win but also lose. I see a lot of scripts out there but there is not a better or worst indicator. The key is HOW to use it.
In other words the key is your PSYCHOLOGY, without a rock-solid psychology, you'll end up committing a mistake even with G. himself whispering "BUY NOW", "SELL NOW" to your ears. (wait..... Do you mean this is happening only to me ????)
However, indicators help immensely in reducing the psychology pressure that we have to endure ... sometimes for days..... But better not to overcharge with dozens of indicators per chart and have a tool to detect whenever there is a confluence/convergence of your favorite indicators :) #algorithm #builder
I'll publish an educational post about next week
Those are the exact words that my mentor traders told me 6 years ago when I started trading
PS
____________________________________________________________
Be sure to hit the thumbs up as it shows me that I'm not doing this for nothing and will motivate to deliver more quality content in the future.
- I'm an officially approved PineEditor/LUA/MT4 approved mentor on codementor. You can request a coaching with me if you want and I'll teach you how to build kick-ass indicators and strategies
Jump on a 1 to 1 coaching with me
- You can also hire for a custom dev of your indicator/strategy/bot/chrome extension/python
Profitable SuperTrendHello friends,
This script is a powerful, non-repainting optimizer for the classic SuperTrend indicator — one of the most popular tools for trend-following and volatility-based trading. It automatically finds and applies the most profitable SuperTrend settings for each instrument and timeframe, removing the need for manual parameter tuning or guesswork.
🛠 How It Works
The indicator evaluates over 1,400 combinations of ATR Periods and Multipliers using a decision tree–based optimization algorithm .
Each configuration is backtested across the instrument's full history, and when a more profitable setup is identified, the indicator automatically switches to those values in real time — while preserving the standard SuperTrend logic.
It also supports commission customization for more realistic backtesting and includes an alert system that notifies you whenever a better parameter set is found.
This adaptive approach keeps the SuperTrend continuously tuned to evolving market conditions without repainting or distorting past data.
💡 Integrated Versions Explained
This all-in-one tool merges 3 complementary indicators:
• Profitable SuperTrend — A dedicated optimizer that runs in a separate window below your chart. It doesn’t produce buy/sell signals directly but analyzes your asset and timeframe to find optimal ATR settings. Results are visualized as two lines (purple and orange), with optional labels displaying the best parameter values. You can then manually apply these values to your standard SuperTrend.
• Self-Adjusting SuperTrend — A real-time overlay version that behaves like the standard SuperTrend but dynamically adjusts its parameters on the fly. It requires no manual setup and can be paired with the Profitable SuperTrend for full transparency over which values are currently active.
• Compact Self-Adjusting SuperTrend — A minimalist oscillator version that uses simple binary outputs: -1 for Sell and 1 for Buy. This format is ideal for filtering or integrating the adaptive logic into other trading systems.
Together, they form a complete adaptive suite that combines automation, flexibility, and precision — suitable for both discretionary and systematic traders.
🔥 Key Features
Adaptive optimization powered by a decision tree–based algorithm
Real-time switching to the most profitable SuperTrend parameters
Commission customization for realistic backtesting
Direction filter (Longs | Shorts | Longs & Shorts)
Optional analysis start date for focused historical testing
Smart alert when better settings are detected
Optional buy/sell labels and compact trend output
Clean and organized UI with improved workflow
If you'd like access or have any questions, feel free to reach out to me directly via DM.
👋 Good luck and happy trading!
Paid script


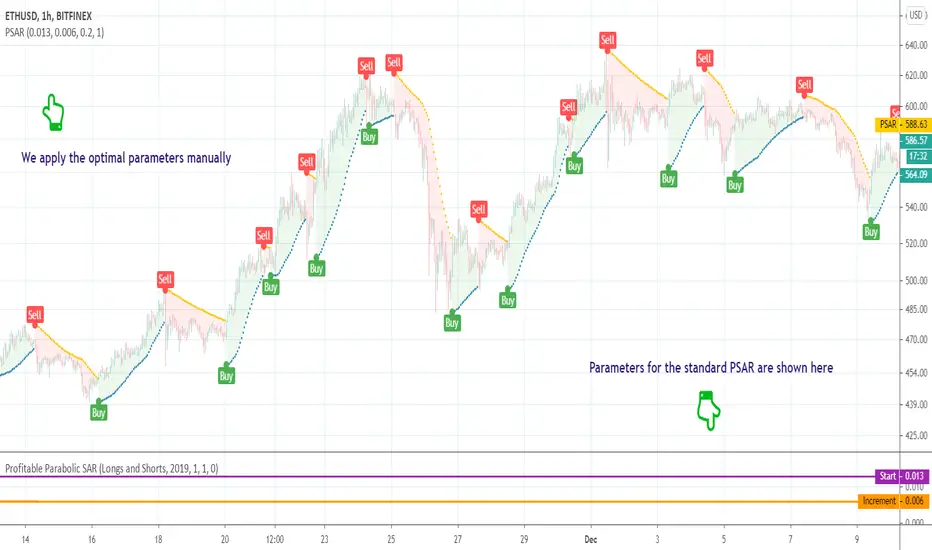
Profitable Parabolic SARHello friends,
This script is a powerful, non-repainting optimizer for the classic Parabolic Stop and Reverse (PSAR) — one of J. Welles Wilder's most respected trend-following systems. It automatically finds and applies the most profitable PSAR settings for each instrument and timeframe, eliminating the need for manual parameter tuning.
🛠 How It Works
The indicator evaluates over 500 combinations of PSAR parameters using a decision tree–based algorithm under the hood .
Each configuration is backtested across the instrument's full price history, and when a more profitable setup is identified, the indicator seamlessly switches to those values in real time — while maintaining the original PSAR logic.
The Maximum parameter remains fixed since its impact on overall profitability is minimal compared to Start and Increment.
This self-adjusting approach removes the guesswork of parameter optimization and keeps the PSAR dynamically tuned to changing market regimes.
💡 Integrated Versions Explained
This all-in-one tool merges 3 complementary indicators:
• Profitable PSAR — A parameter optimizer that runs in a separate window below your main chart. It doesn't generate buy/sell signals directly but analyzes your specific asset and timeframe to find optimal settings. These are displayed as two lines (purple and orange), with optional labels showing the actual parameter values. Once identified, you can apply these optimal values manually to the standard PSAR.
• Self-Adjusting PSAR — A real-time overlay version that looks and behaves like the standard PSAR but automatically adjusts its parameters on the fly. It requires no manual configuration and can be paired with the Profitable PSAR to monitor which settings are currently active.
• Compact Self-Adjusting PSAR — A minimalist oscillator version that reflects the same adaptive logic through simple binary outputs: -1 for Sell and 1 for Buy. This variant is ideal for filtering or signal integration into other systems.
Together, they form a unified adaptive system that gives users both automation and interpretability — the best of both worlds.
🔥 Key Features
Adaptive optimization powered by a decision tree–based algorithm
Real-time switching to more profitable parameter configurations
Direction filter (Longs | Shorts | Longs & Shorts)
Optional analysis start date for focused historical testing
Commission customization for realistic performance modeling
Visual highlighting of parameter changes
Optional buy/sell labels and compact trend signal display
If you'd like access or have any questions, feel free to reach out to me directly via DM.
👋 Good luck and happy trading!
Paid script
Profitable Vortex Indicator ScannerIntroduction
The Vortex Indicator is a technical indicator invented by Etienne Botes and Douglas Siepman (Technical Analysis of Stocks & Commodities, V.28:1 (January, 2010): "The Vortex Indicator") to identify the start of a new trend or the continuation of an existing trend within financial markets.
It is composed of two lines, +VI and -VI . +VI represents up trending momentum and -VI represents down trending momentum.
The most basic strategy is to use the crossovers as trade signals:
when +VI crosses above -VI , go Long
when -VI crosses above +VI , go Short
Exit when a crossover occurs in the opposite direction
What is this tool?
This tool is a performance scanner that uses a decision tree-based algorithm under the hood to find the most profitable period's setting for the indicator. It analyzes the range of periods between 2 to 100 and backtests the Vortex Indicator for each period using the strategy mentioned above across the entire history of an instrument.
Settings
Net Profit line is optional and can be hidden through settings.
Alerts
It has an alert that notifies when a more profitable period was detected.
NOTE : It does not change what has already been plotted.
Good luck!

[New series!] [Consistent Losing Strategies] 34 EMA Scalping//---------------------------INTRO------------------------------
Hi All!
Let me introduce myself as a semi-successful forex trader & lover of automation.
I've taken to algo trading and have been hunting down strategies (that usually use indicators) to automate, backtest, and hopefully implement in MT4.
Unfortunately, most strategies are complete bulls*** and the select cases that are shown to "prove" success are limited.
These strategy sources often do not provide useful analytics either.
I want to change that approach to trading! We can really benefit each other and the community by being methodical about backtesting
as well as evaluating our results with some kind of scoring heuristic.
As for what that standardized process looks like..well I'm still working on it.
I'm pretty much on Tv for multiple hours of the day, screening strategies via Pinescript and I'd like to start sharing my progress!
This is a new series I'd like to start on consistently losing strategies. I'll make all the code public, so if you think I've made a blunder
or approached a problem the wrong way, then drop me a DM or paste your fix into the comments.
//---------------------------STRAT------------------------------
34 EMA Scalping strategy (ref. forextradingstrategies4u )
How you're supposed to trade it:
BUY:
1. Market is in an down trend as shown by the 34 EMA
2. Price breaks above a downwards trend line
3. Price breaks above the 34 EMA
4. Look for a very bullish candlestick or chart pattern
SELL:
1. Look for the 34 EMA to show we are in an uptrend
2. Price breaks below an upwards sloping trend line
3. Price breaks below 34 EMA
4. Look for a bearish candlestick or a chart pattern
//---------------------------CONC------------------------------
Q: Why does it fail?
A: I believe this strategy relies too much on subjective input (aka, trendlines).
Q: Why does it fail as an algo?
A: The 34 EMA is no more predictive than any other EMA, although it does a good job at filtering out noise.
Q: Should I try it out?
A: No, it's trash. This is the proof that it is trash.

BTC Precognition - Mtrl_ScientistHello Everyone,
I have been interested in algorithmic trading for a while now, and have picked up coding in Python/C++ 2 years ago, which made it possible for me to understand Pine Script (Trading View's proprietary language) fairly easily. I got interested in Bitcoin in 2013, but have only started actually investing in mid 2017. Making money during a bull run is easy but it's really the bear market that teaches you a lesson. So I went about and tried to avoid losses in future bear markets by digging into the analysis of financial time series. I looked around and found useful books, examples of pine script code, technical analyses from fellow chartists and sought out to combine it all into algorithms that can help prevent losses during the next bear market.
I came up with several profitable scripts, but let this be the first one I'm actually sharing with you guys. It draws data from all major Bitcoin exchanges (Hence this script will ONLY work for BTCUSD ) and is based on CVI, Fractal Adaptive Moving Avergage ( FRAMA ), and some calculus operations to make sense of their relationship.
I tried to tidy the final version up as much as possible, so that it becomes straightforward to use. All you need to look at is when the bar becomes green/red, the bar height is just the integrated area since it's crossed the 0-line and can serve as a threshold on lower time frames to avoid noise.
I've got a degree in Chemistry, so don't take this as financial advice, but please do let me know what you think!
Note:
- This is a re-upload because the first version got pulled due to linking to Twitter
- Script works best with Hekin Ashi candles
Planned features:
- Reduce amount of signals on lower time frames
- Make it work better with normal candles
Suggestions?

OmenImproved momentum-based trading algorithm based on my previous Merlin V6 script. Adjusted trade filtering rules to improve net return and profit factor on both long and short positions.
Works best with mid time-frame Heikin-Ashi data.
