Strategy Validator PRO - Backtest & Alerts📊 Strategy Validator PRO is a professional analytical indicator for TradingView designed to evaluate trade configurations, risk structure, and potential outcomes under current market conditions.
The indicator generates trade signals, visualizes entry and exit levels, and provides statistical context to support data-driven trading decisions rather than assumptions.
⚠️ PRO version is available by invitation only.
A simplified FREE version is publicly available for concept evaluation.
🔶 Core Concept
Most indicators answer the question:
“Where to enter?”
Strategy Validator PRO focuses on a more important one:
“How justified is this trade under current market conditions?”
The indicator applies a predefined analytical logic and evaluates how well the current trade setup aligns with statistically stable market conditions identified on an extended historical dataset.
🔶 Key Features
📈 Trade Configuration Analysis
The indicator evaluates:
• signal quality
• current market regime (trend, consolidation, volatility)
• risk-to-outcome structure
• historical behavior of similar setups
🎯 The goal is to filter weak or unfavorable trade conditions rather than simply generate signals.
🎯 Trade Structure on Chart
Each trade is displayed directly on the chart with a clear structure:
• Entry — trade entry level
• Take Profit — projected target level
• Stop Loss — risk limitation level based on market structure and volatility
This allows immediate understanding of trade boundaries without manual calculations.
🧪 Integrated Backtest Dashboard
The indicator displays performance statistics for the active logic:
• Win Rate
• Profit Factor
• Maximum Drawdown
• Net Profit
• Total Trades
Two panels are available:
• BACKTEST — historical performance overview
• POSITION — details of the current open trade
📌 Historical data is used to provide statistical context, not to predict future performance.
🔔 TradingView Alerts (PRO)
In the PRO version, alerts can be configured using TradingView’s native alert system.
Alerts may be created for:
• trade configuration formation
• target level reached
• risk limitation triggered
Available alert formats:
• Simple — plain text
• With levels — including price levels
• JSON — structured format for external analysis
🔶 PRO vs FREE
🟢 FREE
• Base analytical logic
• Limited historical depth
• Core trade structure
• Backtest dashboard
• Trade history
🔵 PRO
• Extended historical analysis
• Higher statistical sampling depth
• Trade condition filtering
• TradingView alerts
FREE version is intended for concept evaluation.
PRO version is designed for systematic and disciplined trading.
🔶 Markets & Timeframes
🌍 Compatible with all TradingView markets:
• Crypto
• Forex
• Stocks & ETFs
• Indices
• Commodities
• Futures
⏱ Works on all timeframes — from intraday to long-term.
🔶 Access
🔓 FREE version
Publicly available.
🔐 PRO version
Available by invitation.
Access can be requested via the author’s profile links or by contacting the author directly.
⚠️ Important Notice
This indicator is an analytical tool and does not guarantee profitability.
It is not a trading robot or automated execution system.
Past performance does not guarantee future results.
Always apply proper risk management.
Search in scripts for "backtest"

Strategy Validator - Backtest & Live TradeStrategy Validator is an analytical indicator for TradingView designed to evaluate trade setups, risk structure, and price behavior in real time.
The indicator builds trade scenarios, visualizes key trade levels, and provides statistical context based on historical data.
Its purpose is to help traders better understand current trade conditions and make decisions based on market structure rather than isolated signals.
🔶 Conceptual Approach
Many tools focus on a single question:
“Is there a signal right now?”
Strategy Validator approaches the market differently by analyzing a trade as a structured scenario that includes:
• current market state
• price position relative to key levels
• acceptable risk boundaries
• potential price expansion range
The indicator evaluates how well the active trade configuration aligns with historically observed market conditions and visualizes its boundaries directly on the chart.
🔶 Trade Condition Analysis
For each active configuration, the indicator evaluates:
• alignment of the entry with market structure
• market phase (directional movement, range, or elevated activity)
• risk-to-outcome relationship
• historical behavior of similar setups
The goal is to highlight trades with a clear structure and controlled risk , while filtering out weak or unstable conditions.
🎯 Trade Structure on Chart
Each trade is displayed directly on the chart with clearly defined elements:
• Entry — trade entry level
• Take Profit — projected target level
• Stop Loss — risk limitation level based on market structure and volatility
This allows immediate understanding of trade boundaries without manual calculations.
🧪 Statistical Context & Backtest
The indicator includes an integrated statistical panel showing:
• Win Rate
• Profit Factor
• Maximum Drawdown
• Net Result
• Total Trades
Two information blocks are available:
• BACKTEST — historical behavior of similar trade conditions
• POSITION — parameters and real-time state of the current trade
Historical data is used to provide analytical context, not to predict future performance.
🔶 Markets & Timeframes
🌍 Compatible with all TradingView markets:
• Crypto
• Forex
• Stocks & ETFs
• Indices
• Commodities
• Futures
⏱ Works on all timeframes — from intraday analysis to long-term charts.
🔶 Intended Use
Strategy Validator is designed for traders who:
• focus on risk-aware decision making
• prefer structured market analysis
• evaluate trades in context rather than isolation
• use statistics as a supporting decision layer
Important Notice
This indicator is an analytical tool and does not guarantee profitability.
It is not a trading robot or an automated execution system.
Past results do not guarantee future outcomes.
Always apply proper risk management.

HXRO Bot Backtest Time HighlightThis script allows you to highlight the HXROBot backtest interval with the possibility of fragmenting the view to better identify the key areas of your strategy
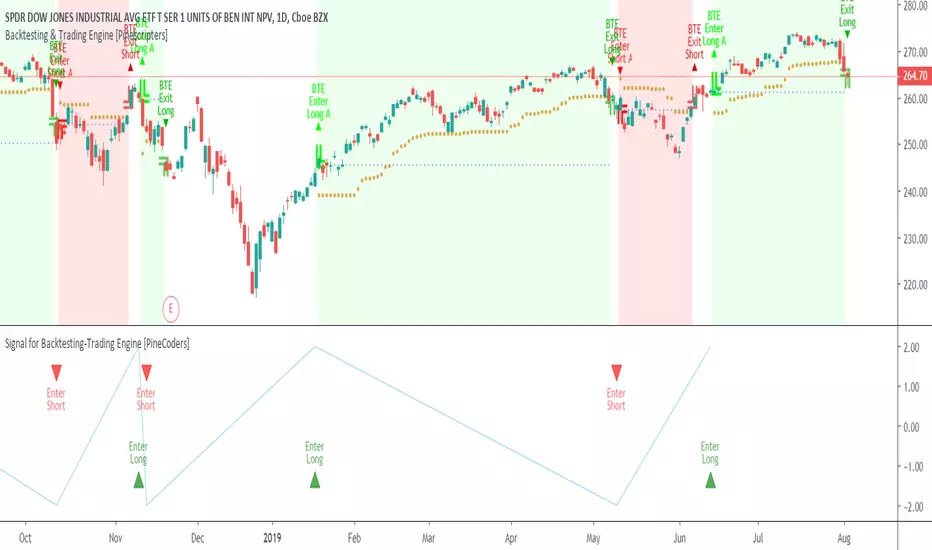
Signal for Backtesting-Trading Engine [PineCoders]This is a companion script to the PineCoders Backtesting-Trading Engine. It illustrates how to build a signal plot in another script, which can in turn be fed in the Engine to provide entry, exit, filter and stop information.
Connection to the Engine is done through its “External Indicator” input field at the very bottom of the Engine’s Settings/Inputs.
The Engine must be operating in study mode to be able to connect an external indicator to it.
The way this script builds the signal is straightforward, as you will see in the code. Two aspects are worth mentioning:
The “FudgeStop()” function used to fudge the stop value by one tick for the rare cases where it will match one of the protocol reserved values, i.e. 1, 2 or 3.
The priority and exclusivity given to the different types of signals in the signal-building “Signal = …” line. No two signals can be sent simultaneously through the signal plot, except for the entry and stop combination.
You can determine in this script’s Settings/Inputs the type of signals that will go through the signal plot.
This script respects the following protocol:
EXTERNAL SIGNAL PROTOCOL
Only one external indicator can be connected to a script; in order to leverage its use to the fullest, the engine provides options to use it as either an entry signal, an entry/exit signal or a filter. When used as an entry signal, you can also use the signal to provide the entry’s stop. Here’s how this works:
For filter state: supply +1 for bull (long entries allowed), -1 for bear (short entries allowed).
For entry signals: supply +2 for long, -2 for short.
For exit signals: supply +3 for exit from long, -3 for exit from short.
To send an entry stop level with an entry signal: Send positive stop level for long entry (e.g. 103.33 to enter a long with a stop at 103.33), negative stop level for short entry (e.g. -103.33 to enter a short with a stop at 103.33). If you use this feature, your indicator will have to check for exact stop levels of 1.0, 2.0 or 3.0 and their negative counterparts, and fudge them with a tick in order to avoid confusion with other signals in the protocol.
Remember that mere generation of the values by your indicator will have no effect until you explicitly allow their use in the appropriate sections of the Engine’s Settings/Inputs.
Look first. Then leap.
Setting XScript Published for a Backtest-Rookies services customer. It has been published only for testing and acceptance. Access cannot be granted.
For community members who are interested in custom development services, please visit the backtest-rookies.com website
CB: CCI & MFI IndicatorCustom Indicator development for a Backtest Rookies professional services customer. Published for customer testing and acceptance.
backtest-rookies.com

Synergy StatsSynergy Stats
This indicator is intended to complement the Synergy indicator. It provides the following statistics:
A percentage showing how often the two assets move in the opposite direction over a given lookback period.
Similarly, another percentage showing how often the two assets move in the same direction over the same lookback period.
Count the number of times (occurrences) when the two assets move in the same direction for more than 4 bars.
Count the number of times the alternative asset moves more than x%
Count the number of times that chart asset moved in the same direction of the alternative asset when the alternative asset moved more than x%
Both indicators were developed for use in an investigation/tutorial using Pine Script to analyse Gold and US Dollar Index correlation.
The full free post can be found here: backtest-rookies.com

SynergySynergy
This indicator was developed for use in an investigation/tutorial using Pine Script to analyse Gold and US Dollar Index correlation.
The first indicator shall measure the percentage change between the open and close of each bar and compare it to the same percentage change of an alternative asset. Additionally, we shall color the background when the two assets move in the same direction. This should allow us to more easily see when the two assets move together and spot trends in their moment.
The yellow bars show use the percentage change in the price of gold. The blue bars show the percentage change in the price of the US Dollar index. If the bar is above zero, it means that the asset closed up. Conversely, if it is below zero, it means the asset closed down. Finally, the grey bars show bars in which the two assets closed in the same direction.
It can be used in conjunction with a second indicator (to be published soon) that provides statistics generated from this indicator.
The full free post can be found here: backtest-rookies.com

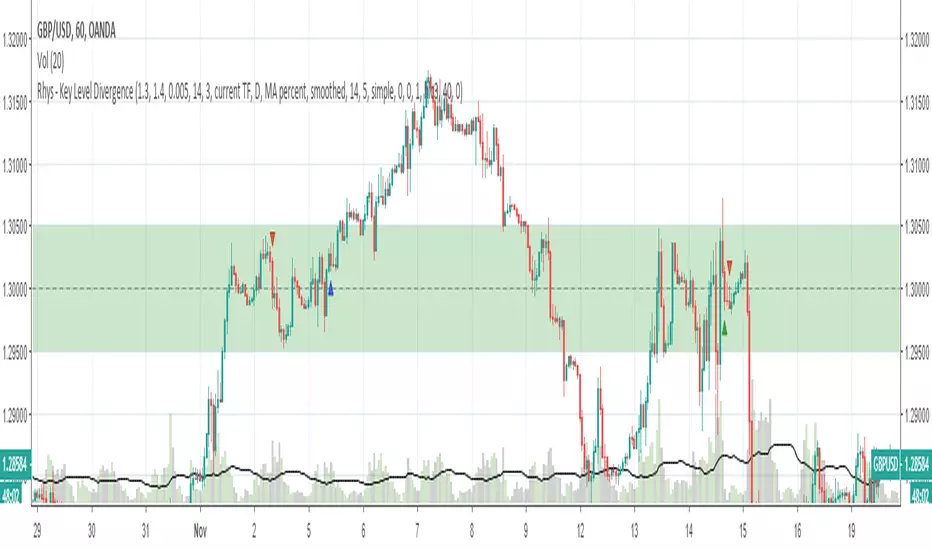
Rhys - Key Level DivergenceThis is a custom script created as part of Backtest Rookies development services. It has been published only for customer acceptance and testing. As such, I cannot grant access to anyone other than the client. Sorry about that.
See the Backtest Rookies profile for open source scripts. Visit our website for free pine-script and algorithmic trading tutorials. For those interested in custom development services, more information can be found on our website.
Key Level Divergence Indicator
A script to detect divergences only at key levels specified by the user.
Features
Select up to 2 key levels
Customize-able buffer zone around the key level
Divergence Detection - Hidden and Regular
Customize-able Pivot detection (for divergences)
Integration of proprietary momentum oscillator.
Alerts when divergences happen in key level zones.
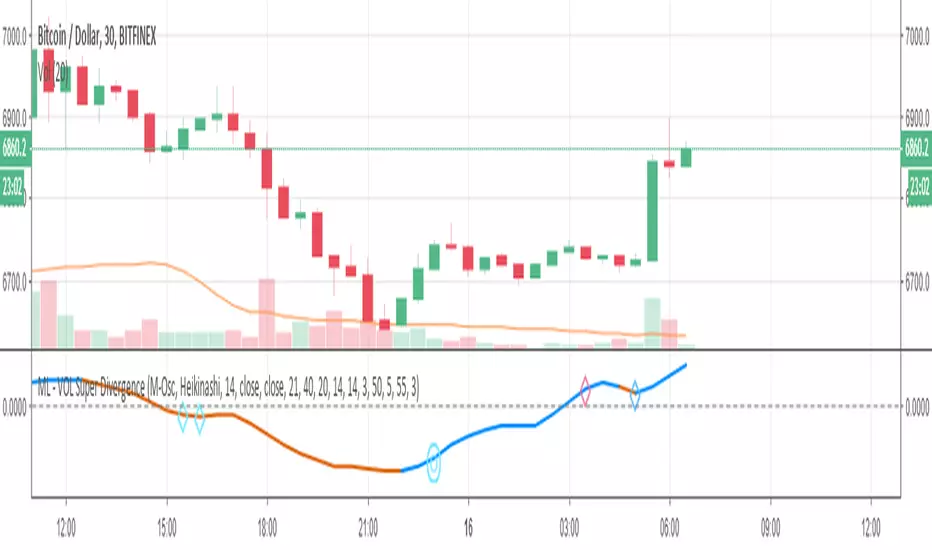
ML - VOLUME Super DivergenceThis script has been published for customer acceptance and verification. Sorry this mean access will only be provided to the customer.
For open source scripts, please take a look at the Backtest-Rookies profile. Users who are interested in custom development services can visit the Backtest-Rookies (.com) website.
VOLUME Super Divergence
A variant of .
All Osclillators have been swapped with Volume based Oscillators.
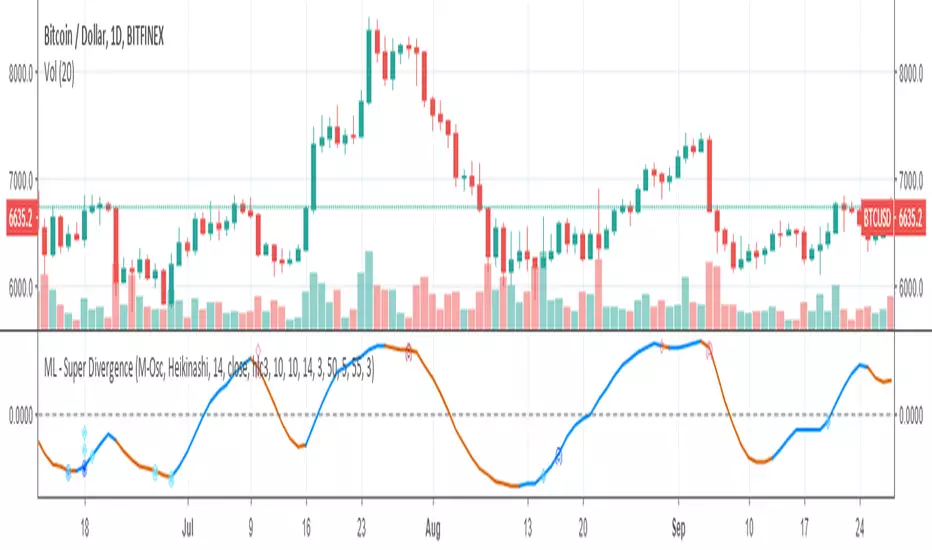
ML - Super DivergenceThis script has been published for customer acceptance and verification. Sorry this mean access will only be provided to the customer.
For open source scripts, please take a look at the Backtest-Rookies profile. Users who are interested in custom development services can visit the Backtest-Rookies (.com) website.
Super Divergence
A super indicator that looks at 4 different oscillators and highlights price to indicator divergences for each of them. It has the following features:
Select which oscillator to plot
Detection of divergences on all 4 indicators irrespective of which indicator is plotted.
Pivot/Swing Detection
Optional Pivot/Swing plotting
Options Signal plotting
Alerts for each divergence
Alex: ConsUD Alert indicatorCustom strategy that was developed for a Backtest-Rookies development service customer. Published for verification, testing and acceptance.
If you are interested in development services send me a message or visit the backtest-rookies (.com) webiste for more information
Consecutive Up/Down Days - Custom Indicator
The indicator builds upon the built-in consecutive up/down days strategy script but with some additional features:
The strategy has been converted to an indicator
Alerts have been added for entries
Position Simulation: Entry signals only happen once per long / short direction.
Plot real high / low candle data (the script is assumed to run on Renko candles)
Plot real simulated entry price at the open of the bar following an entry signal
Plot an EMA

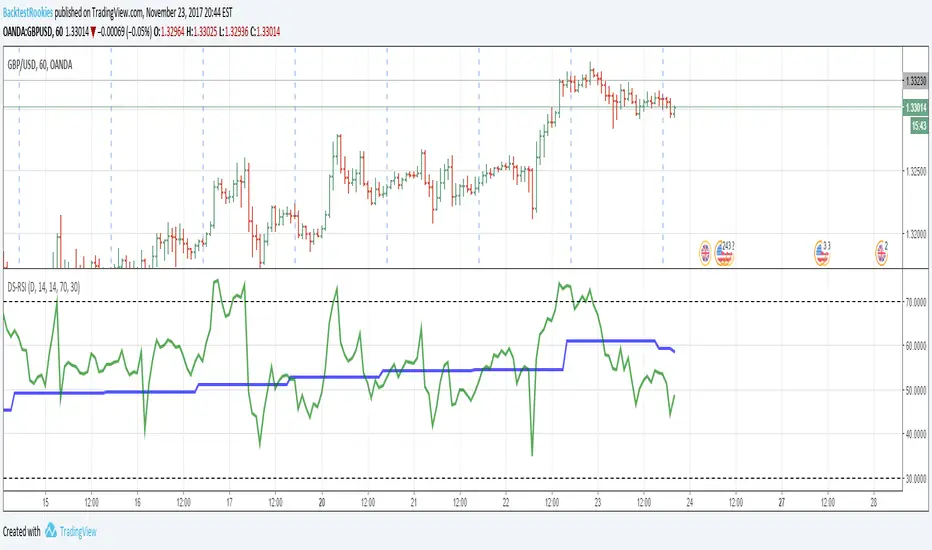
Dual Strength RSIDual Strength RSI Indicator
Republished: The original script violated house rules by including an external link to Backtest Rookies.
Background
This is a simple indicator was designed as part of a tutorial on the Backtest-Rookies website.
Logic
The indicator will plot RSI values from 2 timeframes. The first plotted line will be the current timeframe and the second line will be a user selected timeframe. The theory is that if the instrument is overbought / oversold on two timeframes at the same time, it might be more likely to reverse or revert to the mean.
As with most oscillating indicators, this will likely be most suitable for ranging market conditions.
Examples
Automatic TrendlinesIntroduction
For a full free tutorial explaining this code in more detail, visit the backtest-rookies (.com) website.
This indicator will plot two trend lines at any given time. A resistance trend line and a support trend line. The resistance trend is shown with red circles and is created by joining swing highs together. The second is a support trend which is created by joining swing lows.
Since we need swings to make the trend, the trend line code contains code for the swing detection. You can play around with the swing detection to alter how frequently new trend lines are detected. Relying on swings also means that there will be some delay in trend detection depending on how you configure the swing detection. The higher you set rightbars, the more lag you will have before a trend is detected. However, at the same time the quality of the pivots found will increase. So it is a trade-off you need to come to terms with and decide what the best settings are for you.
Lines
A single trend line is made up of several components.
Pivot Points: Marked as blue or orange circles. There will be two pivots per trend.
Orange/Purple Lines: Connecting all pivot points. You will see these lines change direction slightly each time a new pivot is detected (new circles appear).
Green/Red Circle lines: Showing the trend line from the earliest moment a new trend is detected.
Blue Dashed lines: Joining the purple and green/red circle lines so the full trend line can be seen.
Note: The blue dashed lines use pine-scripts drawing functions. As such, there is a limit to how many of these can be placed on a chart. When the limit is reached, the oldest line will be removed so the newest can be drawn. This means that if you detect enough trends and scroll back in time, the blue dashed lines will disappear at some point!

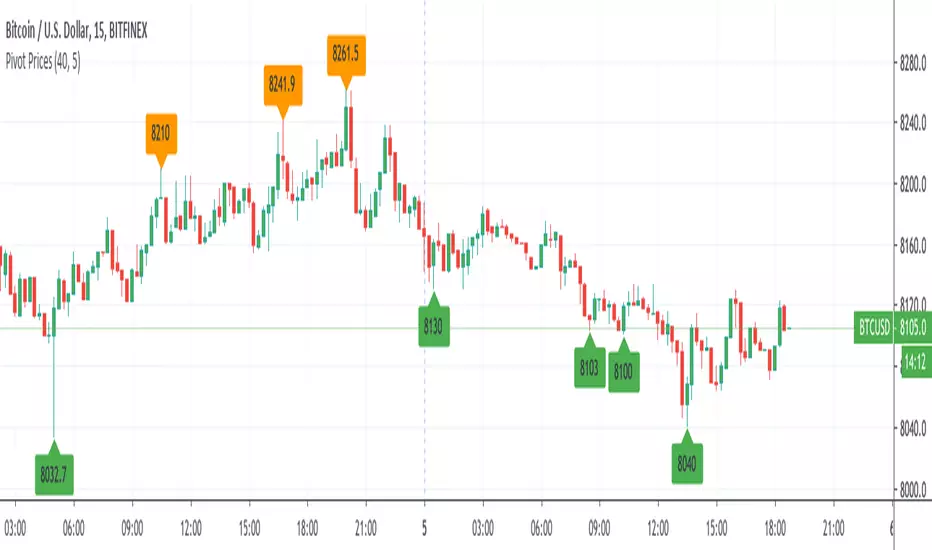
Pivot Prices - ExampleA simple example script showing how to use label.new() to plot pivot prices on the chart.
A full tutorial and commentary is available on the backtest-rookies website.
Volume Profile: Intra-bar VolumeThis indicator was developed as part of a free blog post tutorial on the Backtest-Rookies website for detailed code commentary, head over there.
Scope
The indicator shall attempt to do the following:
Look at a lower time-frame. E.g 5 minutes when on a 1-hour chart.
Create a function to loop through through candles and make an assessment.
If the candle it closed up, the volume will be categorized as buying volume. Conversely, if it closed down, the volume will be categorized as selling volume
The function will then be passed to the security() function to run on a lower timeframe.
All buying volume and selling volume from the lower time-frame shall be summed and displayed on the main chart.
Important Note
This indicator will not give you genuine buying or selling volume. It simply follows the assumption that if price closed up, there must have been more buyers than sellers and if it closed down we assume the opposite.
Usage
In order to use this indicator, users will need to calculate how many lower time-frame bars are contained in the time-frame on the main chart. So for example, the default settings are configured for the indicator to be run on the 1H chart. As a result, we need to set the "Bars on Lower Timeframe" input to 12. This is because there are 12 x 5-minute bars in 60 minutes.

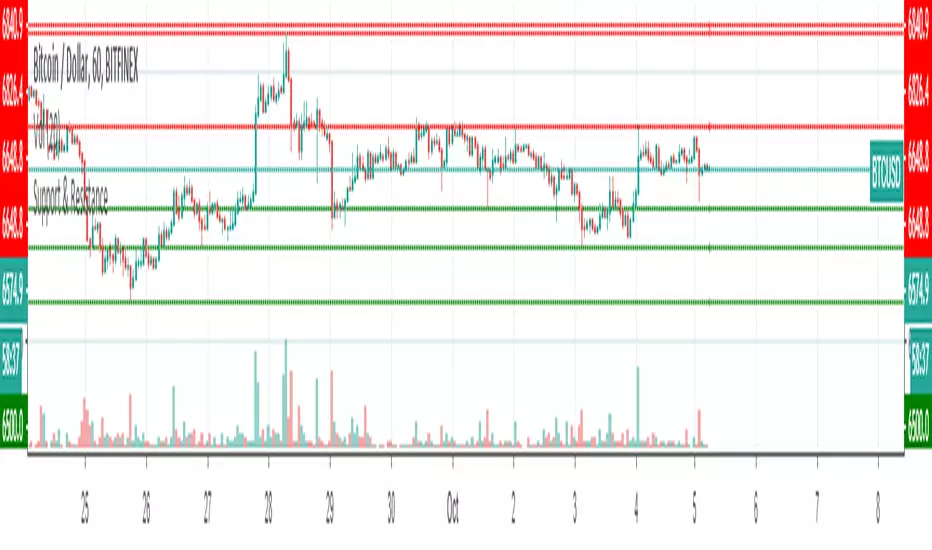
Support & ResistanceThis indicator detects large swings/pivots in historical price action to highlight tops and bottoms which might act as future levels of support or resistance. The code by default detects the last 3 significant swing highs and the last 3 swing lows. It then places lines on the chart to highlight those levels.
For a full overview of the indicator and code commentary visit the backtest-rookies (.com) website.
Example
Dane - MA StudyThis strategy has been developed as a development service. It is published for customer acceptance and verification. As such, I am unable to provide access to anyone other than the paying customer. Sorry about that.
For those interested in development services, please check out the backtest-rookies (.com) website.
MA Study
This is a study version of the Dane - MA Strategy with few extra features:
Position Simulation - So we can synchronise with the strategy.
Alerts for Going Long, Short and exiting positions
Plotting entry/exit and close markers
Plotting dots at the bottom of the chart to show whether we are in a simulated long, short or flat state.

Swing IndicatorThis indicator provides some base code for looping over data to identify swings in price action. Full code commentary can be found on the backtest rookies website.
The indicator shall allow users to "analyse" a recent historical candle to detect whether it was a swing point. This will work by inputting a number to select which historical candle you want to check. The indicator will then check all candles after it until the current candle. It shall also check the same amount of candles before it. If the candle analysed has the lowest low or highest high in the complete range, then we know it was a swing point.

Brandon FractalsCustom Indicator developed for a Backtest-Rookies customer. Published for verification and acceptance
Dual Fractal indicator. Display fractals from an upper timeframe and provide alerts when price breaks above/below the upper timeframe fractal.

Bryan - Multi IndicatorCustom Indicator - Developed for a Backtest-Rookies customer and published for testing and acceptance.
Ichimoku + ADX combined indicator with custom entry criteria and plotting for buy signals.

52 Week High/Low52 Week High / Low Indicator
A simple, unobtrusive indicator that can be used on any timeframe to display the 52 week high/low values.
Features
Works on any timeframe.
Unobtrusive: Simple horizontal lines showing only the current 52 week values.
Allows the user to select whether to calculate the 52-week values from candle close values or the respective highs/lows.
For full overview and code commentary - Visit the backtest-rookies website.

CB SDB HK VOL IndicatorIndicator version of designed for use with independent automation solution.
Custom development published for customer verification and acceptance.
If you are interested in development services, please visit the backtest-rookies website or message me to find out more.
