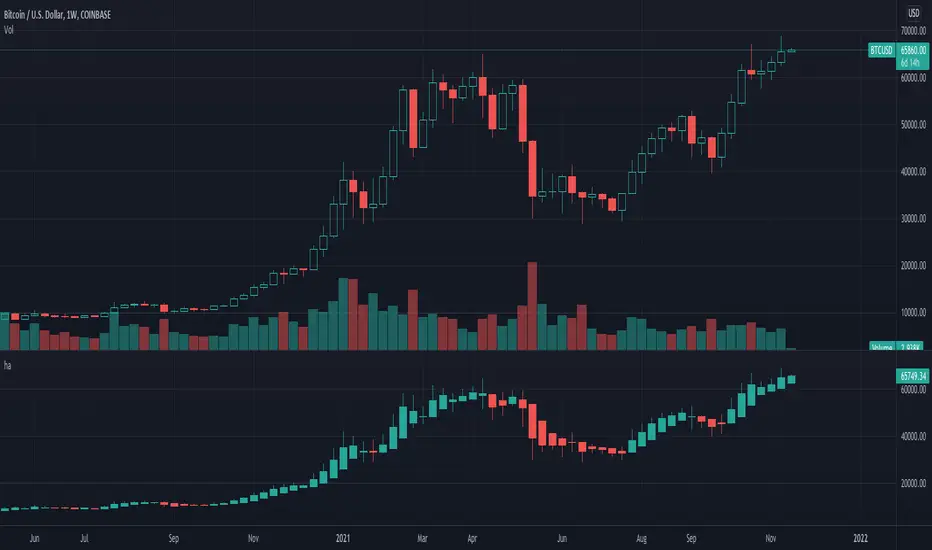
Heiken-Ashi CandlesSimple script to view Heiken-Ashi candles below a normal candles chart.
Could also be useful for using HA calcs in strategy scripts on normal candles chart for proper backtesting.
I adapted this to v4 from original v2 script by @samtsui. If you like please remember to give him a Thumbs Up for his original version! ->
Search in scripts for "backtesting"
Golden Cross by -Westy-Quick Guide
- Yellow cross and green MA on top = Potential uptrend
- Yellow cross and red MA on top = Potential downtrend
A simple golden cross indicator of the green 50 and red 200 SMA with a yellow cross for ease of visibility and backtesting.
Generally, longer time frames more powerful signals but are less frequent. I typically use it on the 4 hour, daily and weekly.

Complete turtles strategy based on the donchian channelsDear Traders and investor,
I want to demonstrate scrypt of the iconic "trend following strategy" coded by my
The main idea was borrowed from the book "Way of the Turtle: The Secret Methods that Turned Ordinary People into Legendary". The strategy is based on the donchian channels and is one of the oldest and easiest strategy in the using. Also strategy include risk managment and trends filter which prevent false entries and high drawndowns. The results are based on the period from 2006 to present, but you can also change timeframe and period of backtesting.
Best regards,
Vlad

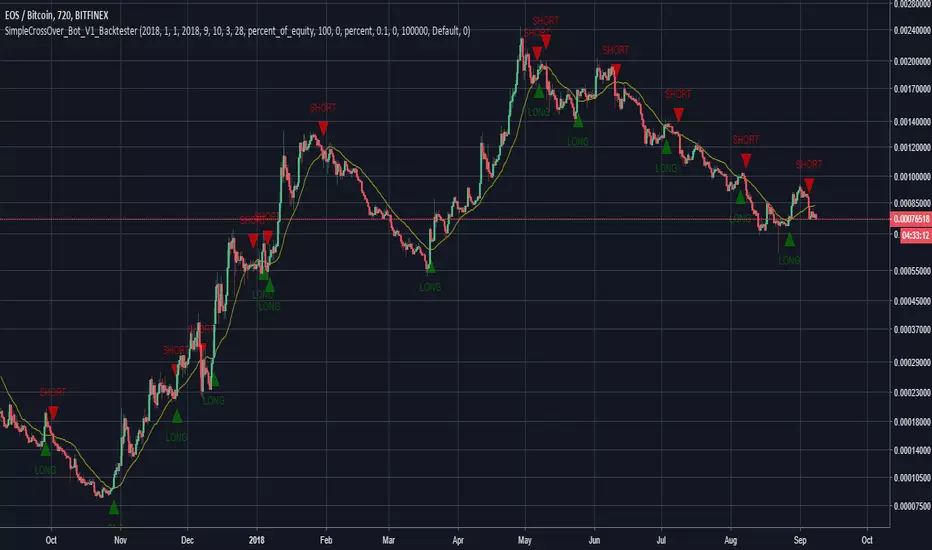
SimpleCrossOver_BotThis is a simple example of how you can compile your own strategy
This script contains the code for alerts and for backtesting.
In order to use the backtester, comment out the sections to be used for signals, and comment in the sections to be used on the back tester, and visa versa for using the script for alerts in order to automate your own bot.
Awesome Oscillator.MMouse_Lager_BCEAwesome Oscillator with added options for turning short trades on and off, as well as a start date for backtesting.

Pivot Reversal Strategy - TimeFramedThis is Pivot Reversal Strategy including the time frames for backtesting.

3 Duck's Trading System from Babypips.comThe 3 Duck's Trading System from Babypips.com
The 3 Duck's Trading System is the most popular and active trading system thread on the the babypips.com forum. It is a system that is mainly for beginners because it teaches you discipline, learning to cope with price moving against your position and learning to stay in a trade and keep profits running. For the thread and more info on the 3 Duck's Trading System click here
How does it work?
The system is a very simple enter/exit based on the 60 SMA of 3 different time frames: 4 hour, 1 hour and 5 minute.
The Rules, er, the Ducks! The Ducks must all be in a row for a trade to take place!
Duck 1 - To go long, price must be above the 60 SMA on the 4 hour chart.
Duck 2 - To go long, price must be above the 60 SMA on the 1 hour chart.
Duck 3 - To go long, price must cross above the 60 SMA on the 5 minute chart and the 60 SMA of the 5 minute chart must be below that of the 4 hour and 1 hour chart. (obviously the reverse for shorting)
YOU MUST USE THIS SYSTEM ONLY ON THE 5 MINUTE CHART.
I say this because I have already charted all of the Ducks into the 5 minute chart so you don't have to flip back and forth.
I have also added some inputs for profit targets, stop targets, trailing stops and times to trade for backtesting.
If you have any questions or comments, please let me know! If you see I messed up on something, please let me know!
Also a VERY special thanks to the babypips.com user Captain_Currency . He wrote this strategy 10 years ago (2007 was 10 years ago?!) and he is still active on the thread and posting results and offering help!

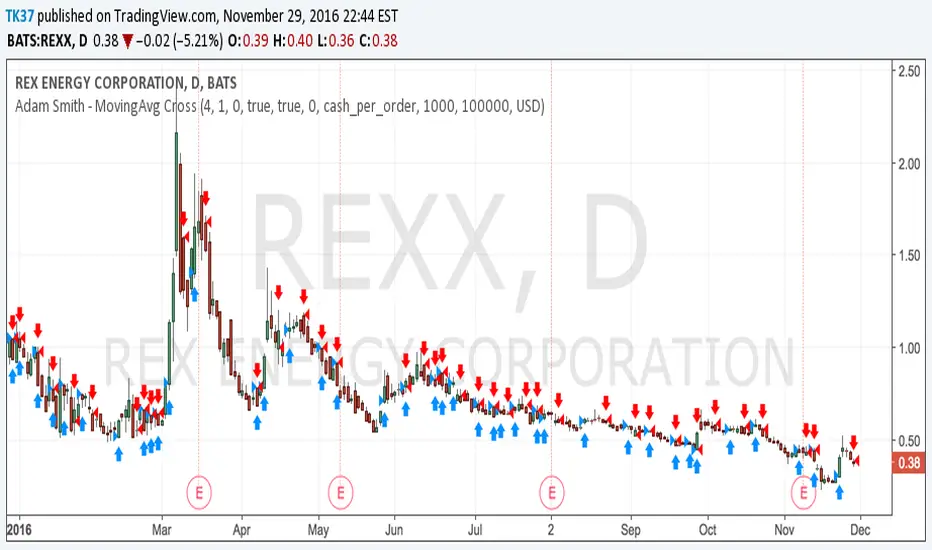
Adam Smith - MovingAvg CrossSimple Moving Average Cross script. Test on stocks and currency. For stocks test shorter time periods, meaning intra-day time periods such as 3min to 30min and so on to fit what is best. For currency, try longer periods with this model such as day to weeks depending on which currency.
NOTE: Take a look at your Max Drawdowns when testing. This will be the main indicator once you figure out your time period for backtesting. This will also let you know how much money to save and/or hold back in savings for down periods.
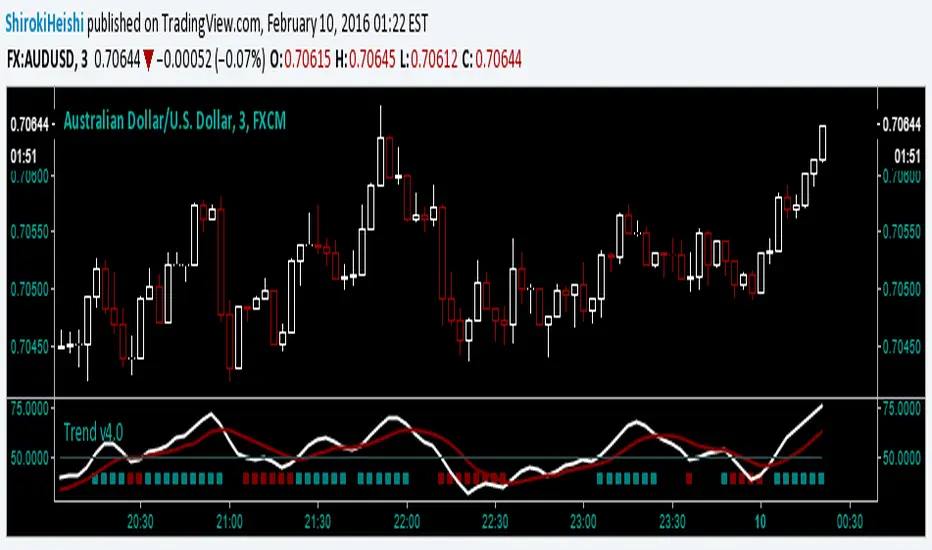
Trend v4.0 Another updateYet another update, default settings can be customized to your needs. Be aware that while this is similar to the other versions, this can only repaint an active bar, but that slows it down by one period. You are warned. Be that as it may, the basic idea is the same; trying to capture the really strong moves into overbought or oversold territory as defined by Relative Strength index. In RSI mode, you can see the smoothing has slowed it down a bit, but warrants backtesting.
First green bar go long, First red bar go short, first white bar possible trend exhaustion. Or use crossovers and such, play with the inputs OB/OS, RSI length, signal length, tick length, swing length, as I said customize to your tastes. I offer no surety as to its efficacy, but we all learn.
Trade Responsibly,
Shiroki
eBacktesting - Learning: RSI DivergenceseBacktesting - Learning: RSI Divergences is meant to train your eye to spot when a trend is losing momentum before price fully turns.
How to study it (step-by-step)
1. Start with the trend
- First decide if price is generally trending up or down (higher highs / higher lows vs lower highs / lower lows).
- Divergences matter most after a trend has been running for a while.
2. Look for the “mismatch”
- Bearish divergence: price prints higher highs, but RSI prints lower highs.
- This often shows up near the end of a strong bullish run, when buyers are still pushing price up but with less momentum.
- Bullish divergence: price prints lower lows, but RSI prints higher lows.
- This can show up near the end of a bearish move, when selling pressure is fading.
3. Treat divergence as a warning, not an entry
- The key lesson: divergence often signals trend weakness, not an instant reversal.
- After a divergence appears, study what happens next: stalling, ranging, a pullback, or a full reversal.
4. Add simple confirmation
- Practice waiting for something obvious after the divergence:
a break of a small support/resistance level,
a shift in swing structure,
or a clear rejection candle from a key area.
- This helps you avoid taking every divergence as a trade signal.
5. Use it inside eBacktesting (best practice)
- Replay the chart and pause on each divergence mark.
- Log:
Where it happened (after a long run or in the middle of chop?),
Whether price stalled first or reversed immediately,
What confirmation appeared (if any),
The best “invalidation” idea (what would prove you wrong?).
- Over time you’ll see which divergences are meaningful for your market and session, and which ones are noise.
These indicators are built to pair perfectly with the eBacktesting extension, where traders can practice these concepts step-by-step. Backtesting concepts visually like this is one of the fastest ways to learn, build confidence, and improve trading performance.
Educational use only. Not financial advice.

eBacktesting - Learning: Power of 3eBacktesting - Learning: Power of 3 highlights ICT’s “Power of 3” intraday story:
- Accumulation: price builds a quiet range
- Manipulation: a sweep grabs liquidity above or below that range (the classic stop hunt)
- Distribution: the real move expands away from that range, often in the opposite direction of the sweep
Use it to train your eyes to recognize when price is likely “setting up” vs when the session is actually “moving,” and to build a clean daily narrative around liquidity and expansion.
These indicators are built to pair perfectly with the eBacktesting extension, where traders can practice these concepts step-by-step. Backtesting concepts visually like this is one of the fastest ways to learn, build confidence, and improve trading performance.
Educational use only. Not financial advice.

eBacktesting - Learning: Liquidity GrabseBacktesting - Learning: Liquidity Grabs highlights moments when price pushes just beyond a recent swing high or swing low (where many stops tend to sit) and then quickly returns back inside the level. This behavior is often called a stop run, sweep, or liquidity grab.
Traders study these events because they can reveal:
- Where liquidity is “resting” (obvious highs/lows)
- A quick sweep and rejection (often a wick)
- When a breakout attempt is actually a trap
- A full candle close through the level, followed by an immediate reversal back inside (classic breakout trap)
- Potential areas where price may reverse or accelerate after stops are taken
Use it as a training tool to build pattern recognition and improve your patience around key levels, especially during active sessions where sweeps happen frequently.
These indicators are built to pair perfectly with the eBacktesting extension, where traders can practice these concepts step-by-step. Backtesting concepts visually like this is one of the fastest ways to learn, build confidence, and improve trading performance.
Educational use only. Not financial advice.

eBacktesting - Learning: Buy/Sell-side LiquidityeBacktesting - Learning: Buy/Sell-side Liquidity
Buy-side and sell-side liquidity are some of the most important “magnets” in day trading. When price forms obvious swing highs and swing lows, stop-loss orders often build up just above those highs (buy-side liquidity) and just below those lows (sell-side liquidity). Markets frequently move into these areas to “take” that liquidity before making the next meaningful move.
This indicator helps you spot those potential liquidity pools and highlights when price reaches them. Use it to study:
- where stops are likely resting above highs / below lows
- how often price sweeps those areas before reversing
- how liquidity runs can trigger the next expansion or trend continuation
These indicators are built to pair perfectly with the eBacktesting extension, where traders can practice these concepts step-by-step. Backtesting concepts visually like this is one of the fastest ways to learn, build confidence, and improve trading performance.
Educational use only. Not financial advice.

eBacktesting - Learning: Cup & HandleeBacktesting - Learning: Cup & Handle
The Cup & Handle is a classic continuation pattern that often appears during strong trends. It shows a market that “cools off” (the cup), then does a smaller pullback (the handle), and may be ready for another push in the original direction.
This indicator helps you spot:
- Potential Cup & Handle formations as they develop
- When a handle forms (the final “pause” before continuation)
- The breakout moment, when price pushes above the rim level
It’s designed to support structured practice: you can replay charts and train your eyes to recognize the pattern, understand the context around it, and build consistent execution rules.
These indicators are built to pair perfectly with the eBacktesting extension, where traders can practice these concepts step-by-step. Backtesting concepts visually like this is one of the fastest ways to learn, build confidence, and improve trading performance.
Educational use only. Not financial advice.

eBacktesting - Learning: Head & ShoulderseBacktesting - Learning: Head & Shoulders
Head & Shoulders is one of the most recognizable reversal patterns in day trading. It helps you spot moments when a trend may be losing strength and a turn becomes more likely—often around a “neckline” level where the market either breaks and continues the reversal, or holds and keeps trending.
This indicator highlights both:
- Head & Shoulders (bearish): potential shift from bullish strength to bearish reversal
- Inverse Head & Shoulders (bullish): potential shift from bearish strength to bullish reversal
It marks the structure on the chart (left shoulder, head, right shoulder) and flags the moment the pattern is confirmed, so you can practice reading the story behind price action instead of guessing.
These indicators are built to pair perfectly with the eBacktesting extension, where traders can practice these concepts step-by-step. Backtesting concepts visually like this is one of the fastest ways to learn, build confidence, and improve trading performance.
Educational use only. Not financial advice.

Trend Cloud with Buy/Sell Text [wjdtks255]Indicator Title: Trend Cloud with Buy/Sell Signal Pro
Short Description
A high-probability trend-following indicator based on Supertrend dynamics, enhanced with a Volume Filter to pinpoint explosive entries while minimizing false breakouts.
Detailed Description (Overview)
The Trend Cloud with Buy/Sell Text is designed for traders who prioritize clarity and momentum. It visualizes market trends through a "Trend Cloud" system and generates real-time BUY/SELL signals only when price action is backed by significant trading volume.
Key Technical Pillars
Dynamic Trend Cloud: Fills the area between the price and the Supertrend line, providing immediate visual feedback on trend strength and potential support/resistance zones.
Smart Volume Filter: A unique logic that compares current volume against a 20-period moving average. Labels only appear when a trend shift occurs with above-average volume, filtering out weak "fakeouts."
No-Repaint Labels: Signals are calculated and fixed at the close of the candle, ensuring that the BUY/SELL text remains permanent for reliable historical backtesting and live execution.
The Alpha Hunter Strategy (How to Trade)
1. Long Entry (Buy)
Condition: The cloud turns Aqua and a "BUY" label appears below the candle.
Confirmation: Ensure the price remains above the Aqua Trend Line.
Volume Check: The indicator automatically verifies if the volume is higher than the 20-period average before displaying the label.
Exit: Exit when a "SELL" signal appears or the price closes below the Aqua line.
2. Short Entry (Sell)
Condition: The cloud turns Red and a "SELL" label appears above the candle.
Confirmation: Price should stay below the Red Trend Line.
Exit: Exit when a "BUY" signal appears or the price closes above the Red line.
Input Parameters & Optimization
ATR Period (Default: 10): Determines the sensitivity to price volatility.
ATR Factor (Default: 3.0): Controls the distance of the trend line. Increase to 3.5 - 4.0 to reduce noise in choppy markets.
Volume Filter (Toggle): When enabled, only high-momentum signals are shown.
Recommended Usage
Best Timeframes: 15m, 1h, 4h.
Asset Classes: Highly effective for Crypto (BTC/ETH) and high-volume stocks.

eBacktesting - Learning: Equal Highs & LowseBacktesting - Learning: Equal Highs & Lows helps you spot Equal Highs (EQH) and Equal Lows (EQL) — price areas where the market has paused or reacted multiple times at nearly the same level.
These zones often act like “magnets” because many traders place stops and pending orders around them. When price returns, it can lead to a quick grab (a sweep) and reversal, or it can break through and continue. Learning to recognize EQH/EQL can improve your timing, help you anticipate where volatility may appear, and give you clearer areas for invalidation and targets.
These indicators are built to pair perfectly with the eBacktesting extension, where traders can practice these concepts step-by-step. Backtesting concepts visually like this is one of the fastest ways to learn, build confidence, and improve trading performance.
Educational use only. Not financial advice.

eBacktesting - Learning: Fibonacci RetracementeBacktesting - Learning: Fibonacci Retracement helps you practice one of the most common “pullback” tools in trading: Fibonacci retracements.
It automatically finds the most recent swing and draws your chosen Fibonacci levels (for example 0.382, 0.5, 0.618, 0.786) so you can clearly see where price is pulling back into “discount/premium” areas. When price taps a level (or the Golden Zone), the indicator marks it so you can review what happened next and build pattern recognition.
These indicators are built to pair perfectly with the eBacktesting extension, where traders can practice these concepts step-by-step. Backtesting concepts visually like this is one of the fastest ways to learn, build confidence, and improve trading performance.
Educational use only. Not financial advice.

eBacktesting - Learning: Trend LineseBacktesting - Learning: Trend Lines helps you spot clean trend lines automatically, using real swing points (highs/lows) and confirming a line only after it’s “respected” multiple times.
What you’ll see on the chart
- Uptrend lines (support) when price is making higher lows
- Downtrend lines (resistance) when price is making lower highs
- A simple way to study structure, spot “respect” of a trend line, and understand when a trend may be weakening
- Trend line breaks are based on candle closes, not just quick wicks, so the signals are clearer
You can also keep a few older lines on the chart, making it easy to review past reactions and build pattern recognition.
These indicators are built to pair perfectly with the eBacktesting extension, where traders can practice these concepts step-by-step. Backtesting concepts visually like this is one of the fastest ways to learn, build confidence, and improve trading performance.
Educational use only. Not financial advice.

eBacktesting - Learning: Support & ResistanceeBacktesting - Learning: Support & Resistance helps you spot the price levels where the market repeatedly reacts, bounces, or rejects — the classic “floors” (support) and “ceilings” (resistance) that many day traders use to plan entries, stops, and targets.
This indicator automatically marks historical support and resistance levels right where they formed, so you can scroll back and study how price respected (or broke) those zones over time. It also highlights important moments when a level is broken, showing you how a broken resistance can later act like support (and vice-versa).
These indicators are built to pair perfectly with the eBacktesting extension, where traders can practice these concepts step-by-step. Backtesting concepts visually like this is one of the fastest ways to learn, build confidence, and improve trading performance.
Educational use only. Not financial advice.

eBacktesting - Learning: Change of CharactereBacktesting - Learning: Change of Character helps you spot a “Change of Character” (CHoCH) — the moment price stops behaving one way and starts behaving the other.
It does this by tracking clear swing highs and swing lows, then marking the first **candle close** that breaks structure **against** the current move:
- Bullish CHoCH: price shifts from making lower structure to breaking above a key swing high.
- Bearish CHoCH: price shifts from making higher structure to breaking below a key swing low.
Use CHoCH to practice timing: early trend shifts, reversals, and potential new legs — especially when combined with your usual confluence (liquidity, premium/discount, key levels, sessions, etc.).
These indicators are built to pair perfectly with the eBacktesting extension, where traders can practice these concepts step-by-step. Backtesting concepts visually like this is one of the fastest ways to learn, build confidence, and improve trading performance.
Educational use only. Not financial advice.

eBacktesting - Learning: Order BlockseBacktesting – Learning: Order Blocks helps you spot Order Blocks on your chart in a clean, beginner-friendly way.
When price breaks structure, the indicator highlights the last opposite candle that often becomes a key reaction zone later (the Order Block). You’ll see the OB marked as a zone, and when price comes back and mitigates it (returns into the zone), that OB is removed so your chart stays uncluttered and focused on what matters now.
This indicator is built to pair perfectly with the eBacktesting extension, where traders can practice these concepts step-by-step. Backtesting concepts visually like this is one of the fastest ways to learn, build confidence, and improve trading performance.
Educational use only. Not financial advice.

eBacktesting - Learning: BreakoutseBacktesting - Learning: Breakouts highlights ranges & breakout behaviors in a clean, visual way.
It automatically:
- Detects consolidation ranges (tight price action) and draws a range box
- Marks a breakout only when a candle CLOSES outside the range (no wick-only breakouts)
Adds a label on the breakout candle (↑ bullish breakout / ↓ bearish breakout)
These indicators are built to pair perfectly with the eBacktesting extension, where traders can practice these concepts step-by-step. Backtesting concepts visually like this is one of the fastest ways to learn, build confidence, and improve trading performance.
Educational use only. Not financial advice.
