Search in scripts for "band"

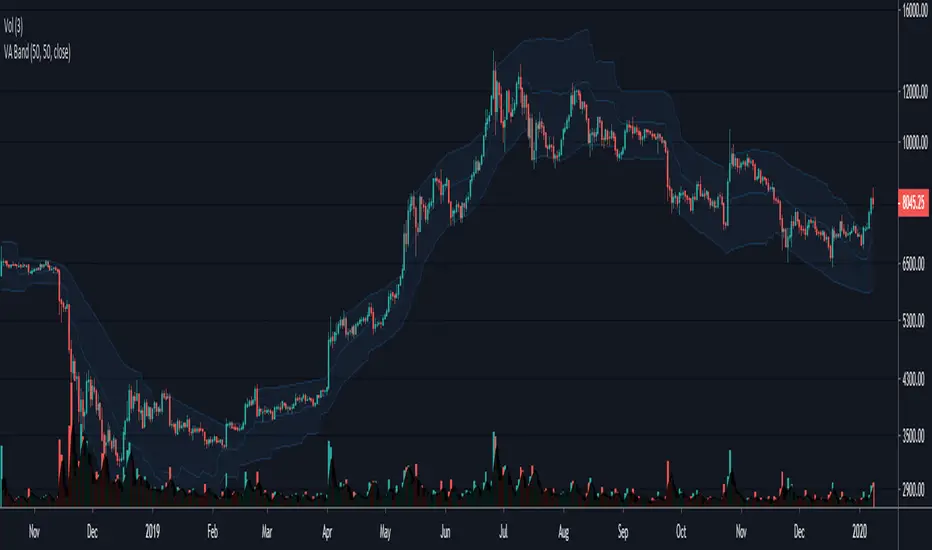
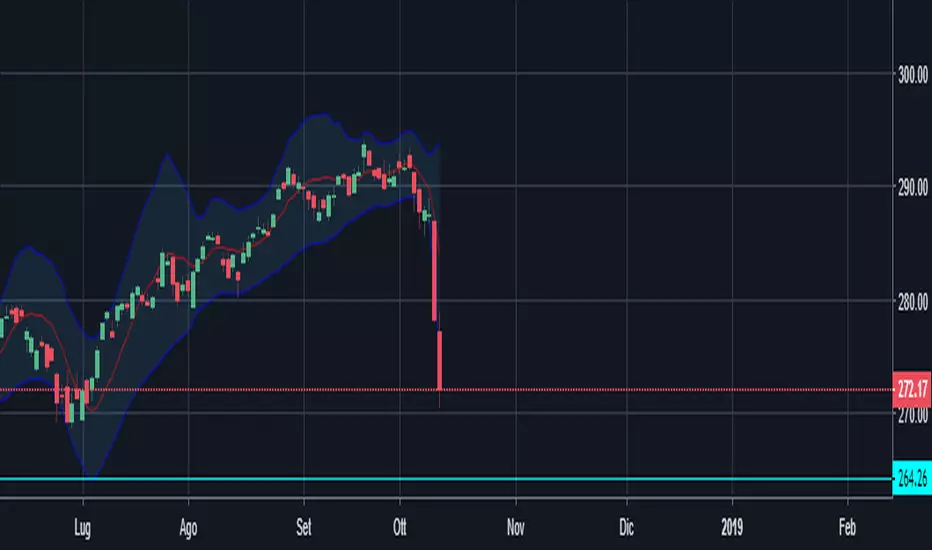
Volatility Adjusted Bands - JD This indicator gives a likely trading range based on the volatility of the past x amount of bars, measured against a certain moving average.
The indicator can be used as an alternative for BBands.
It gives approx. the same "trend-side" lines (upper line in uptrend, lower line in down trend) as the Bollinger Bands, but the opposite line follows closer on price,
Instead of "flying out" to the other direction like in BBands.
As a comparison, the BBands for the same length (50 period) are added on the chart.
JD.
#NotTradingAdvice #DYOR
I build these indicators for myself and provide them open source, to use for free to use and improve upon,
as I believe the best way to learn is toghether.


Bollinger Bands MTF [LonesomeTheBlue]With this script you can follow Bollinger Bands for current and higher time frame together. Higher time frame is calculated by script.
if current period
1m => higher period=5m
3m => higher period=5m
5m => higher period=15m
15m => higher period=1h
30m => higher period=1h
45m => higher period=1h
1h => higher period=4h
2h => higher period=4h
3h => higher period=4h
4h => higher period=1day
1day => higher period=1week

Trend Trader Bands Strategy This is plots the indicator developed by Andrew Abraham
in the Trading the Trend article of TASC September 1998
It was modified, result values wass averages.
And draw two bands above and below TT line.

Percentage BandsA different version of bollinger bands, I use percentage difference instead of standard deviation.

Trend Trader Bands This is plots the indicator developed by Andrew Abraham
in the Trading the Trend article of TASC September 1998
It was modified, result values wass averages.
And draw two bands above and below TT line.

Standard Error Bandswith the best settings - this indicator is a better version of the bollinger bands, because it uses a linear regression .
Use this carefully and with other indicators.
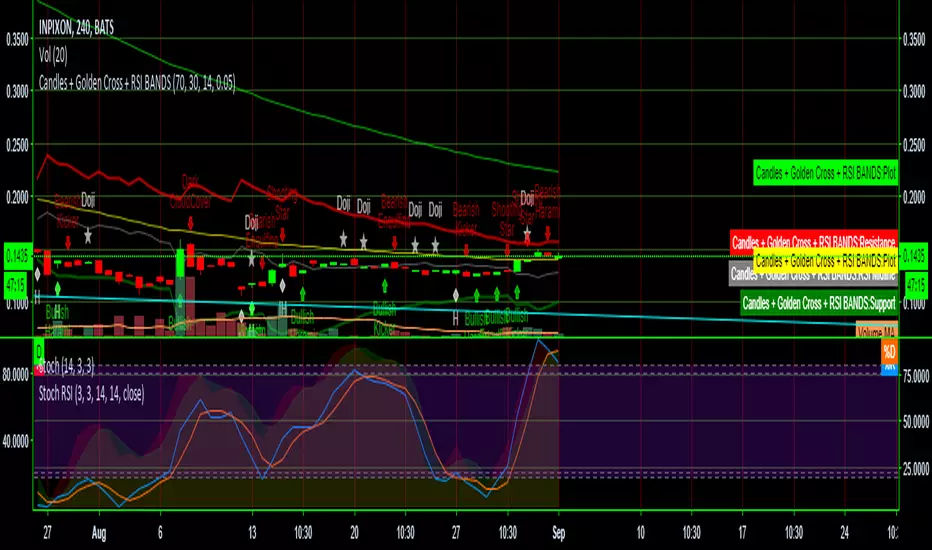
Candles + Golden Cross + RSI BANDSThis script combines three scripts for ease of use
RSI Bands LazyBear
Golden Cross MichMexTrading
Candlestick patterns identified repo32
I combined them because they work exceptionally well together in identifying reversals and other potential changes
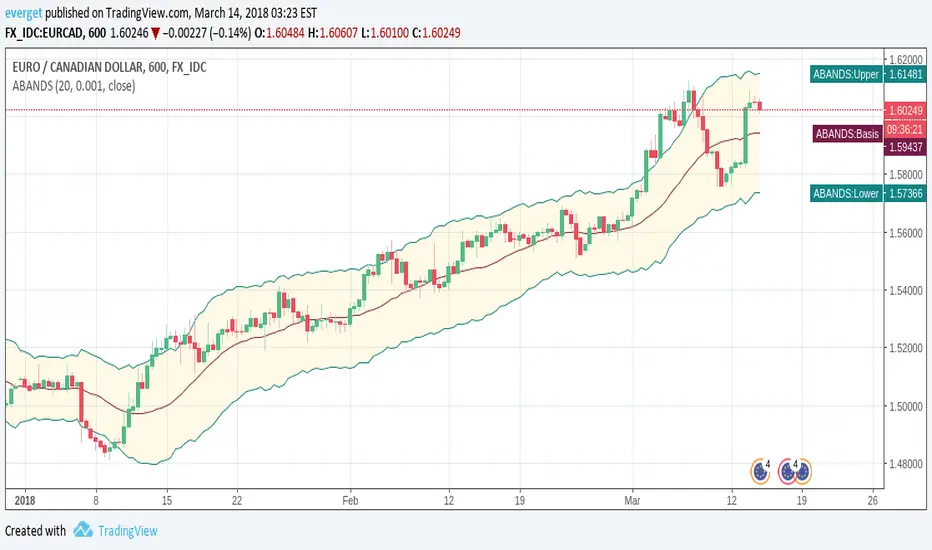
Acceleration BandsAcceleration Bands indicator script. This indicator was originally developed by Price Headley.
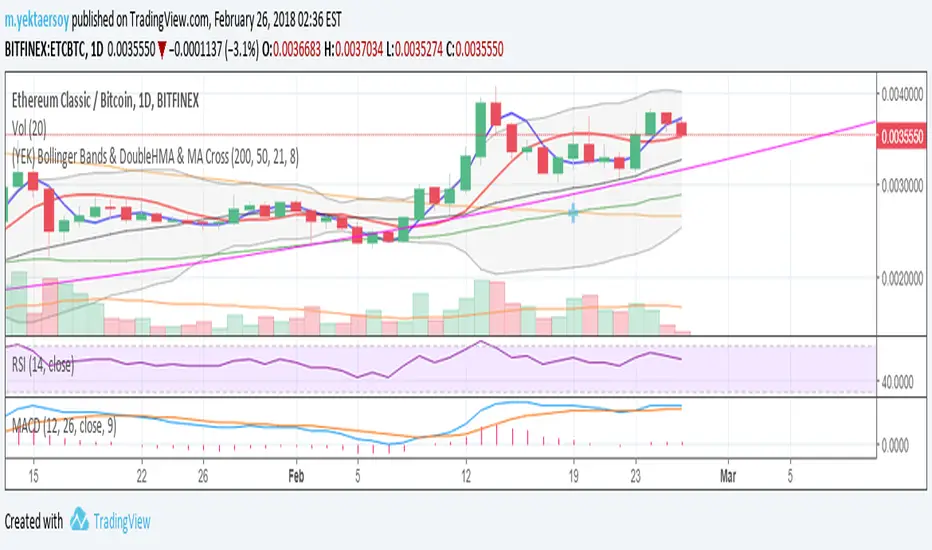
(YEK) Bollinger Bands & DoubleHMA & MA CrossMy favorite indicators ALL-IN-1: Bollinger Bands, Double Hull Moving Average (21,8), Double Moving Average (200,50)
Volume Weighted Average Range Bands [DW]This is an experimental study designed to identify the underlying trend bias and volatility of an instrument over any custom interval TradingView supports.
First, reset points are established at points where the opening price of the interval changes.
Next, Volume Weighted Average Price (VWAP) is calculated. It is the cumulative sum of typical price times volume divided by the cumulative volume. The cumulation starts over upon each reset point.
After that, Volume Weighted Average Range (VWAR) is calculated. The formula structure is the same as VWAP, except using range rather than typical price.
Lastly, the bands are calculated by multiplying the VWAR by the specified multiplier (approximate Golden Ratio by default) and by 1 through 5, then adding to and subtracting from the VWAP.
Custom Bar Colors are included.

Fractal Chaos Bands Backtest The FCB indicator looks back in time depending on the number of time periods trader selected
to plot the indicator. The upper fractal line is made by plotting stock price highs and the
lower fractal line is made by plotting stock price lows. Essentially, the Fractal Chaos Bands
show an overall panorama of the price movement, as they filter out the insignificant fluctuations
of the stock price.
You can change long to short in the Input Settings
WARNING:
- For purpose educate only
- This script to change bars colors.

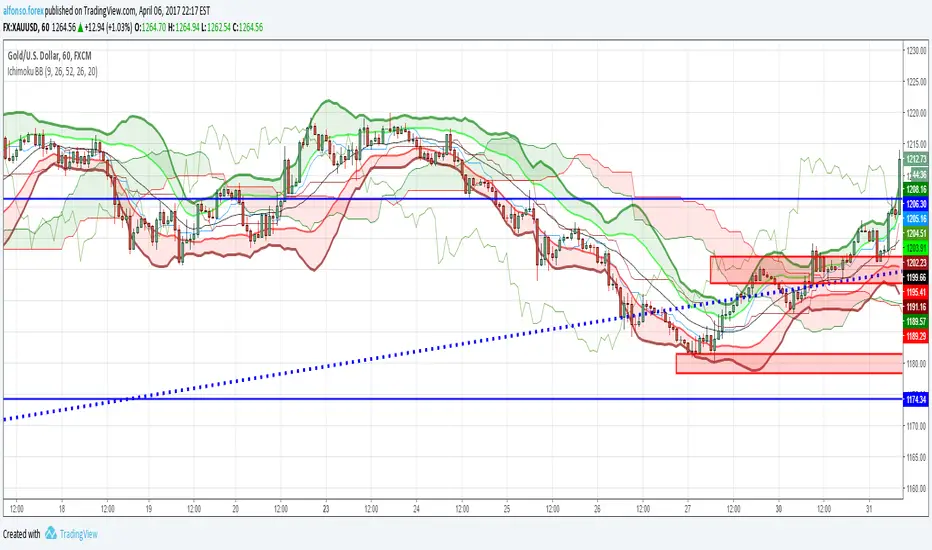
Ichimoku And DD Bollinger BandsIchimoku System Plus Double Bolliner Bands
Made in Mexico City with Love.
Kaufman's Adaptive Moving Average BandsKaufman's Adaptive Moving Average with 6 Bands at a time and trend direction.

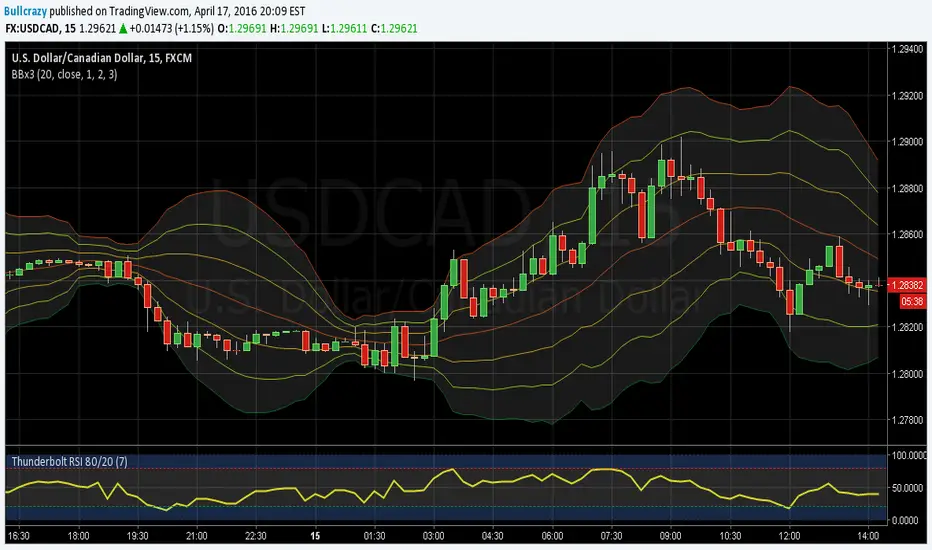
Triple Bollinger BandsI found myself using multiple bollinger bands a lot so I decided to add them all to one script and add the ability to adjust them by 0.2. It has helped me by not taking up as much space in the upper left corner as well as improving my in's and outs of trend continuation trades. If you manage to find a double top at +2 or greater deviation, and with a bearish divergence on the RSI as shown in this picture, GO SHORT SON! This was a fast and easy 35 - 40 pips and if you used your fibonacci for an exit you had little doubt of the final result and could have even been prepared for an immediate reversal knowing you were then at an oversold -2.8 deviation. I could go on and on........
Stochastic In BandsWhat about to display Stochastic Oscilator in EMA-ATR Bands? If you like the idea I would code advanced version