Market Pressure Differential (MPD) [SharpStrat]Market Pressure Differential (MPD)
Concept & Purpose
The Market Pressure Differential (MPD) is a proprietary indicator designed to measure the internal balance of buying and selling pressure directly on the price chart.
Unlike standard momentum or trend indicators, MPD analyzes the structural behavior of each candle—its body, wicks, and overall range—to determine whether the market is dominated by expansion (buying aggression) or contraction (selling absorption).
This indicator provides a visual overlay of market pressure that adapts dynamically to volatility, helping traders see real-time shifts in participation intensity without using oscillators.
In simple terms:
When MPD expands upward → buyer pressure dominates.
When MPD contracts downward → seller pressure dominates.
Calculation Overview
MPD uses a structural candle formula to compute directional pressure:
Body Ratio = (Close − Open) / (High − Low)
Wick Differential = (Lower Wick − Upper Wick) / (High − Low)
Raw Pressure = (Body Ratio × Body Weight) + (Wick Differential × Wick Weight)
Then it applies:
EMA smoothing (to stabilize short-term noise)
Standard deviation normalization (to maintain consistent scaling)
ATR projection (to adapt the signal visually to volatility)
This produces the MPD projection line and the pressure ribbon, drawn directly on the main chart.
Customizable Inputs
Users can adjust color schemes, EMA smoothing length, ATR parameters, normalization length, and body/wick weighting to adapt the indicator’s sensitivity and aesthetic to different markets or chart themes.
How to Use
The Market Pressure Differential (MPD) visualizes the real-time balance between buying and selling pressure. It should be used as a contextual bias tool, not a standalone signal generator.
The white line represents the MPD projection, showing how market pressure evolves in real time based on candle structure and volatility.
The red line represents the ATR envelope, which defines the market’s expected volatility range.
MPD reacts quickly to candle structure, so trend bias is based on how its projection behaves relative to the ATR envelope:
Above the ATR band → positive pressure and bullish bias.
Below the ATR band → negative pressure and bearish bias.
Hovering near the ATR band → neutral or indecisive conditions.
The MPD percentage in the label represents the normalized strength of pressure relative to recent volatility.
Positive % = buying dominance.
Negative % = selling dominance.
Higher absolute values = stronger momentum compared to volatility.
To trade with MPD:
Watch candle colors and the projection line — green or positive % shows buyer control, red or negative % shows seller control.
Note transitions above or below the ATR level for early signs of momentum shifts.
Combine MPD signals with price structure, key levels, or volume for confirmation.
This helps reveal which side controls the market and whether that pressure is strong enough to overcome typical volatility.
Disclaimer
It introduces a novel structural–pressure approach to visualizing market dynamics.
For educational and analytical purposes only; this does not constitute financial advice.
Search in scripts for "band"

Fisher Transform Trend Navigator [QuantAlgo]🟢 Overview
The Fisher Transform Trend Navigator applies a logarithmic transformation to normalize price data into a Gaussian distribution, then combines this with volatility-adaptive thresholds to create a trend detection system. This mathematical approach helps traders identify high-probability trend changes and reversal points while filtering market noise in the ever-changing volatility conditions.
🟢 How It Works
The indicator's foundation begins with price normalization, where recent price action is scaled to a bounded range between -1 and +1:
highestHigh = ta.highest(priceSource, fisherPeriod)
lowestLow = ta.lowest(priceSource, fisherPeriod)
value1 = highestHigh != lowestLow ? 2 * (priceSource - lowestLow) / (highestHigh - lowestLow) - 1 : 0
value1 := math.max(-0.999, math.min(0.999, value1))
This normalized value then passes through the Fisher Transform calculation, which applies a logarithmic function to convert the data into a Gaussian normal distribution that naturally amplifies price extremes and turning points:
fisherTransform = 0.5 * math.log((1 + value1) / (1 - value1))
smoothedFisher = ta.ema(fisherTransform, fisherSmoothing)
The smoothed Fisher signal is then integrated with an exponential moving average to create a hybrid trend line that balances statistical precision with price-following behavior:
baseTrend = ta.ema(close, basePeriod)
fisherAdjustment = smoothedFisher * fisherSensitivity * close
fisherTrend = baseTrend + fisherAdjustment
To filter out false signals and adapt to market conditions, the system calculates dynamic threshold bands using volatility measurements:
dynamicRange = ta.atr(volatilityPeriod)
threshold = dynamicRange * volatilityMultiplier
upperThreshold = fisherTrend + threshold
lowerThreshold = fisherTrend - threshold
When price momentum pushes through these thresholds, the trend line locks onto the new level and maintains direction until the opposite threshold is breached:
if upperThreshold < trendLine
trendLine := upperThreshold
if lowerThreshold > trendLine
trendLine := lowerThreshold
🟢 Signal Interpretation
Bullish Candles (Green): indicate normalized price distribution favoring bulls with sustained buying momentum = Long/Buy opportunities
Bearish Candles (Red): indicate normalized price distribution favoring bears with sustained selling pressure = Short/Sell opportunities
Upper Band Zone: Area above middle level indicating statistically elevated trend strength with potential overbought conditions approaching mean reversion zones
Lower Band Zone: Area below middle level indicating statistically depressed trend strength with potential oversold conditions approaching mean reversion zones
Built-in Alert System: Automated notifications trigger when bullish or bearish states change, allowing you to act on significant developments without constantly monitoring the charts
Candle Coloring: Optional feature applies trend colors to price bars for visual consistency and clarity
Configuration Presets: Three parameter sets available - Default (balanced settings), Scalping (faster response with higher sensitivity), and Swing Trading (slower response with enhanced smoothing)
Color Customization: Four color schemes including Classic, Aqua, Cosmic, and Custom options for personalized chart aesthetics

Regression Channel (ShareScope-style, parallel)What it does
Replicates ShareScope’s Trend of displayed data look: a single straight linear-regression line (dashed) across a chosen window with parallel, constant-width bands above and below, plus optional shading.
Use it to see the overall trend gradient for a period and a statistically sized channel based on the fit’s residual error.
How it works (math, short)
Computes an OLS regression once over the analysis window.
Residual standard error s is derived from SSE and degrees of freedom (n−2).
Band half-width is constant across the window:
Mean CI (narrower): half = z * s / √n
Prediction (wider): half = z * s * √(1 + 1/n)
Three straight, parallel lines are drawn from the regression endpoints; midline is dashed.
This is intentionally not a tapered CI (which widens at the ends). It matches the visual behaviour of ShareScope’s shaded trend line channel.
Inputs
Source – Price series (Close, High, Low, HL2, etc.).
Use last N bars / N (bars) – Rolling window length.
From / To (date mode) – Alternative fixed date window.
Confidence (%) – 90 / 95 / 99 / Custom (uses z≈t).
Custom Z (t) – Override the quantile if desired.
Prediction bands – Use wider prediction envelope instead of mean CI.
Shade region + colors / opacity / line width.
Usage
To mimic ShareScope exactly, pick the same date span (use date mode) and set Confidence 99%.
Choose Prediction OFF for a tighter “confidence” look; ON for a wider, more permissive channel.
If ShareScope used High as source, set Source = High here as well.
Notes & limitations
TradingView does not expose the visible viewport to Pine. The script cannot auto-read “displayed data.” Use last N bars or date range.
Bands are parallel by design. Prices may close outside; the channel does not bend.
Window capped at 5,000 bars for performance. No alerts are emitted.
Differences vs TV’s native tools
Linear Regression (drawing) – manual object; no statistical sizing or shading.
Linear Regression Channel (indicator) – uses price standard deviations around the regression; width is a user stdev multiple.
This script – uses residual error of the OLS fit and a z/t quantile to size a statistically meaningful parallel channel.
Changelog
r3.1 – Guard fix (no return at top level), minor refactor, stable line updates.
r3 – Switched to single-fit OLS with parallel constant-width bands (ShareScope look).
(Earlier experimental builds r1–r2.2 implemented rolling/tapered CI; superseded.)
Disclaimer: Educational use only. Not investment advice.

PSAR+EMA+Hull+BBDescription
This all-in-one indicator combines four proven tools:
Parabolic SAR (Everget) — trend direction and potential reversals.
Exponential Moving Averages (20/50/100/200) — customizable lengths, colors, and offsets.
Hull Suite (InSilico) — smooth trend detection with multiple variations (HMA, THMA, EHMA).
Bollinger Bands — volatility and dynamic support/resistance.
Features
Toggle each module on/off in settings.
Fully configurable inputs (lengths, colors, offsets, multipliers).
Optional PSAR labels, highlights, and state fill.
Hull can color candles, draw band fills, and pull from higher timeframes.
Bollinger Bands include multiple basis types, stdev multipliers, and fill transparency.
Built-in alerts: PSAR direction change, Hull trending up/down.
Category
Trend Analysis (with Volatility as secondary).

Bollinger Adaptive Trend Navigator [QuantAlgo]🟢 Overview
The Bollinger Adaptive Trend Navigator synthesizes volatility channel analysis with variable smoothing mechanics to generate trend identification signals. It uses price positioning within Bollinger Band structures to modify moving average responsiveness, while incorporating ATR calculations to establish trend line boundaries that constrain movement during volatile periods. The adaptive nature makes this indicator particularly valuable for traders and investors working across various asset classes including stocks, forex, commodities, and cryptocurrencies, with effectiveness spanning multiple timeframes from intraday scalping to longer-term position analysis.
🟢 How It Works
The core mechanism calculates price position within Bollinger Bands and uses this positioning to create an adaptive smoothing factor:
bbPosition = bbUpper != bbLower ? (source - bbLower) / (bbUpper - bbLower) : 0.5
adaptiveFactor = (bbPosition - 0.5) * 2 * adaptiveMultiplier * bandWidthRatio
alpha = math.max(0.01, math.min(0.5, 2.0 / (bbPeriod + 1) * (1 + math.abs(adaptiveFactor))))
This adaptive coefficient drives an exponential moving average that responds more aggressively when price approaches Bollinger Band extremes:
var float adaptiveTrend = source
adaptiveTrend := alpha * source + (1 - alpha) * nz(adaptiveTrend , source)
finalTrend = 0.7 * adaptiveTrend + 0.3 * smoothedCenter
ATR-based volatility boundaries constrain the final trend line to prevent excessive movement during volatile periods:
volatility = ta.atr(volatilityPeriod)
upperBound = bollingerTrendValue + (volatility * volatilityMultiplier)
lowerBound = bollingerTrendValue - (volatility * volatilityMultiplier)
The trend line direction determines bullish or bearish states through simple slope comparison, with the final output displaying color-coded signals based on the synthesis of Bollinger positioning, adaptive smoothing, and volatility constraints (green = long/buy, red = short/sell).
🟢 Signal Interpretation
Rising Trend Line (Green): Indicates upward direction based on Bollinger positioning and adaptive smoothing = Potential long/buy opportunity
Falling Trend Line (Red): Indicates downward direction based on Bollinger positioning and adaptive smoothing = Potential short/sell opportunity
Built-in Alert System: Automated notifications trigger when bullish or bearish states change, allowing you to act on significant development without constantly monitoring the charts
Candle Coloring: Optional feature applies trend colors to price bars for visual consistency
Configuration Presets: Three parameter sets available - Default (standard settings), Scalping (faster response), and Swing Trading (slower response)

RSI Crossover AlertRSI Crossover Alert Indicator - User Guide
The RSI Crossover Alert Indicator is a comprehensive technical analysis tool that detects multiple types of RSI crossovers and generates real-time alerts. It combines traditional RSI analysis with signal lines, divergence detection, and multi-level crossing alerts.
1. Multiple Crossover Detection
- RSI/Signal Line Cross: Signals a primary trend change.
- RSI/Second Signal Cross: Confirmation signals for stronger trends.
- Level Crossings: Crosses of Overbought 70, Oversold 30, and Midline 50.
- Divergence Detection: Hidden and regular divergences for reversal signals.
2. Alert Types
- Alert: RSI > Signal
Description: Bullish momentum is building.
Signal: Consider long positions.
- Alert: RSI < Signal
Description: Bearish momentum is building.
Signal: Consider short positions.
- Alert: RSI > 70
Description: Entering the overbought zone.
Signal: Prepare for a potential reversal.
- Alert: RSI < 30
Description: Entering the oversold zone.
Signal: Watch for a bounce opportunity.
- Alert: RSI crosses 50
Description: A shift in momentum.
Signal: Trend confirmation.
3. Visual Components
- Lines: RSI blue, Signal orange, Second Signal purple
- Histogram: Visualizes momentum by showing the difference between RSI and the Signal line.
- Background Zones: Red overbought, Green oversold
- Markers: Up/down triangles to indicate crossovers.
- Info Table: Real-time RSI values and status.
Strategy 1: Classic Crossover
- Entry Long: RSI crosses above the Signal Line AND RSI is below 50.
- Entry Short: RSI crosses below the Signal Line AND RSI is above 50.
- Take Profit: On the opposite signal.
- Stop Loss: At the recent swing high/low.
Strategy 2: Extreme Zone Reversal
- Entry Long: RSI is below 30 and crosses above the Signal Line.
- Entry Short: RSI is above 70 and crosses below the Signal Line.
- Risk Management: Higher win rate but fewer signals. Use a minimum 2:1 risk-reward ratio.
Strategy 3: Divergence Trading
- Setup: Enable divergence alerts and look for price/RSI divergence. Wait for an RSI crossover for confirmation.
- Entry: Enter on the crossover after the divergence appears. Place the stop loss beyond the starting point of the divergence.
Strategy 4: Multi-Timeframe Confirmation
1. Check the higher timeframe e.g. Daily to identify the main trend.
2. Use the current timeframe e.g. 4H/1H for your entry.
3. Only enter in the direction of the main trend.
4. Use the RSI crossover as the entry trigger.
Optimal Settings by Market
- Forex Major Pairs
RSI Length: 14, Signal Length: 9, Overbought/Oversold: 70/30
- Crypto High Volatility
RSI Length: 10-12, Signal Length: 6-8, Overbought/Oversold: 75/25
- Stocks Trending
RSI Length: 14-21, Signal Length: 9-12, Overbought/Oversold: 70/30
- Commodities
RSI Length: 14, Signal Length: 9, Overbought/Oversold: 80/20
Risk Management Rules
1. Position Sizing: Never risk more than 1-2% on a single trade. Reduce size in ranging markets.
2. Stop Loss Placement: Place stops beyond the recent swing high/low for crossovers. Using an ATR-based stop is also effective.
3. Profit Taking: Take partial profits at a 1:1 risk-reward ratio. Switch to a trailing stop after reaching 2:1.
1. Filtering Signals
- Combine with volume indicators.
- Confirm the trend on a higher timeframe.
- Wait for candlestick pattern confirmation.
2. Avoid Common Mistakes
- Don't trade every single crossover.
- Avoid taking signals against a strong trend.
- Do not ignore risk management.
3. Market Conditions
- Trending Market: Focus on midline 50 crosses.
- Ranging Market: Look for reversals from overbought/oversold levels.
- Volatile Market: Widen the overbought/oversold levels.
- If you get too many false signals:
Increase the signal line period, add other confirmation indicators, or use a higher timeframe.
- If you are missing major moves:
Decrease the RSI length, shorten the signal line period, or check your alert settings.
Recommended Combinations
1. RSI + MACD: For dual momentum confirmation.
2. RSI + Bollinger Bands: For volatility-adjusted signals.
3. RSI + Volume: To confirm the strength of a signal.
4. RSI + Moving Averages: To use as a trend filter.
This indicator provides a comprehensive RSI analysis. Success depends on proper configuration, risk management, and combining signals with the overall market context. Start with the default settings, then optimize based on your trading style and market conditions.

4H Bollinger Breakout StrategyThis strategy leverages Bollinger Bands on the 4-hour timeframe for long and short trades in trending or ranging markets. Entries trigger on BB breakouts with optional filters for volume, trend, and RSI. Exits occur on opposite BB crosses. Customizable for long-only, short-only, or indicator mode via code comments. Supports forex, stocks, or crypto with full equity allocation and 0.1% commission.
Length (Default: 20): Period for BB basis and std dev; shorter for sensitivity, longer for smoothing.
Basis MA Type (Default: SMA): Selects MA for middle band (SMA, EMA, etc.); EMA for faster response.
Source (Default: Close): Price input for calculations; use close for standard accuracy.
StdDev Multiplier (Default: 1.8): Band width control; higher for fewer signals, lower for more.
Offset (Default: 0): Shifts BB plots; typically unchanged.
Use Filters (Default: True): Applies volume, trend, RSI checks to filter signals.
Volume MA Length (Default: 20): For volume filter (long: >105% avg, short: >120%).
Trend MA Length (Default: 80): SMA for trend filter (long: above MA, short: below).
RSI Length (Default: 14): For short filter (entry if RSI <85).
Use Long/Short Signals (Defaults: True): Toggles directions; long entry on lower BB crossover, short on upper crossunder.
Visuals: BB plots (blue basis, red upper, green lower), orange trend MA, filled background.
Labels/Alerts: Green/red for long entry/exit, yellow/purple for short; alert conditions included.

Volatility-Adjusted Momentum Score (VAMS) [QuantAlgo]🟢 Overview
The Volatility-Adjusted Momentum Score (VAMS) measures price momentum relative to current volatility conditions, creating a normalized indicator that identifies significant directional moves while filtering out market noise. It divides annualized momentum by annualized volatility to produce scores that remain comparable across different market environments and asset classes.
The indicator displays a smoothed VAMS Z-Score line with adaptive standard deviation bands and an information table showing real-time metrics. This dual-purpose design enables traders and investors to identify strong trend continuation signals when momentum persistently exceeds normal levels, while also spotting potential mean reversion opportunities when readings reach statistical extremes.
🟢 How It Works
The indicator calculates annualized momentum using a simple moving average of logarithmic returns over a specified period, then measures annualized volatility through the standard deviation of those same returns over a longer timeframe. The raw VAMS score divides momentum by volatility, creating a risk-adjusted measure where high volatility reduces scores and low volatility amplifies them.
This raw VAMS value undergoes Z-Score normalization using rolling statistical parameters, converting absolute readings into standardized deviations that show how current conditions compare to recent history. The normalized Z-Score receives exponential moving average smoothing to create the final VAMS line, reducing false signals while preserving sensitivity to meaningful momentum changes.
The visualization includes dynamically calculated standard deviation bands that adjust to recent VAMS behavior, creating statistical reference zones. The information table provides real-time numerical values for VAMS Z-Score, underlying momentum percentages, and current volatility readings with trend indicators.
🟢 How to Use
1. VAMS Z-Score Bands and Signal Interpretation
Above Mean Line: Momentum exceeds historical averages adjusted for volatility, indicating bullish conditions suitable for trend following
Below Mean Line: Momentum falls below statistical norms, suggesting bearish conditions or downward pressure
Mean Line Crossovers: Primary transition signals between bullish and bearish momentum regimes
1 Standard Deviation Breaks: Strong momentum conditions indicating statistically significant directional moves worth following
2 Standard Deviation Extremes: Rare momentum readings that often signal either powerful breakouts or exhaustion points
2. Information Table and Market Context
Z-Score Values: Current VAMS reading displayed in standard deviations (σ), showing how far momentum deviates from its statistical norm
Momentum Percentage: Underlying annualized momentum displayed as percentage return, quantifying the directional strength
Volatility Context: Current annualized volatility levels help interpret whether VAMS readings occur in high or low volatility environments
Trend Indicators: Directional arrows and change values provide immediate feedback on momentum shifts and market transitions
3. Strategy Applications and Alert System
Trend Following: Use sustained readings beyond the mean line and 1σ band penetrations for directional trades, especially when VAMS maintains position in upper or lower statistical zones
Mean Reversion: Focus on 2σ extreme readings for contrarian opportunities, particularly effective in sideways markets where momentum tends to revert to statistical norms
Alert Notifications: Built-in alerts for mean crossovers (regime changes), 1σ breaks (strong signals), and 2σ touches (extreme conditions) help monitor multiple instruments for both continuation and reversal setups

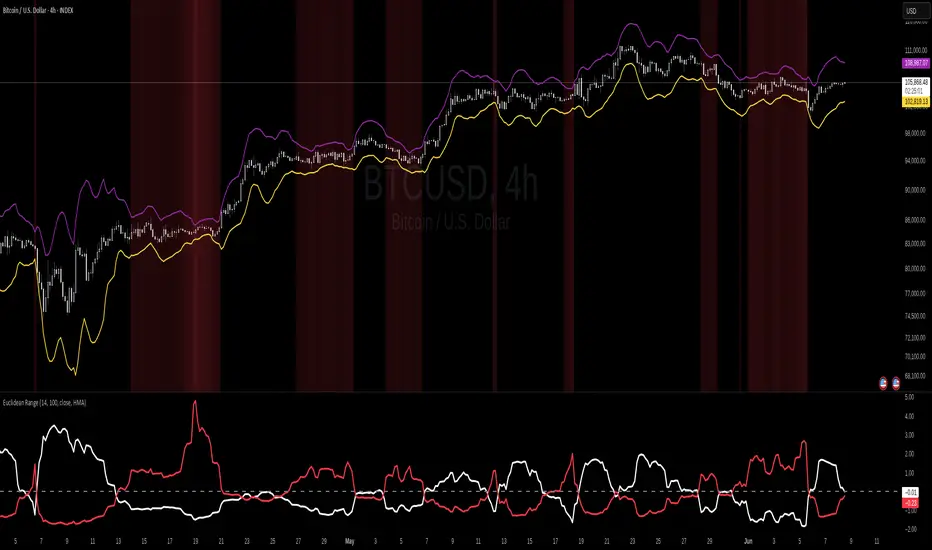
Euclidean Range [InvestorUnknown]The Euclidean Range indicator visualizes price deviation from a moving average using a geometric concept Euclidean distance. It helps traders identify trend strength, volatility shifts, and potential overextensions in price behavior.
Euclidean Distance
Euclidean distance is a fundamental concept in geometry and machine learning. It measures the "straight-line distance" between two points in space. In time series analysis, it can be used to measure how far one sequence deviates from another over a fixed window.
euclidean_distance(src, ref, len) =>
var float sum_sq_diff = na
sum_sq_diff := 0.0
for i = 0 to len - 1
diff = src - ref
sum_sq_diff += diff * diff
math.sqrt(sum_sq_diff)
In this script, we calculate the Euclidean distance between the price (source) and a smoothed average (reference) over a user-defined window. This gives us a single scalar that reflects the overall divergence between price and trend.
How It Works
Moving Average Calculation: You can choose between SMA, EMA, or HMA as your reference line. This becomes the "baseline" against which the actual price is compared.
Distance Band Construction: The Euclidean distance between the price and the reference is calculated over the Window Length. This value is then added to and subtracted from the average to form dynamic upper and lower bands, visually framing the range of deviation.
Distance Ratios and Z-Scores: Two distance ratios are computed: dist_r = distance / price (sensitivity to volatility); dist_v = price / distance (sensitivity to compression or low-volatility states)
Both ratios are normalized using a Z-score to standardize their behavior and allow for easier interpretation across different assets and timeframes.
Z-Score Plots: Z_r (white line) highlights instances of high volatility or strong price deviation; Z_v (red line) highlights low volatility or compressed price ranges.
Background Highlighting (Optional): When Z_v is dominant and increasing, the background is colored using a gradient. This signals a possible build-up in low volatility, which may precede a breakout.
Use Cases
Detect volatile expansions and calm compression zones.
Identify mean reversion setups when price returns to the average.
Anticipate breakout conditions by observing rising Z_v values.
Use dynamic distance bands as adaptive support/resistance zones.
Notes
The indicator is best used with liquid assets and medium-to-long windows.
Background coloring helps visually filter for squeeze setups.
Disclaimer
This indicator is provided for speculative analysis and educational purposes only. It is not financial advice. Always backtest and evaluate in a simulated environment before live trading.
Commodity Trend Reactor [BigBeluga]
🔵 OVERVIEW
A dynamic trend-following oscillator built around the classic CCI, enhanced with intelligent price tracking and reversal signals.
Commodity Trend Reactor extends the traditional Commodity Channel Index (CCI) by integrating trend-trailing logic and reactive reversal markers. It visualizes trend direction using a trailing stop system and highlights potential exhaustion zones when CCI exceeds extreme thresholds. This dual-level system makes it ideal for both trend confirmation and mean-reversion alerts.
🔵 CONCEPTS
Based on the CCI (Commodity Channel Index) oscillator, which measures deviation from the average price.
Trend bias is determined by whether CCI is above or below user-defined thresholds.
Trailing price bands are used to lock in trend direction visually on the main chart.
Extreme values beyond ±200 are treated as potential reversal zones.
🔵 FEATURES\
CCI-Based Trend Shifts:
Triggers a bullish bias when CCI crosses above the upper threshold, and bearish when it crosses below the lower threshold.
Adaptive Trailing Stops:
In bullish mode, a trailing stop tracks the lowest price; in bearish mode, it tracks the highest.
Top & Bottom Markers:
When CCI surpasses +200 or drops below -200, it plots colored squares both on the oscillator and on price, marking potential reversal zones.
Background Highlights:
Each time a trend shift occurs, the background is softly colored (lime for bullish, orange for bearish) to highlight the change.
🔵 HOW TO USE
Use the oscillator to monitor when CCI crosses above or below threshold values to detect trend activation.
Enter trades in the direction of the trailing band once the trend bias is confirmed.
Watch for +200 and -200 square markers as warnings of potential mean reversals.
Use trailing stop areas as dynamic support/resistance to manage stop loss and exit strategies.
The background color changes offer clean confirmation of trend transitions on chart.
🔵 CONCLUSION
Commodity Trend Reactor transforms the simple CCI into a complete trend-reactive framework. With real-time trailing logic and clear reversal alerts, it serves both momentum traders and contrarian scalpers alike. Whether you’re trading breakouts or anticipating mean reversions, this indicator provides clarity and structure to your decision-making.

2-Day Volume Weighted Average Price (VWAP)This indicator extends TradingView’s built-in VWAP by calculating a volume-weighted average price over a continuous two-day window (yesterday + today), anchoring VWAP at the start of yesterday’s session and carrying it through to today’s close, but only plotting the segment that falls within the current trading session—yesterday’s data feeds into the calculation to ensure today’s VWAP reflects the prior session’s volume and price action, while the line drawn on your chart always begins at today’s session open.
Standard Deviation Bands: Optional ±1σ, ±2σ, and ±3σ envelopes, exactly as in the default VWAP, but based on the rolling two-day data.

Range Filter Strategy with ATR TP/SLHow This Strategy Works:
Range Filter:
Calculates a smoothed average (SMA) of price
Creates upper and lower bands based on standard deviation
When price crosses above upper band, it signals a potential uptrend
When price crosses below lower band, it signals a potential downtrend
ATR-Based Risk Management:
Uses Average True Range (ATR) to set dynamic take profit and stop loss levels
Take profit is set at entry price + (ATR × multiplier) for long positions
Stop loss is set at entry price - (ATR × multiplier) for long positions
The opposite applies for short positions
Input Parameters:
Adjustable range filter length and multiplier
Customizable ATR length and TP/SL multipliers
All parameters can be optimized in TradingView's strategy tester
You can adjust the input parameters to fit your trading style and the specific market you're trading. The ATR-based exits help adapt to current market volatility.

The Ultimate Buy and Sell Indicator: Unholy Grail Edition"You see, Watson, the market is not random—it simply whispers in a code too complex for the average trader. Lucky for you, I am not average."
They searched for the Holy Grail of trading for decades—promises, false prophets, and overpriced PDFs.
But they were all looking in the wrong place.
This isn’t a relic buried in the desert.
This is the Unholy Grail — a machine-forged fusion of logic, engineering, and tactical overkill .
Built by Sherlock Macgyver , this is not a mystical object. It’s a surveillance system for trend detection, signal validation, and precision entries .
⚠️ Important: This script draws its own candles.
To see it properly, disable regular candles by turning off "Body", "Wick" and "Border" colors.
🔧 What You’re Looking At
This overlay plots confirmed Buy/Sell signals , momentum-based “watch” zones , adaptive candle coloring , SuperTrend bias detection , dual Bollinger Bands , and a moving average ribbon .
It’s not “minimalist” —it’s comprehensive .
📍 Configuring the Tool: Follow the Breadcrumbs
Every setting includes a tooltip — read them . They're not filler. They explain exactly how each feature functions so you can dial this thing in like you're tuning a surveillance rig in a Cold War bunker .
If you skip them, you're walking blind in a minefield .
🕰️ Timeframes: The Signal Sweet Spot
Each asset has a tempo . You need to find the one where signals align with clarity —not chaos .
Start with 4H or 1H —work up or down from there.
Too many fakeouts? → Higher timeframe
Too slow? → Drop to 15m or 5m —but expect more noise and adjust settings accordingly.
The signals scale with time, but you must find the rhythm that best fits your asset—and your trading lifestyle .
♻️ RSI Cycle = Signal Sensitivity
This is the heart of the system . It controls how reactive the RSI engine is.
Adjust based on noise level and how often you can actually monitor your charts.
Short cycle (14–24): More signals, more speed, more noise
Longer cycle (36–64): Smoother entries, better for swing traders
Tip: If your signals feel too jittery, increase the cycle. If they lag too much, reduce it.
📉 SuperTrend: Your Trend Bias Compass
This isn’t your average SuperTrend. It adapts with RSI overlay logic and detects market “silence” via EMA compression— turning white right before the chaos . That said, you still control its aggression.
ATR Length = how many bars to average
ATR Factor = how tight or loose it hugs price
Lower = more sensitive (more trades, more noise)
Higher = confirmation only (fewer, but stronger signals)
Tweak until it feels like a sniper rifle.
No, you won’t get it perfect on the first try.
Yes, it’s worth it.
🛠️ Modular Signals: Why Things Fire (or Don’t)
Buy/Sell entries require conditions to align. The logic is modular, and that’s on purpose.
RSI signals only fire if RSI crosses its smoothed MA outside the dead zone and a “Watch” condition is active.
SuperTrend signals can be enabled to act on crossovers, optionally ignoring the Watch filter .
Watch conditions (colored squares) act as early recon and hint at possible upcoming trades.
Background color changes are “pre-signal warnings” and will repaint . Use them as leading signals, not gospel.
Want more trades? Loosen your filters .
Want sniper entries? Lock them down .
🌈 Candles and MAs: Visual Market Structure
Candles adapt in real-time to MA structure:
Green = bullish (above both fast/slow MAs)
Yellow = indecision (between)
Red = bearish (below both)
Buy/Sell signals override candles with bright orange and fuchsia —because subtlety doesn’t win wars .
You can also enable up to 8 customizable moving averages —great for confluence , trend confirmation , or just looking like a wizard .
🧠 Pro Usage Tips (TL;DR for Smart People):
Use tooltips in the settings menu —every toggle and slider is explained
Test timeframes until signal frequency and reliability match your goals
Adjust RSI cycle to reduce noise or speed up signals based on how frequently you trade
Tweak SuperTrend factor and ATR to fit volatility on your asset
Start with visual confirmation :
• Are watch signals lining up with trend zones?
• Are backgrounds firing before price moves?
• Are candle colors agreeing with signal direction?
📣 Alerts & Integration
Alerts are available for:
Buy/Sell entries (confirmed or advanced background)
Watch signals
Full band agreement (both Bollinger bands bullish or bearish)
Use these with webhook systems , bots , or your own trade journals .
Created by Sherlock Macgyver
Because sometimes the best trade…
is knowing exactly when not to take one.

Volumetric Entropy IndexVolumetric Entropy Index (VEI)
A volume-based drift analyzer that captures directional pressure, trend agreement, and entropy structure using smoothed volume flows.
---
🧠 What It Does:
• Volume Drift EMAs : Shows buy/sell pressure momentum with adaptive smoothing.
• Dynamic Bands : Bollinger-style volatility wrappers react to expanding/contracting drift.
• Baseline Envelope : Clean structural white rails for mean-reversion zones or trend momentum.
• Background Shading : Highlights when both sides (up & down drift) are in agreement — green for bullish, red for bearish.
• Alerts Included : Drift alignment, crossover events, net drift shifts, and strength spikes.
---
🔍 What Makes It Different:
• Most volume indicators rely on bars, oscillators, or OBV-style accumulation — this doesn’t.
• It compares directional EMAs of raw volume to isolate real-time bias and acceleration.
• It visualizes the twisting tension between volume forces — not just price reaction.
• Designed to show when volatility is building inside the volume mechanics before price follows.
• Modular — every element is optional, so you can run it lean or fully loaded.
---
📊 How to Use It:
• Drift EMAs : Watch for one side consistently dominating — sharp spikes often precede breakouts.
• Bands : When they tighten and start expanding, it often signals directional momentum forming.
• Envelope Lines : Use as high-probability reversal or continuation zones. Bands crossing envelopes = potential thrust.
• Background Color : Green/red backgrounds confirm volume agreement. Can be used as a filter for other signals.
• Net Drift : Optional smoothed oscillator showing the difference between bullish and bearish volume pressure. Crosses above or below zero signal directional bias shifts.
• Drift Strength : Measures pressure buildup — spikes often correlate with large moves.
---
⚙️ Full Customization:
• Turn every layer on/off independently
• Modify all colors, transparencies, and line widths
• Adjust band width multiplier and envelope offset (%)
• Toggle bonus plots like drift strength and net baseline
---
🧪 Experimental Tools:
• Smoothed Net Drift trace
• Drift Strength signal
• Envelope lines and dynamic entropy bands with adjustable math
---
Built for signal refinement. Made to expose directional imbalance before the herd sees it.
Created by @Sherlock_Macgyver

ReadyFor401ks Just Tell Me When!ReadyFor401ks Just Tell Me When!
LET ME START BY SAYING. NO INDICATOR WILL HELP YOU NAIL THE PERFECT ENTRY/EXIT ON A TRADE. YOU SHOULD ALWAYS EDUCATE YOURSELF AND HAVE A BASIC UNDERSTANDING OF INVESTING, TRADING, CHART ANALYSIS, AND THE RISKS INVOLVED WITH. THAT BEING SAID, WITH THE RIGHT ADJUSTMENTS, IT'S PRETTY D*$N CLOSE TO PERFECTION!
This indicator is designed to help traders identify t rend direction, continuation signals, and potential exits based on a dynamic blend of moving averages, ATR bands, and price action filters. Whether you’re an intraday trader scalping the 5-minute chart or a swing trader analyzing the weekly timeframe for LEAPS , this tool provides a clear, rule-based system to help guide your trading decisions.
⸻
Key Features & Benefits
🔹 Customizable Trend Power (Baseline) Calculation
• Choose from JMA, EMA, HMA, TEMA, DEMA, SMA, VAMA, and WMA for defining your baseline trend direction.
• The baseline helps confirm whether the market is in a bullish or bearish phase.
🔹 ATR-Based Trend Continuation & Volatility Measurement
• ATR bands dynamically adjust to market conditions, helping you spot breakouts and fakeouts.
• The indicator detects when price violates ATR range , which often signals impulse moves.
🔹 Clear Entry & Exit Signals
• Uses a Continuation MA (SSL2) to confirm trends.
• Includes a separate Exit MA (SSL3) that provides crossover signals to indicate when to exit trades or reverse positions .
• Plots trend continuation circles when ATR conditions align with trend signals.
🔹 Keltner Channel Baseline for Market Structure
• A modified Keltner Channel is integrated into the baseline to help filter out choppy conditions .
• If price remains inside the baseline, the market is in consolidation , while breakouts beyond the bands indicate strong trends .
🔹 Adaptive Color Coding for Market Conditions
• Bars change color based on momentum, making trend direction easy to read.
• Green = Bullish Trend, Red = Bearish Trend, Gray = Neutral/Chop.
🔹 Flexible Alerts for Trade Management
• Get real-time alerts when the Exit MA crosses price , helping you l ock in profits or switch directions .
⸻
How to Use This Indicator for Different Trading Styles
🟢 For Intraday Trading (5-Minute Chart Setup)
• Faster MA settings help react quickly to momentum shifts.
• Ideal for scalping breakouts, trend continuation setups, and intraday reversals.
• Watch for ATR violations and price interacting with the baseline/Keltner Channel for entries.
--------------------------------
My Settings for Intraday Trading on 5min Chart
ATR Period: 15
ATR Multi: 1
ATR Smoothing: WMA
Trend Power based off of: JMA
Trend Power Period: 30
Continuation Type: JMA
Continuation Length: 20
Calculate Exit of what MA?: HMA
Calculate Exit off what Period? 30
Source of Exit Calculation: close
JMA Phase *APPLIES TO JMA ONLY: 3
JMA Power *APPLIES TO JMA ONLY: 3
Volatility Lookback Period *APPLIES TO VAMA ONLY 30
Use True Range for Channel? Checked
Base Channel Multiplier: 0.4
ATR Continuation Criteria: 1.1
----------------------------------
🔵 For Swing Trading & LEAPS (Weekly Chart Setup - Default Settings)
• Slower MAs provide a broader view of trend structure.
• Helps capture multi-week trend shifts and confirm entry points for longer-term trades.
• Weekly ATR bands highlight when stocks are entering overextended conditions.
💡 Example:
Let’s say you’re looking at TSLA on a Weekly Chart using the default settings. You notice that price crosses above the continuation MA (SSL2) while remaining above the baseline (trend power MA). The bar turns green, and price breaks above ATR resistance, signaling a strong bullish continuation. This could be a great opportunity to enter a long-term swing trade or LEAPS options position.
On the flip side, if price reverses below the Exit MA (SSL3) and turns red while breaking the lower ATR band, it might signal a good time to exit longs or enter a short trade.
⸻
Final Thoughts
The ReadyFor401ks Just Tell Me When! indicator is an all-in-one trading system that simplifies trend-following, volatility measurement, and trade management. By integrating multiple moving average types, ATR filters, and clear visual cues, it allows traders to stay disciplined and remove emotions from their trading decisions.
✅ Perfect for scalpers, day traders, and swing traders alike!
🔔 Set up alerts for automated trade signals and never miss a key move!
💬 If you find this indicator useful, leave a comment and share how you use it in your trading! 🚀

FON60DK by leventsahThe strategy generates buy and sell signals using the Tillson T3 and TOTT (Twin Optimized Trend Tracker) indicators. Additionally, the Williams %R indicator is used to filter the signals. Below is an explanation of the main components of the code:
1. Input Parameters:
Tillson T3 and TOTT parameters: Separate parameters are defined for both buy (AL) and sell (SAT) conditions. These parameters control the sensitivity and behavior of the indicators.
Williams %R period: The period for the Williams %R indicator is set to determine overbought and oversold levels.
2. Tillson T3 Calculation:
The Tillson T3 indicator is a smoothed moving average that uses an exponential moving average (EMA) with additional smoothing. The formula calculates a weighted average of multiple EMAs to produce a smoother line.
The t3 function computes the Tillson T3 value based on the close price and the input parameters.
3. TOTT Calculation (Twin Optimized Trend Tracker):
The TOTT indicator is a trend-following tool that adjusts its sensitivity based on market conditions. It uses a combination of price action and a volatility coefficient to determine trend direction.
The Var_Func function calculates the TOTT value, which is then used to derive the OTT (Optimized Trend Tracker) levels for both buy and sell conditions.
4. Williams %R Calculation:
Williams %R is a momentum oscillator that measures overbought and oversold levels. It is calculated using the highest high and lowest low over a specified period.
5. Buy and Sell Conditions:
Buy Condition: A buy signal is generated when the Tillson T3 value crosses above the TOTT upper band (OTTup) and the Williams %R is above -20 (indicating an oversold condition).
Sell Condition: A sell signal is generated when the Tillson T3 value crosses below the TOTT lower band (OTTdnS) and the Williams %R is above -70 (used to close long positions).
6. Strategy Execution:
The strategy.entry function is used to open a long position when the buy condition is met.
The strategy.close function is used to close the long position when the sell condition is met.
7. Visualization:
The bars on the chart are colored green when a long position is open.
The Tillson T3, TOTT upper band (OTTup), and TOTT lower band (OTTdn) are plotted on the chart for both buy and sell conditions.
8. Plots:
The Tillson T3 values for buy and sell conditions are plotted in blue.
The TOTT upper and lower bands are plotted in green and red, respectively, for both buy and sell conditions.
Summary:
This strategy combines trend-following indicators (Tillson T3 and TOTT) with a momentum oscillator (Williams %R) to generate buy and sell signals. The use of separate parameters for buy and sell conditions allows for fine-tuning the strategy based on market behavior. The visual elements, such as colored bars and plotted indicators, help traders quickly identify signals and trends on the chart.

Hull Suite by MRS**Hull Suite by MRS Strategy Indicator**
The Hull Suite by MRS Strategy is a technical analysis tool designed to provide insights into market trends using variations of the Hull Moving Average (HMA). This strategy aims to help traders identify optimal entry points for both long and short positions by utilizing multiple types of Hull-based indicators.
### Key Features:
1. **Hull Moving Average Variations**: The indicator offers three different Hull Moving Average variants:
- **HMA (Hull Moving Average)**: A fast-moving average that minimizes lag and reacts quickly to price changes.
- **EHMA (Enhanced Hull Moving Average)**: A smoother version of HMA with reduced noise, offering a clearer view of market trends.
- **THMA (Triple Hull Moving Average)**: A more complex Hull average that aims to provide a stronger confirmation of trend direction.
2. **Customizable Parameters**:
- **Source Selection**: Allows traders to choose the source for calculation (e.g., closing prices).
- **Length**: A configurable parameter to adjust the period over which the moving average is calculated (e.g., 55-period for swing entries).
- **Trend Coloring**: Users can enable automatic color-coding of the Hull moving average to reflect whether the market is in an uptrend (green) or downtrend (red).
- **Candle Color**: Option to color candles based on Hull's trend, further improving the visual clarity of trend direction.
3. **Entry and Exit Signals**:
- **Buy Signal**: Generated when the Hull moving average crosses above its historical value, indicating a potential upward price movement.
- **Sell Signal**: Triggered when the Hull moving average crosses below its historical value, signaling a potential downward price movement.
- The strategy can be customized to work with long, short, or both directions, making it adaptable for various market conditions.
4. **Visual Representation**:
- **Hull Bands**: The indicator can plot the Hull moving average as bands, with customizable transparency to suit individual preferences.
- **Band Filler**: The area between the two Hull moving averages is filled, making it easier to identify trends at a glance.
5. **Backtesting and Strategy Execution**: This strategy can be tested on historical data with adjustable backtest start and stop dates, providing traders with a better understanding of its performance before live trading.
### Purpose:
The Hull Suite by MRS Strategy is designed to assist traders in determining the optimal time to enter and exit the market based on robust Hull moving averages. With its flexibility, it can be used for trend-following, swing trading, or other strategic applications.

Range Channel by Atilla YurtsevenThis script creates a dynamic channel around a user-selected moving average (MA). It calculates the relative difference between price and the MA, then finds the average of the positive differences and the negative differences separately. Using these averages, it plots upper and lower bands around the MA as well as a histogram-like oscillator to show when price moves above or below the average thresholds.
How It Works
Moving Average Selection
The indicator allows you to choose among multiple MA types (SMA, EMA, WMA, Linear Regression, etc.). Depending on your preference, it calculates the chosen MA for the selected lookback period.
Relative Difference Calculation
It then computes the percentage difference between the source (typically the closing price) and the MA. (diff = (src / ma - 1) * 100)
Positive & Negative Averages
- Positive differences are averaged and represent how far the price typically moves above the MA.
- Negative differences are similarly averaged for when price moves below the MA.
Range Channel & Oscillator
- The channel is plotted around the MA using the average positive and negative differences (Upper Edge and Lower Edge).
- The “Untrended” histogram plots the difference (diff). Green bars occur when price is above the MA on average, and red bars when below. Two additional lines mark the upper and lower average thresholds on this histogram.
How to Use
Identify Overbought/Oversold Zones: The upper edge can serve as a dynamic overbought level, while the lower edge can suggest potential oversold conditions. When the histogram approaches or crosses these levels, it may signal price extremes relative to its average movement.
Trend Confirmation: Compare price action relative to the channel. If price and the histogram consistently remain above the MA and upper threshold, it could indicate a stronger bullish trend. If they remain below, it might signal a prolonged bearish trend.
Entry/Exit Timings:
- Entry: Traders can look for moments when price breaks back inside the channel from an extreme, anticipating a mean reversion.
- Exit: Watching how price interacts with these dynamic edges can help define stop-loss or take-profit points.
Because these thresholds adapt over time based on actual price behavior, they can be more responsive than fixed-percentage bands. However, like all indicators, it’s most effective when used in conjunction with other technical and fundamental tools.
Disclaimer
This script is provided for educational and informational purposes only. It does not guarantee any specific outcome or profit. Use it at your own discretion and risk.
Trade smart, stay safe.
Atilla Yurtseven

Mean Reversion V-FThis strategy workings on high volatile stock or crypto assets
It using 5 dynamic band's to get in the long position.
In same time depends on the band increases the units of the asset to get in the next position.
The unit's of the asset can be adjusted. Make sure to adjust the unit for different asset.
The bands are determined of main SMA.
There is no stop loss.
Take profit is trialing - HMA or % or average price + take profit - note if you use % trailing back test is not realistic but is working on real time.
Deviations can be adjust depends on the asset volatility.

Directional Volume IndexDirectional Volume Index (DVI) (buying/selling pressure)
This index is adapted from the Directional Movement Index (DMI), but based on volume instead of price movements. The idea is to detect building directional volume indicating a growing amount of orders that will eventually cause the price to follow. (DVI is not displayed by default)
The rough algorithm for the Positive Directional Volume Index (green bar):
calculate the delta to the previous green bar's volume
if the delta is positive (growing buying pressure) add it to an SMA, else add 0 (also for red bars)
divide these average deltas by the average volume
the result is the Positive Directional Volume Index (DVI+) (vice versa for DVI-)
Differential Directional Volume Index (DDVI) (relative pressure)
Creating the difference of both Directional Volume Indexes (DVI+ - DVI-) creates the Differential Directional Volume Index (DDVI) with rising values indicating a growing buying pressure, falling values a growing selling pressure. (DDVI is displayed by default, smoothed by a custom moving average)
Average Directional Volume Index (ADVX) (pressure strength)
Putting the relative pressure (DDVI) in relation to the total pressure (DVI+ + DVI-) we can determine the strength and duration of the currently building volume change / trend. For the DMI/ADX usually 20 is an indicator for a strong trend, values above 50 suggesting exhaustion and approaching reversals. (ADVX is not displayed by default, smoothed by a custom moving average)
Divergences of the Differential Directional Volume Index (DDVI) (imbalances)
By detecting divergences we can detect situations where e.g. bullish volume starts to build while price is in a downtrend, suggesting that there is growing buying pressure indicating an imminent bullish pullback/order block or reversal. (strong and hidden divergences are displayed by default)
Divergences Overview:
strong bull: higher lows on volume, lower lows on price
medium bull: higher lows on volume, equal lows on price
weak bull: equal lows on volume, lower lows on price
hidden bull: lower lows on volume, higher lows on price
strong bear: lower highs on volume, higher highs on price
medium bear: lower highs on volume, equal highs on price
weak bear: equal highs on volume, higher highs on price
hidden bear: higher highs on volume, lower highs on price
DDVI Bands (dynamic overbought/oversold levels)
Using Bollinger Bands with DDVI as source we receive an averaged relative pressure with stdev band offsets. This can be used as dynamic overbought/oversold levels indicating reversals on sharp crossovers.
Alerts
As of now there are no alerts built in, but all internal data is exposed via plot and plotshape functions, so it can be used for custom crossover conditions in the alert dialog. This is still a personal research project, so if you find good setups, please let me know.

Honest Volatility Grid [Honestcowboy]The Honest Volatility Grid is an attempt at creating a robust grid trading strategy but without standard levels.
Normal grid systems use price levels like 1.01;1.02;1.03;1.04... and place an order at each of these levels. In this program instead we create a grid using keltner channels using a long term moving average.
🟦 IS THIS EVEN USEFUL?
The idea is to have a more fluid style of trading where levels expand and follow price and do not stick to precreated levels. This however also makes each closed trade different instead of using fixed take profit levels. In this strategy a take profit level can even be a loss. It is useful as a strategy because it works in a different way than most strategies, making it a good tool to diversify a portfolio of trading strategies.
🟦 STRATEGY
There are 10 levels below the moving average and 10 above the moving average. For each side of the moving average the strategy uses 1 to 3 orders maximum (3 shorts at top, 3 longs at bottom). For instance you buy at level 2 below moving average and you increase position size when level 6 is reached (a cheaper price) in order to spread risks.
By default the strategy exits all trades when the moving average is reached, this makes it a mean reversion strategy. It is specifically designed for the forex market as these in my experience exhibit a lot of ranging behaviour on all the timeframes below daily.
There is also a stop loss at the outer band by default, in case price moves too far from the mean.
What are the risks?
In case price decides to stay below the moving average and never reaches the outer band one trade can create a very substantial loss, as the bands will keep following price and are not at a fixed level.
Explanation of default parameters
By default the strategy uses a starting capital of 25000$, this is realistic for retail traders.
Lot sizes at each level are set to minimum lot size 0.01, there is no reason for the default to be risky, if you want to risk more or increase equity curve increase the number at your own risk.
Slippage set to 20 points: that's a normal 2 pip slippage you will find on brokers.
Fill limit assumtion 20 points: so it takes 2 pips to confirm a fill, normal forex spread.
Commission is set to 0.00005 per contract: this means that for each contract traded there is a 5$ or whatever base currency pair has as commission. The number is set to 0.00005 because pinescript does not know that 1 contract is 100000 units. So we divide the number by 100000 to get a realistic commission.
The script will also multiply lot size by 100000 because pinescript does not know that lots are 100000 units in forex.
Extra safety limit
Normally the script uses strategy.exit() to exit trades at TP or SL. But because these are created 1 bar after a limit or stop order is filled in pinescript. There are strategy.orders set at the outer boundaries of the script to hedge against that risk. These get deleted bar after the first order is filled. Purely to counteract news bars or huge spikes in price messing up backtest.
🟦 VISUAL GOODIES
I've added a market profile feature to the edge of the grid. This so you can see in which grid zone market has been the most over X bars in the past. Some traders may wish to only turn on the strategy whenever the market profile displays specific characteristics (ranging market for instance).
These simply count how many times a high, low, or close price has been in each zone for X bars in the past. it's these purple boxes at the right side of the chart.
🟦 Script can be fully automated to MT5
There are risk settings in lot sizes or % for alerts and symbol settings provided at the bottom of the indicator. The script will send alert to MT5 broker trying to mimic the execution that happens on tradingview. There are always delays when using a bridge to MT5 broker and there could be errors so be mindful of that. This script sends alerts in format so they can be read by tradingview.to which is a bridge between the platforms.
Use the all alert function calls feature when setting up alerts and make sure you provide the right webhook if you want to use this approach.
Almost every setting in this indicator has a tooltip added to it. So if any setting is not clear hover over the (?) icon on the right of the setting.

Daily BreadWhat it does:
This script uses specific multiple true ranges from a 30 EMA baseline to plot lines that represent 10% buying increments. Although the common period for ATR is 14, this script employs a period of 20 for smoothing that I have determined is more effective when used with a daily candle chart. It includes onscreen trend signals to identify an uptrend or downtrend when the 50 EMA crosses the 90 EMA and will also display a coloured directional signal at each candle beyond an EMA cross to identify the current trend.
The script plots a scale of percentage labels at the end of each line to identify the percent of an account intended to be in short or longer term trades.
How it does it:
The script uses a 30 EMA baseline and then multiplies ATR increments of +1, +2, +4 and -1 through -7. These ATR multiples and the EMA are plotted as 11 lines, 10 of which make up the range of 10% increments from 10% to 100% with the 11th line being the High Band representing the extreme high or expected sale of any holdings. The percentage label scale uses variable declarations to position and colour match a percentage label to each line.
Intended use:
It is intended to be used for short term trading or long term investing with a daily market index chart such as SPY and multiple exchange traded funds that track said market index. A different ETF is purchased when a daily SPY candle reaches a lower buy band using 10% of a total account value. The sale of any ETFs is at the discretion of the trader and dependent on investment strategy (short term trading or long term inventing) and the trend. When short term trading in a downtrend or when daily candles are below the 50 EMA, selling would be done every 2 to 3 bands above a buy to mitigate the risk of a significant portion of an account getting caught in a downtrend. In an uptrend the High Band would be used to sell any holdings.
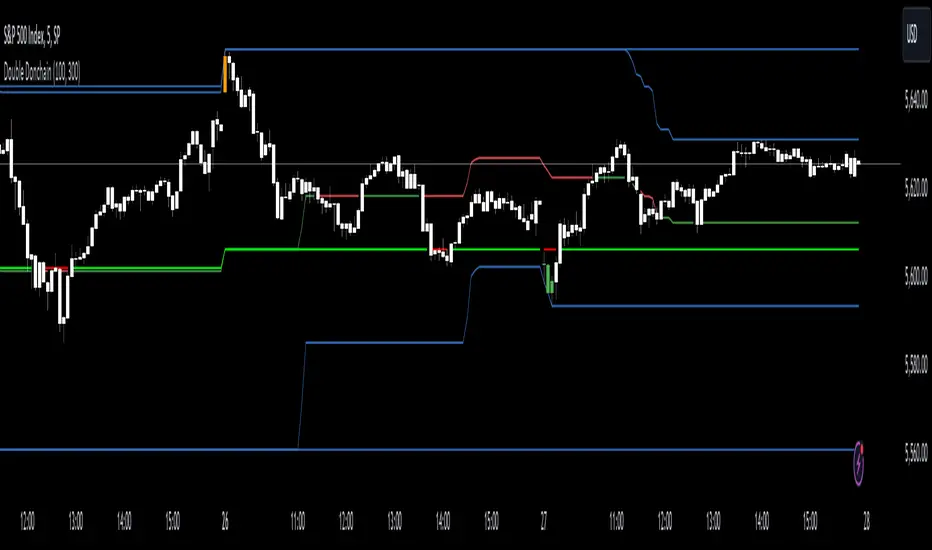
Double Donchian Channels [CrossTrade]Dual Channel System
The indicator incorporates two Donchian Channels - the Inner Channel and the Outer Channel. These channels are adjustable, allowing users to define their lengths according to their trading strategy.
Inner Channel: With a default length of 100 periods, the Inner Channel provides a closer view of market trends and potential support and resistance areas. It includes an upper, lower, and middle line (average of the upper and lower), offering detailed insights into shorter-term price movements.
Outer Channel: Set with a default length of 300 periods, the Outer Channel offers a broader perspective, ideal for identifying long-term trends and stronger levels of support and resistance.
Dynamic Color Coding: The middle lines of both channels change color based on the relationship between the previous close and the channel's basis. This feature provides an immediate visual cue regarding market sentiment.
Touching Bars Highlighting: The indicator highlights bars that touch the upper or lower bands of either channel. This is particularly useful for identifying potential reversals or continuation patterns.
Pullback Identification: By differentiating between bars that touch the Inner Channel only and those that touch the Outer Channel, the indicator helps in identifying pullbacks within a broader trend.
Customizable Alert System: Users can set up alerts for specific conditions - a bar touching the bottom band of the Inner Channel (green), the bottom band of the Outer Channel (blue), the upper band of the Inner Channel (red), and the upper band of the Outer Channel (orange). These alerts assist in timely decision-making and can be tailored to individual trading styles.
The indicator is a versatile tool designed to adapt to various trading styles and timeframes. Its features make it suitable for trend analysis, identifying potential reversal points, and understanding market volatility.