Keltner Channel+EMA with Buy/Sell SignalsIndicator Name: Double Keltner Channel with EMA (Buy/Sell Signals)
Description:
This indicator is designed to help traders identify potential trend reversals and generate buy/sell signals in volatile markets. It combines two Keltner Channels with different sensitivities (multipliers of 2.6 and 3.8) to visualize dynamic support and resistance levels. The addition of a 20-period EMA helps confirm trend direction and filter out potential false signals.
How the Indicator Works:
• Keltner Channels: These bands dynamically adjust to changing market volatility, offering a visual representation of potential price ranges. The 2.6 multiplier Keltner Channel (KC) is more sensitive to price changes, potentially highlighting short-term reversals, while the 3.8 multiplier KC focuses on broader trend shifts.
• 20-period EMA: This widely used trend indicator helps smooth out price fluctuations and identify the underlying direction of the market.
• Buy Signals: Generated when a candle's low touches or crosses below either Keltner Channel's lower band, and within the next 6 candles, that same candle closes above the 20 EMA. This combination suggests a potential rejection of lower prices (support) and a possible resumption of the uptrend.
• Sell Signals: Mirror the buy signal logic but are triggered when the candle's high touches or crosses above either Keltner Channel's upper band and then closes below the 20 EMA within the next 6 candles. This indicates a potential rejection of higher prices (resistance) and a possible shift to a downtrend.
How to Use the Indicator:
1. Identify the Trend: Use the 20 EMA to determine the overall trend direction. Look for buy signals primarily in uptrends and sell signals in downtrends.
2. Confirm with RSI : While not included in this indicator, consider using a separate Relative Strength Index (RSI) with a length of 10, SMA type, MA length of 14, and standard deviation of 2. Look for oversold conditions (RSI below 20) to confirm buy signals and overbought conditions (RSI above 80) to confirm sell signals.
3.Apply Risk Management: Always use appropriate risk management techniques, such as stop-loss orders, to protect your capital.
Key Points:
• This indicator is most effective in trending markets.
• It is not a standalone trading system and should be used in conjunction with other analysis tools and confirmation.
• The Keltner Channel multiplier values can be adjusted to suit your trading style and risk tolerance.
Important Disclaimer:
This indicator is a modification of the original Keltner Channel code and is intended for educational and informational purposes only.
It does not constitute financial advice. Always conduct your own research and consult with a qualified financial advisor before making any investment decisions.
Search in scripts for "band"

Bitcoin Wave RainbowThis Bitcoin Wave Rainbow model is a powerful tool designed to help traders of all levels understand and navigate the Bitcoin market. It works only with BTC in any timeframe, but better looks in dayly or weekly timeframes. It provides valuable insights into historical price behavior and offers forecasts for the next decade, making it an essential asset for both short-term and long-term strategies.
How the Model Works
The model is built on a logarithmic trend, also known as a power law, represented by the green line on the chart. This line illustrates the expected price trajectory of Bitcoin over time. The model also incorporates a range of price fluctuations around this trend, represented by colored bands.
The width of these bands narrows over time, indicating that the model becomes increasingly accurate as it progresses. This is due to the exponential decrease in the range of price fluctuations, making the model a reliable tool for predicting future price movements.
Understanding the Zones
Blue Zone: This zone signifies that the price is below its trend, making it a recommended area for buying Bitcoin. It represents a level where the price is unlikely to fall further, providing a potential opportunity for accumulation.
Green Zone: This zone represents a fair price range, where the price is relatively close to its trend. In this zone, the price may continue to go up or down, depending on the halving season. ransiting up around any halving and transiting down around 2 years after each halving.
Yellow Zone: This zone indicates that the price is somewhat overheated, often due to the hype following a halving event. While there may still be room for the price to rise, traders should exercise caution in this zone, as a price correction could occur.
Red Zone: This zone represents a strong overbought condition, where the price is significantly above its trend. Traders should be extremely cautious in this zone and consider reducing their positions, as the price is likely to revert back towards the trend or even lower.
Using the Model in Your Trading Strategy
This indicator can be used in conjunction with the Bitcoin Wave Model, which complements it by showing harmonic price fluctuations associated with halving events. Together, these indicators provide a comprehensive view of the Bitcoin market, allowing traders to make informed decisions based on both historical data and future projections.
Benefits for Traders
This Bitcoin price model offers numerous benefits for traders, including:
Clear Visualization: The model provides a clear and concise visual representation of Bitcoin's price behavior, making it easy to understand and interpret.
Accurate Forecasting: The model's accuracy increases over time, providing reliable forecasts for future price movements.
Risk Management: The model helps traders identify overbought and oversold conditions, allowing them to manage their risk more effectively.
Strategic Decision-Making: By understanding the different zones and their implications, traders can make more informed decisions about when to buy, sell, or hold Bitcoin.
By incorporating this Bitcoin price model into your trading strategy, you can gain a deeper understanding of the market dynamics and improve your chances of success.

Bullish Candlestick Patterns With Filters [TradeDots]The "Bullish Candlestick Patterns With Filters" is a trading indicator that identifies 6 core bullish candlestick patterns. This is further enhanced by applying channel indicator as filters, designed to further increase the accuracy of the recognized patterns.
6 CANDLESTICK PATTERNS
Hammer
Inverted Hammer
Bullish Engulfing
The Piercing Line
The Morning Star
The 3 White Soldiers
SIGNAL FILTERING
The indicator incorporates with 2 primary methodologies aimed at filtering out lower accuracy signals.
Firstly, it comes with a "Lowest period" parameter that examines whether the trough of the bullish candlestick configuration signifies the lowest point within a specified retrospective bar length. The longer the period, the higher the probability that the price will rebound.
Secondly, the channel indicators, the Keltner Channels or Bollinger Bands. This indicator examines whether the lowest point of the bullish candlestick pattern breaches the lower band, indicating an oversold signal. Users have the flexibility to modify the length and band multiplier, enabling them to custom-tune signal sensitivity.
Without Filtering:
With Filtering
RISK DISCLAIMER
Trading entails substantial risk, and most day traders incur losses. All content, tools, scripts, articles, and education provided by TradeDots serve purely informational and educational purposes. Past performances are not definitive predictors of future results.

Bandwidth Volatility - Silverman Rule of thumb EstimatorOverview
This indicator calculates volatility using the Rule of Thumb bandwidth estimator and incorporating the standard deviations of returns to get historical volatility. There are two options: one for the original rule of thumb bandwidth estimator, and another for the modified rule of thumb estimator. This indicator comes with the bandwidth , which is shown with the color gradient columns, which are colored by a percentile of the bandwidth, and the moving average of the bandwidth, which is the dark shaded area.
The rule of thumb bandwidth estimator is a simple and quick method for estimating the bandwidth parameter in kernel density estimation (KSE) or kernel regression. It provides a rough approximation of the bandwidth without requiring extensive computation resources or fine-tuning. One common rule of thumb estimator is Silverman rule, which is given by
h = 1.06*σ*n^(-1/5)
where
h is the bandwidth
σ is the standard deviation of the data
n is the number of data points
This rule of thumb is based on assuming a Gaussian kernel and aims to strike a balance between over-smoothing and under-smoothing the data. It is simple to implement and usually provides reasonable bandwidth estimates for a wide range of datasets. However , it is important to note that this rule of thumb may not always have optimal results, especially for non-Gaussian or multimodal distributions. In such cases, a modified bandwidth selection, such as cross-validation or even applying a log transformation (if the data is right-skewed), may be preferable.
How it works:
This indicator computes the bandwidth volatility using returns, which are used in the standard deviation calculation. It then estimates the bandwidth based on either the Silverman rule of thumb or a modified version considering the interquartile range. The percentile ranks of the bandwidth estimate are then used to visualize the volatility levels, identify high and low volatility periods, and show them with colors.
Modified Rule of thumb Bandwidth:
The modified rule of thumb bandwidth formula combines elements of standard deviations and interquartile ranges, scaled by a multiplier of 0.9 and inversely with a number of periods. This modification aims to provide a more robust and adaptable bandwidth estimation method, particularly suitable for financial time series data with potentially skewed or heavy-tailed data.
Formula for Modified Rule of Thumb Bandwidth:
h = 0.9 * min(σ, (IQR/1.34))*n^(-1/5)
This modification introduces the use of the IQR divided by 1.34 as an alternative to the standard deviation. It aims to improve the estimation, mainly when the underlying distribution deviates from a perfect Gaussian distribution.
Analysis
Rule of thumb Bandwidth: Provides a broader perspective on volatility trends, smoothing out short-term fluctuations and focusing more on the overall shape of the density function.
Historical Volatility: Offers a more granular view of volatility, capturing day-to-day or intra-period fluctuations in asset prices and returns.
Modelling Requirements
Rule of thumb Bandwidth: Provides a broader perspective on volatility trends, smoothing out short-term fluctuations and focusing more on the overall shape of the density function.
Historical Volatility: Offers a more granular view of volatility, capturing day-to-day or intra-period fluctuations in asset prices and returns.
Pros of Bandwidth as a volatility measure
Robust to Data Distribution: Bandwidth volatility, especially when estimated using robust methods like Silverman's rule of thumb or its modifications, can be less sensitive to outliers and non-normal distributions compared to some other measures of volatility
Flexibility: It can be applied to a wide range of data types and can adapt to different underlying data distributions, making it versatile for various analytical tasks.
How can traders use this indicator?
In finance, volatility is thought to be a mean-reverting process. So when volatility is at an extreme low, it is expected that a volatility expansion happens, which comes with bigger movements in price, and when volatility is at an extreme high, it is expected for volatility to eventually decrease, leading to smaller price moves, and many traders view this as an area to take profit in.
In the context of this indicator, low volatility is thought of as having the green color, which indicates a low percentile value, and also being below the moving average. High volatility is thought of as having the yellow color and possibly being above the moving average, showing that you can eventually expect volatility to decrease.

Supertrend x4 w/ Cloud FillSuperTrend is one of the most common ATR based trailing stop indicators.
The average true range (ATR) plays an important role in 'Supertrend' as the indicator uses ATR to calculate its value. The ATR indicator signals the degree of price volatility. In this version you can change the ATR calculation method from the settings. Default method is RMA, when the alternative method is SMA.
The indicator is easy to use and gives an accurate reading about an ongoing trend. It is constructed with two parameters, namely period and multiplier.
The implementation of 4 supertrends and cloud fills allows for a better overall picture of the higher and lower timeframe trend one is trading a particular security in.
The default values used while constructing a supertrend indicator is 10 for average true range or trading period.
The key aspect what differentiates this indicator is the Multiplier. The multiplier is based on how much bigger of a range you want to capture. In our case by default, it starts with 2.636 and 3.336 for Set 1 & Set 2 respectively giving a narrow band range or Short Term (ST) timeframe visual. On the other hand, the multipliers for Set 3 & Set 4 goes up to 9.736 and 8.536 for the multiplier respectively giving a large band range or Long Term (LT) timeframe visual.
A ‘Supertrend’ indicator can be used on equities, futures or forex, or even crypto markets and also on minutes, hourly, daily, and weekly charts as well, but generally, it fails in a sideways-moving market. That's why with this implementation it enables one to stay out of the market if they choose to do so when the market is ranging.
This Supertrend indicator is modelled around trends and areas of interest versus buy and sell signals. Therefore, to better understand this indicator, one must calibrate it to one's need first, which means day trader (shorter timeframe) vs swing trader (longer time frame), and then understand how it can be utilized to improve your entries, exits, risk and position sizing.
Example:
In this chart shown above using SPX500:OANDA, 15R Time Frame, we can see that there is at any give time 1 to 4 clouds/bands of Supertrends. These four are called Set 1, Set 2, Set 3 and Set 4 in the indicator. Set's 1 & 2 are considered short term, whereas Set's 3 & 4 are considered long term. The term short and long are subjective based on one's trading style. For instance, if a person is a 1min chart trader, which would be short term, to get an idea of the trend you would have to look at a longer time frame like a 5min for instance. Similarly, in this cases the timeframes = Multiplier value that you set.
Optional Ideas:
+ Apply some basic EMA/SMA indicator script of your choice for easier understanding of the trend or to allow smooth transition to using this indicator.
+ Split the chart into two vertical layouts and applying this same script coupled with xdecow's 2 WWV candle painting script on both the layouts. Now you can use the left side of the chart to show all bearish move candles only (make the bullish candles transparent) and do the opposite for the right side of the chart. This way you enhance focus to just stick to one side at a given time.
Credits:
This indicator is a derivative of the fine work done originally by KivancOzbilgic
Here is the source to his original indicator: ).
Disclaimer:
This indicator and tip is for educational and entertainment purposes only. This not does constitute to financial advice of any sort.

Nifty 50 5mint Strategy
The script defines a specific trading session based on user inputs. This session is specified by a time range (e.g., "1000-1510") and selected days of the week (e.g., Monday to Friday). This session definition is crucial for trading only during specific times.
Lookback and Breakout Conditions:
The script uses a lookback period and the highest high and lowest low values to determine potential breakout points. The lookback period is user-defined (default is 10 periods).
The script also uses Bollinger Bands (BB) to identify potential breakout conditions. Users can enable or disable BB crossover conditions. BB consists of an upper and lower band, with the basis.
Additionally, the script uses Dema (Double Exponential Moving Average) and VWAP (Volume Weighted Average Price) . Users can enable or disable this condition.
Buy and Sell Conditions:
Buy conditions are met when the close price exceeds the highest high within the specified lookback period, Bollinger Bands conditions are satisfied, Dema-VWAP conditions are met, and the script is within the defined trading session.
Sell conditions are met when the close price falls below the lowest low within the lookback period, Bollinger Bands conditions are satisfied, Dema-VWAP conditions are met, and the script is within the defined trading session.
When either condition is met, it triggers a "long" or "short" position entry.
Trailing Stop Loss (TSL):
Users can choose between fixed points ( SL by points ) or trailing stop (Profit Trail).
For fixed points, users specify the number of points for the stop loss. A fixed stop loss is set at a certain distance from the entry price if a position is opened.
For Profit Trail, users can enable or disable this feature. If enabled, the script uses a "trail factor" (lookback period) to determine when to adjust the stop loss.
If the price moves in the direction of the trade and reaches a certain level (determined by the trail factor), the stop loss is adjusted, trailing behind the price to lock in profits.
If the close price falls below a certain level (lowest low within the trail factor(lookback)), and a position is open, the "long" position is closed (strategy.close("long")).
If the close price exceeds a certain level (highest high within the specified trail factor(lookback)), and a position is open, the "short" position is closed (strategy.close("short")).
Positions are also closed if they are open outside of the defined trading session.
Background Color:
The script changes the background color of the chart to indicate buy (green) and sell (red) signals, making it visually clear when the strategy conditions are met.
In summary, this script implements a breakout trading strategy with various customizable conditions, including Bollinger Bands, Dema-VWAP crossovers, and session-specific rules. It also includes options for setting stop losses and trailing stop losses to manage risk and lock in profits. The "trail factor" helps adjust trailing stops dynamically based on recent price movements. Positions are closed under certain conditions to manage risk and ensure compliance with the defined trading session.
CE=Buy, CE_SL=stoploss_buy, tCsl=Trailing Stop_buy.
PE=sell, PE_SL= stoploss_sell, tpsl=Trailing Stop_sell.
Remember that trading involves inherent risks, and past performance is not indicative of future results. Exercise caution, manage risk diligently, and consider the advice of financial experts when using this script or any trading strategy.

IV Squeeze - Sunil Bhave This script calculates both Bollinger Bands and Keltner Channels on a 5-minute chart. It identifies IV squeeze conditions when the lower Bollinger Band is above the lower Keltner Channel and the upper Bollinger Band is below the upper Keltner Channel. When a squeeze is detected, it plots a red triangle below the chart bars and alerts you with a message.
Please note that this script is for educational purposes only.

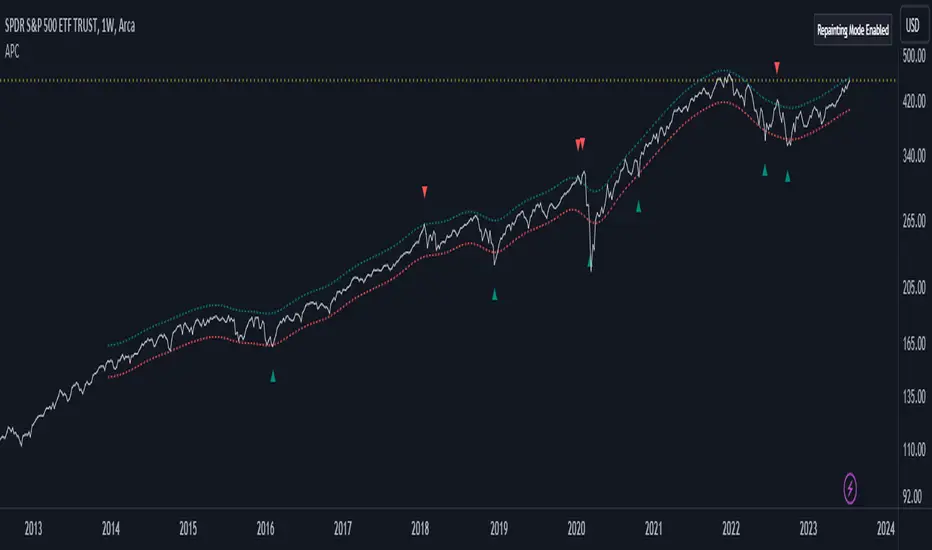
Adaptive Price Channel (log scale)The field of technical analysis is consistently expanding, with numerous indicators used for market forecasting. Amongst them, a novel indicator dubbed the Adaptive Price Channel (log scale), inspired by the renowned Nadaraya-Watson Envelope (LuxAlgo) from LuxAlgo, is gaining traction for its distinctive features and versatility. Unlike its predecessor, the Adaptive Price Channel (log scale) is applicable on a logarithmic scale, thereby allowing it to be utilized on both smaller and larger timeframes.
1. Key Features
The Adaptive Price Channel (log scale) is founded on the trading view Pinescript language, version 5, with its primary aim to maximize the versatility and scalability of trading indicators. It allows traders to adapt it according to their preferred timeframe, thereby making it applicable for a wide range of trading strategies.
Its bandwidth can be adjusted through the input parameters, offering traders the flexibility to manipulate the indicator according to their strategic requirements. Furthermore, it provides an option for repainting smoothing. This option enables users to control the repainting effect in which the historical output of the indicator may change over time. When disabled, the indicator provides the endpoints of the calculations, ensuring consistency in historical values.
Moreover, the Adaptive Price Channel (log scale) allows for color customization, thereby improving visibility and user-friendliness. The colors of the indicator's upward and downward directions can be changed according to the user's preference.
2. Working Mechanism
The Adaptive Price Channel (log scale) uses the logarithm of the source, which is typically the closing price of a trading instrument. It leverages a Gaussian function that exponentially decreases the further the price moves away from the mean, accounting for both positive and negative values. The bandwidth of the Gaussian function can be adjusted to adapt to different market conditions.
Additionally, the Adaptive Price Channel (log scale) features an array of 500 lines for each bar, which helps in defining the boundaries or envelope for price movements. The calculations are executed using the Nadaraya-Watson estimator, which uses kernel regression for non-parametric analysis.
The calculated values for the upper and lower bounds of the envelope are then converted back from the logarithmic scale using the exponential function. This calculation process continues for each bar until the last bar in the data set.
To ensure optimal performance, the Adaptive Price Channel (log scale) uses dynamic repainting. If the repainting mode is enabled, it adjusts the smoothing of the indicator for the entire historical data, making the results more accurate.
3. Visualization and Alerts
The Adaptive Price Channel (log scale) offers an array of visual aids, including labels and plots. The upper and lower bounds of the envelope are plotted, and the indicator triggers labels at points where the closing price crosses these boundaries. These labels serve as alerts for potential trading opportunities.
4. Conclusion
The Adaptive Price Channel (log scale) is an innovative and adaptable trading indicator, drawing inspiration from its predecessor but introducing unique features to increase its versatility. By providing a repainting option, it ensures consistent historical values, thereby enhancing the reliability of the indicator. Furthermore, the capability to operate on a logarithmic scale broadens its usability for different timeframes. The Adaptive Price Channel (log scale) is a powerful tool for any trader, facilitating a better understanding of market dynamics, and enabling more informed decision-making.
Grid Strategy with MA0. Preface
Hello traders,
This is a strategy script that allows you to utilize a Grid Strategy using moving averages.
It is very simple, but I decided to post it because it was hard to find such shared open-source codes in Pine Script.
1. Main
This is a very simple trading method.
Based on the moving average line you set, if the price drops by a certain ATR (or percent) below it, you buy, and when it goes back up, you sell.
In basic settings, you choose the moving average line and its length, and decide how much to set the distance between each grid through the 'Band Multiplier/Percent' item.
I believe that it is advantageous to widen the bandwidth for stocks with strong upward momentum.
2. Conclusion
I have confirmed that this works better in the stock market than in the crypto market,
and that it is suitable for use on index stocks like NASDAQ because it follows trends.
In addition, through backtesting, I have confirmed that this grid strategy is more suitable for buying strategies than selling strategies, so I uploaded it as a strategy focused on buying strategies.
Personally, I have developed my own strategy by adjusting buying and selling strategies according to trends and managing risks.
I hope you can use this to create a script that suits you.
Thank you.

Visible Range Linear Regression Channel [vnhilton](OVERVIEW)
This indicator calculates the linear regression channel for the visible bars shown on the chart instead of the traditional fixed length linear regression channel TradingView provides (and is more accurate I believe). Inspired by TradingView's Linear Regression Channel and Visible Average Price indicator, and the DAS Trader linear regression indicator.
(FEATURES)
- Ability to extend lines to the right
- Show/hide individual lines
- Adjust standard deviation of bands
- Adjust line style and width of basis and band lines
- Change individual line colours and plot fills between the lines
(DIFFERENCES)
If you compare this indicator to TradingView's Linear Regression Channel, you will notice some differences (as of 11th June, 2023). Differences and reasons are:
1) The intercept is wrong. The formula TradingView uses to calculate the intercept includes the addition of the gradient, which I believe is incorrect. Difference #2 is also why the intercept is wrong. This indicator omits that addition. This was verified by comparing the gradient calculated in this indicator with the gradient determined by Excel with the same data.
2) The gradient is "wrong". In quotations as essentially TradingView's code attempts to find the line of best fit, with the y-axis on the most recent bar instead of the oldest bar. This leads to the gradient being the opposite to the gradient found in this indicator, which isn't wrong, but the later formula used to calculate the intercept doesn't take this into account, resulting in an incorrect intercept value. The gradient and intercept values in this indicator matches those found in Excel.
3) Standard deviation bands of both indicators. I believe the code TradingView uses to calculate standard deviation is incorrect (basing this just through visuals). This indicator uses the array.stdev function to find the correct value (verified with Excel numbers).

Range of a source displayed in thirdsThis indicator will take the value of any external source input and display how it has changed over time (the lookback period in settings). For the purposes of display here I'm using the WT1 line from Wavetrend with Crosses by LazyBear to provide a source input.
The highest and lowest value of the source over the lookback period are used to determine the highest and lowest point - the green and red lines at the top and bottom of the bands. This region is then mathematically split into three, such that the source (and its optional moving average line) can be defined as being in the top third, the middle or the bottom third.
Applications for this could be in risk management where you may wish to take on a larger position size when a certain indicator is in the top third, or decide that you want to enter / leave positions when the source crosses in / out of the extreme points.

WillyCycle Oscillator&DoubleMa/ErkOzi/version 2This oscillator can be customized by adjusting the length of the Willy period, the length of Willy's EMA, and the upper and lower bands. The upper and lower bands help traders identify overbought and oversold conditions.
The WillyCycle Oscillator is a technical analysis tool used to measure the momentum of an asset and identify overbought and oversold conditions based on the price range of a specific period and calculating the percentage of the closing price in that range. The WillyCycle Oscillator consists of two main components: Willy and Willy's EMA. The Willy component is the percentage calculation of the asset's price range, and Willy's EMA is the exponential moving average of the Willy component. Willy's EMA is used to smooth out the Willy component and make it easier to identify trends.
*** When the oscillator is above the 80 level, it indicates that the asset is overbought, and when it is below the 20 level, it indicates that the asset is oversold. Traders can use these levels as a guide for buying and selling signals.
***Traders can also use the WillyCycle Oscillator to identify trend reversals. When the oscillator rises above the 50 level, it signals a potential uptrend, and when it falls below the 50 level, it signals a potential downtrend.
***I have added a smoothed line option to the WillyCycle Oscillator, which allows traders to see a more smoothed version of the oscillator. This option can be enabled by setting the 'smoothed' input to true. The default value for the smoothed line is 15.
***We have also changed the value range of the WillyCycle Oscillator from -100 to 100 to 0 to 100. This change was made to make the oscillator more user-friendly and easier to read.
In conclusion, the WillyCycle Oscillator is a versatile tool that can help traders identify potential trading opportunities and trend reversals. Traders can customize the oscillator to fit their trading style and preferences. Adding a smoothed line and changing the value range can enhance the user experience and make the oscillator easier to use.

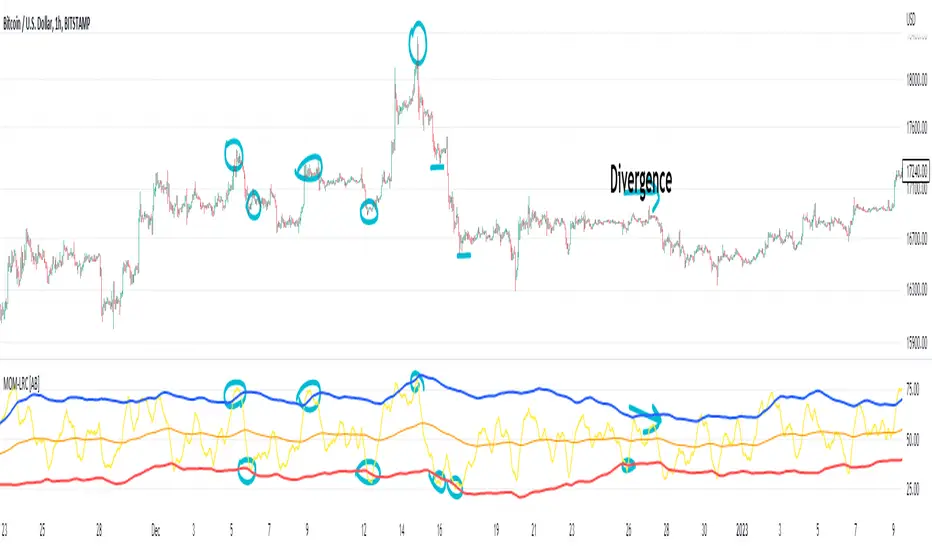
(Very promising) [Abdullah Ahmed] Momentum indicator V.1Description: MOM-LRC is a powerful technical analysis indicator designed to provide traders with signals based on the momentum of an asset's price and its deviation from its mean value. The indicator calculates the exponential RSI and uses a custom function to determine the percentage change from the mean. The upper and lower bands of the momentum channel are then calculated using linear regression of the rate of change from the mean. The channel multiplier can be adjusted to increase or decrease the sensitivity of the indicator.
How to use :
1 - Using MOM-LRC , look for buy signals when the price of the asset is below the lower border of the channel and retracing up. The opposite is true in the case of sell signals.
2 - It is also used in the case of negative and positive divergences, just as you use RSI
The indicator can be used on any time frame and any asset, making it a versatile tool for traders of all levels.
features:
Calculates exponential RSI and percentage change from the mean
Uses linear regression to calculate upper and lower bands of momentum channel
Adjustable channel multiplier for increased sensitivity
Suitable for any time frame and any asset
Happy trading!
Price Heat MapWhat does this chart show? Take the highest high and lowest low of 200 bars. Divide that into 20 chunks. The more time the price spends in one of those 1/20th pockets, the brighter it is lit up on the chart. Number of bars back can be modified to around 500. It starts to chug beyond that. Brightness level of heat map can be adjusted. 0.5 is default. 1 = brighter, 0 = dimmer. Use on any time frame. When price moves out of a hot zone, it can move very quickly. There's no trading strategy here, just something to help you visualize recent price action. The blue band shows the price at the center of the current "hottest" band. The yellow band is the ema (exponential moving average) of the price using the "bars back" input. --enjoy!

Impulse Alerts - Riccardo Di GiacomoThis is the Impulse indicator that allows you to receive alerts in the case one of the following situation occurs:
1) Buy Setup
- Price above Exponential Moving Average 260
- Moving Average 21 above Exponential Moving Average 260
- Moving Average 9 above Moving Average 21
- RSI(14) above 50
- Stochastic equal or below 20
2) Sell Setup
- Price below Exponential Moving Average 260
- Moving Average 21 below Exponential Moving Average 260
- Moving Average 9 below Moving Average 21
- RSI(14) below 50
- Stochastic equal or above 80
The Bollinger Bands represents another useful information:
- If the price is near the upper band when the first situation occurs, it is another green light, otherwise be careful
- If the price is near the lower band when the second situation occurs, it is another green light, otherwise be careful

Oscillator ExtremesThe Oscillator Extremes indicator plots the normalized positioning of the selected oscillator versus the Bollinger Bands' upper and lower boundaries. Currently, this indicator has four different oscillators to choose from; RSI, CMO, CCI, and ROC.
When the oscillator pushes towards one extreme, it will bring the value of the prevailing line closer to zero. If the bullish or bearish line crosses the zero line, the oscillator is past the extreme of the Bollinger Band.
Example: If the RSI crosses over the upper boundary of the Bollinger, the bullish(green) line will cross under the zero line.
Crossovers of the bullish and bearish lines can indicate a shift in momentum and are a signal. Where the line crossing under, towards zero, is the prevailing trend. The plotted lines will highlight green(bullish) or red(bearish) to show the prevailing trend. This is similar to a DI+- crossover that is commonly associated with the ADX.
We have included an optional normalized ADX to help validate signals. The ADX will change color based on the slope of the ADX. Purple indicates a positive slope and white for a negative slope.

Colorful Channelwhat is "Colorful Channel"?
it is a overbought - oversold indicator.
what it does?
It fills the area between the upper band of the channel and the price line with green, the area between the lower band of the channel and the price line with red color and applies a transparency to these colors according to the distance of the price from the channel lines. thus allowing users to get an idea of ??the current value of the price.
how it does it?
subtracts the percentage of the price from the lower channel from the transparency ratio of the red color, and the percentage of the price from the upper band from the transparency ratio of the green color. thus, a different transparency value is obtained for each percentile. In addition, the transparency rate can be changed with a multiplier determined by the users.
how to use it?
In the "lenght" section, you select the number of bars that the indicator will base backwards on. For example, if length=100, the indicator determines the upper and lower bands according to the distances from the highest and lowest values ??within 100 bar. so the length part works like donchian channels.
You can change the transparency ratio of the colors in the "transp" section.
1 saat transp
yan trend
4 saat

GT 5.1 Strategy═════════════════════════════════════════════════════════════════════════
█ OVERVIEW
People often look an indicator in their technical analysis to enter a position. We may also need to look at the signals of one or more indicators to verify the signals given by some indicators. In this context, I developed a strategy to test whether it really works by choosing some of the indicators that capture trend changes with the same characteristics. Also, since the subject is to catch the trend change, I thought it would be right to include an indicator using the heikin ashi logic. By averaging and smoothing the market noise, Heiken Ashi makes it easier to detect the direction of the trend helps to see possible reversal points on the chart. However, it should be noted that Heiken Ashi is a lagging indicator.
I picked 5 different indicators (but their purpose are similar) and combined them to produce buy and sell signals based on your choice(not repaint). First of all let's get some information about our indicators. So you will understand me why i picked these indicators and what is the meaning of their signals.
1 — Coral Trend Indicator by LazyBear
Coral Trend Indicator is a linear combination of moving averages, all obtained by a triple or higher order exponential smoothing. The indicator comes with a trend indication which is based on the normalized slope of the plot. the usage of this indicator is simple. When the color of the line is green that means the market is in uptrend. But when the color is red that means the market is in downtrend.
As you see the original indicator it is simple to find is it in uptrend or downtrend.
So i added a code to find when the color of the line change. When it turns green to red my script giving sell signals, when it turns red to green it gives buy signals.
I hide the candles to show you more clearly what is happening when you choose only Coral Strategy. But sometimes it is not enough only using itself. Even if green dots turn to red it continues in uptrend. So we need a to look another indicator to approve our signal.
2 — SSL channel by ErwinBeckers
Known as the SSL , the Semaphore Signal Level channel is an indicator that combines moving averages to provide you with a clear visual signal of price movement dynamics. In short, it's designed to show you when a price trend is forming. This indicator creates a band by calculating the high and low values according to the determined period. Simply if you decide 10 as period, it calculates a 10-period moving average on the latest 10 highs. Calculate a 10-period moving average on the latest 10 lows. If the price falls below the low band, the downtrend begins, if the price closes above the high band, the uptrend begins. Lets look the original form of indicator and learn how it using.
If the red line is below and the green band is above, it means that we are in uptrend, and if it is on the opposite side, it means that we are in downtrend. Therefore, it would be logical to enter a position where the trend has changed. So i added a code to find when the crossover has occured.
As you see in my strategy, it gives you signals when the trend has changed. But sometimes it is not enough only using this indicator itself. So lets look 2 indicator together in one chart.
Look circle SSL is saying it is in downtrend but Coral is saying it has entered in uptrend. if we just look to coral signal it can misleads us. So it can be better to look another indicator for validating our signals.
3 — Heikin Ashi RSI Oscillator by JayRogers
The Heikin-Ashi technique is used by technical traders to identify a given trend more easily. Heikin-Ashi has a smoother look because it is essentially taking an average of the movement. There is a tendency with Heikin-Ashi for the candles to stay red during a downtrend and green during an uptrend, whereas normal candlesticks alternate color even if the price is moving dominantly in one direction. This indicator actually recalculates the RSI indicator with the logic of heikin ashi. Due to smoothing, the bars are formed with a slight lag, reflecting the trend rather than the exact price movement. So lets look the original version to understand more clearly. If red bars turn to green bars it means uptrend may begin, if green bars turn to red it means downtrend may begin.
As you see HARSI giving lots of signal some of them is really good but some of them are not very well. Because it gives so much signals Now i will change time period and lets look same chart again.
Now results are better because of heikin ashi's logic. it is not suitable for day traders, it gives more accurate result when using the time period is longer. But it can be useful to use this indicator in short time periods using with other indicators. So you may catch the trend changes more accurately.
4 — MACD DEMA by ToFFF
This indicator uses a double EMA and MACD algorithm to analyze the direction of the trend. Though it might seem a tough task to manage the trades with the help of MACD DEMA once you know how the proper way to interpret the signal lines, it will be an easy task.
This indicator also smoothens the signal lines with the time series algorithm which eventually makes the higher time frame important. So, expecting better results in the lower time frame can result in big losses as the data reading from the MACD DEMA will not be accurate. In order to understand the function of this indicator, you have to know the functions of the EMA also.
The exponential moving average tends to give more priority to the recent price changes. So, expecting better results when the volatility is very high is a very risky approach to trade the market. Moreover, the MACD has some lagging issues compared to the EMA, so it is super important to use a trading method that focuses on the higher time frame only. What does MACD 12 26 Close 9 mean? When the DEMA-9 crosses above the MACD(12,26), this is considered a bearish signal. It means the trend in the stock – its magnitude and/or momentum – is starting to shift course. When the MACD(12,26) crosses above the DEMA-9, this is considered a bullish signal. Lets see this indicator on Chart.
When the blue line crossover red line it is good time to buy. As you see from the chart i put arrows where the crossover are appeared.
When the red line crossover blue line it is good time to sell or exit from position.
5 — WaveTrend Oscillator by LazyBear
This is a technical indicator that creates high and low bands between two values. It then creates a trend indicator that draws waves with highs and lows within these boundaries. WaveTrend is a widely used indicator for finding direction of an asset.
Calculation period: number of candles used to calculate WaveTrend, defaults to 10. Averaging period: number of candles used to average WaveTrend, defaults to 21.
As you see in chart when the lines crossover occured my strategy gives buy or sell signals.
═════════════════════════════════════════════════════════════════════════
█ HOW TO USE
I hope you understand how the indicators I mentioned above work and what they are used for. Now, I will explain in detail how to use the strategy I have created.
When you enter the settings section, you will see 5 types of indicators. If you want to use the signals of the indicators, simply tick the box next to the indicators. Also, under each option there is an area where you can set the "lookback". This setting is a field that will make the signals overlap when you select more than one option. If you are going to trade with only one option, you should make sure that this field is 0. Otherwise, it may continue to generate as many signals as you choose.
Lets see in chart for easy understanding.
As you see chart, if i chose only HARSI with lookback 0 (HARSI and CORAL should be 1 minumum because of algorithm-we looking 1 bar before, others 0 because we are looking crossovers), it will give signals only when harsı bar's color changed. But when i changed Lookback as 7 it will be like this in chart.
Now i will choose 2 indicator with settings of their lookback 0.
As you see it will give signals when both of them occurs same time. But HARSI is an indicator giving very early signal so we can enter position 5-6 bars after the first bar color change. So i will change HARSI Lookback settings as 7. Lets look what happens when we use lookback option.
So it wil be useful to change lookback settings to find best signals in each time period and in each symbol. But it shouldnt be too high. Because you can be late to catch trend's starting.
this is an image of MACD and WAVE trend used and lookback option are both 6.
Now lets see an example with 3 options are chosen with lookback option 11-1-5
Now lets talk about indicators settings. After strategy options you will see each indicators settings, you can change their settings as you desired. So each indicators signal will be changed according to your adjustment.
I left strategy options with default settings. You can change it manually as if you want.
═════════════════════════════════════════════════════════════════════════
█ LIMITATIONS: Don't rely on non-standard charts results. For example Heikin Ashi is a technical analysis method used with the traditional candlestick chart.Heikin Ashi vs. Candlestick Chart: The decisive visual difference between Heikin Ashi and the traditional chart is that Heikin Ashi flattens the traditional candlestick chart using a modified formula.
The primary advantage of Heikin Ashi is that it makes the chart more reader-friendly and helps users identify and analyze trends .
Because Heikin Ashi provides averaged price information rather than real-time price and reacts slowly to volatility — not suitable for scalpers and high-frequency traders. I added HARSI indicator as a supportive signal because it is useful with using CORAL and SSL channel indicators. If you change your candle types to Heikin Ashi , your profit will change in good way but dont rely on it.
═════════════════════════════════════════════════════════════════════════
█ THANKS:
Special thanks to authors of the scripts that i used.
@LazyBear and @ErwinBeckers and @JayRogers and @ToFFF
═════════════════════════════════════════════════════════════════════════
█ DISCLAIMER
Any trade decisions you make are entirely your own responsibility.

Range Detector Indicator [Misu]█ This indicator shows an upper and lower band based on Highs and Lows.
Depending on this, the indicator interprets a ranging market, an uptrend or a downtrend.
█ Usages:
The purpose of this indicator is to identify when the price is ranging.
It's also used to identify changes in trends, breaking points, and trend reversals.
But it can also be used to show resistance or support levels.
█ Features:
> Price Action Change Alerts
> Price Action Change Labels
> Color Bars
> Show Bands
█ Parameters:
Deviation: A parameter used to calculate pivots.
Depth: A parameter used to calculate pivots.
Activate Range Detection: Check the box to activate range detection.
Band% Offset: A factor that is used to vary the bands offset.

BB-EMA-MAWikipedia: Bollinger Bands are a type of statistical chart characterizing the prices and volatility over time of a financial instrument or commodity, using a formulaic method propounded by John Bollinger in the 1980s. Financial traders employ these charts as a methodical tool to inform trading decisions, control automated trading systems, or as a component of technical analysis. Bollinger Bands display a graphical band (the envelope maximum and minimum of moving averages, similar to Keltner or Donchian channels) and volatility (expressed by the width of the envelope) in one two-dimensional chart.
If you set Type = 2 then it will use EMA average for Bollinger bands .
If you set Type = 1 then it will use MA average for Bollinger bands .
Default settings is moving average with period 50
When price move to standard Deviation (std) +2 and std +3 is signal for sell ( selling zone)
When price move to standard Deviation (std) -2 and std -3 is signal for sell ( buying zone)

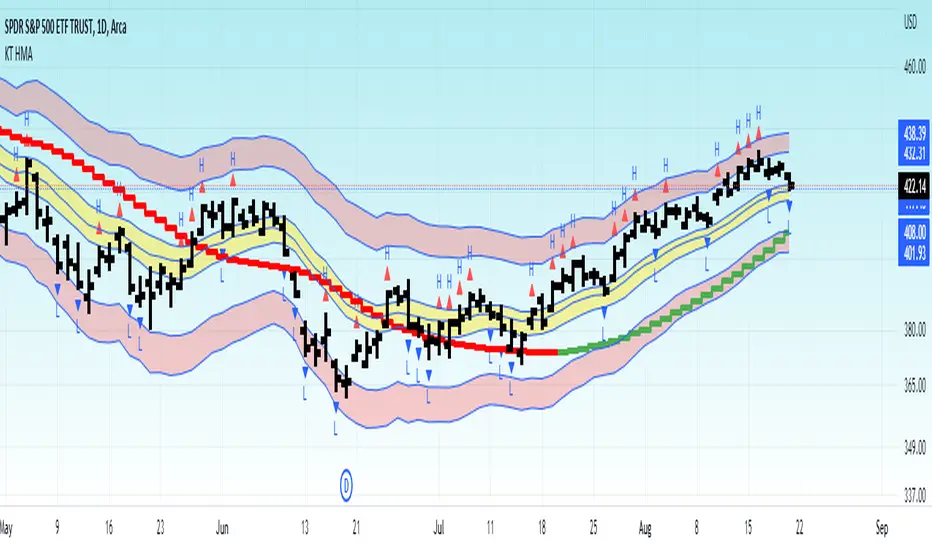
KT HMAOverview :
This indicator is an experiment to combine one of the volatility concepts (ATR), weighted MA and price movements to help visualize current market condition.
Red Band : ATR volatility bands with 2nd and 3rd standard deviation.
Yellow Band : Moving Average band
HMA : Green/Red >> Shows current trend. Using HMA to emphasize on recent price points rather than older one.
-----------------
Disclaimer
My Scripts/Indicators/Ideas/Systems including above ones are only for educational purposes. The information contained in the Scripts/Indicators/Ideas does not constitute financial advice or a solicitation to buy or sell any securities of any type. All investments involve risk, and the past performance of a security, industry, sector, market, financial product, trading strategy, backtest, or individual's trading does not guarantee future results or returns. Do not trade with capital that you can not afford to lose. Investors are fully responsible for any investment decisions they make. Such decisions should be based solely on an evaluation of their financial circumstances, investment objectives, risk tolerance, and liquidity needs.
Relative Andean ScalpingThis is an experimental signal providing script for scalper that uses 2 of open source indicators.
First one provides the signals for us called Andean Oscillator by @alexgrover . We use it to create long signals when bull line crosses over signal line while being above the bear line. And reverse is true for shorts where bear line crosses over signal line while being above bull line.
Second one is used for filtering out low volatility areas thanks to great idea by @HeWhoMustNotBeNamed called Relative Bandwidth Filter . We use it to filter out signals and create signals only when the Relative Bandwith Line below middle line.
The default values for both indicators changed a bit, especially used linreg values to create relatively better signals. These can be changed in settings. Please be aware that i did not do extensive testing with this indicator in different market conditions so it should be used with caution.

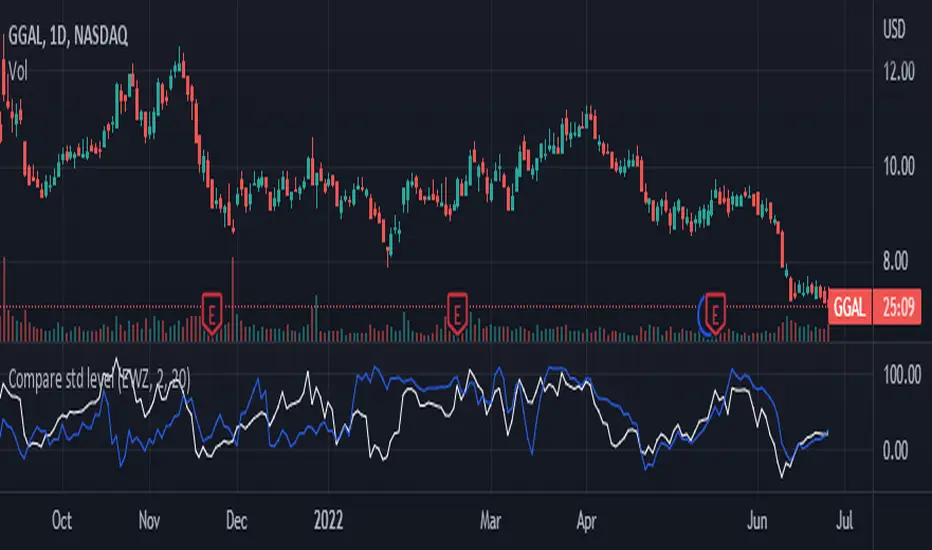
Compare std levelIt is used to compare symbol with different magnitudes and volatilities. It is compared by the level within its range of standard deviations.
Visually, we are comparing where the price is in its Bollinger Band , for each symbol.
100 means that the price is near the upper band. 0 means that the price is near the lower band