Co-relation and St-deviation Strategy - BNB/USDT 15minThis indicator based on statistical analysis. it uses standard deviation and its co-relation to price action to generate signals. and following indicators has been used to calculate standard deviation and its co-relation values. finally it is capable to identify market changes in bottoms to pic most suitable points.
1. Parabolic SAR (parabolic stop and reverse)
2. Supertrend
3. Relative strength index (RSI)
4. Money flow index (MFI)
5. Balance of Power
6. Chande Momentum Oscillator
7. Center of Gravity (COG)
8. Directional Movement Index (DMI)
9. Stochastic
10. Symmetrically weighted moving average with fixed length
11. True strength index (TSI)
12. Williams %R
13. Accumulation/distribution index
14. Intraday Intensity Index
15. Negative Volume Index
16. Positive Volume Index
17. On Balance Volume
18. Price-Volume Trend
19. True range
20. Volume-weighted average price
21. Williams Accumulation/Distribution
22. Williams Variable Accumulation/Distribution
23. Simple Moving Average
24. Exponential Moving Average
25. CCI (commodity channel index)
26. Chop Zone
27. Ease of Movement
28. Detrended Price Oscillator
29. Advance Decline Line
30. Bull Bear Power
Search in scripts for "bear"

Chanu Delta RSI StrategyThis strategy is built on the Chanu Delta RSI , which indicates the strength of the Bitcoin market. The problem with the previous Chanu Delta Strategy was that it was simply based on the price difference between the two Bitcoin markets, so there was no universality. However, this new Chanu Delta RSI strategy solves the problem by introducing an RSI that compares the price difference trend.
When the Chanu Delta RSI hits “Bull Level” and “Bear Level” and closes the candle, long and short signals are triggered respectively. The example shown on the screen is a default setting optimized for a 4-hour candlestick strategy based on the Bybit BTCUSDT futures market. You can use it by adjusting the setting value and modifying it to suit you.
This strategy is selectable from both reference and large amplitude BTCUSD markets in order to enable fine backtesting. I recommend using BYBIT:BTCUSDT for the reference market and COINBASE:BTCUSD for the large amplitude market.
(Note) Using the "Chanu Delta RSI" to know the current indicator value in real time, it is convenient to predict the signal of the strategy.
(Note) Because the Chanu Delta RSI represents the price difference based on the Bybit BTCUSDT futures market, backtesting is possible from March 2020.
_____________________________________________________________
이 전략은 비트코인 시장의 강점을 나타내는 Chanu Delta RSI를 기반으로 합니다. 기존 Chanu Delta 전략의 문제점은 단순히 두 비트코인 시장의 가격차를 기준으로 하여 보편성이 없었다는 점이다. 하지만 이번 새로운 Chanu Delta RSI 전략은 가격차이 추세를 비교하는 RSI를 도입해 문제를 해결했습니다.
Chanu Delta RSI가 "Bull Level"과 "Bear Level"에 도달하고 봉마감하면 롱, 숏 신호가 각각 트리거됩니다. 화면에 보이는 예시는 Bybit BTCUSDT 선물 시장을 기반으로 한 4시간 캔들스틱 전략에 최적화된 기본 설정입니다. 설정값을 조정하여 자신에게 맞게 수정하여 사용하시면 됩니다.
이 전략은 정밀한 백테스팅을 가능하게 하기 위해 참조 및 큰 진폭 BTCUSD 시장에서 모두 선택할 수 있습니다. 참조 시장에는 BYBIT:BTCUSDT를 사용하고 큰 진폭 시장에는 COINBASE:BTCUSD를 사용하는 것이 좋습니다.
(주) "Chanu Delta RSI"를 이용하여 현재 지표 값을 실시간으로 알 수 있어 전략의 시그널을 예측하는데 편리합니다.
(주) Chanu Delta RSI는 바이비트 BTCUSDT 선물시장을 기준으로 가격차이를 나타내므로 2020년 3월부터 백테스팅이 가능합니다.

TFO + ATR Strategy with Trailing Stop LossThis strategy is an experiment to learn what happens when The Trend Flex Oscillator (by Dr. John Ehlers) is used in conjunction with a volatility indicator like ATR. It was designed with cryptocurrency trading in mind.
The way I coded this experiment makes it unsuitable for bear market conditions.
When applied to a bull market, this trend-following strategy will open long positions when oversold price action appear to be reversing. It will typically close a position within a few days unless it gets caught in a bear market, in which case it holds on for dear life. I have tried to make back-testing very simple, but you should never trust it. It's merely and interesting tool for adjusting the many parameters that I've made editable in the configuration window. Those values include the ATR and TFO parameters, as well as setting a trailing stop loss. When closing a position, the strategy can optionally be told to ignore the trend analysis and only obey the trailing stop loss value. I've made an attempt to allow the user to define the minimum profit necessary to allow the strategy to close all all positions. In my observations, the 2H candlestick charts seem to produce the best results, although the parameters of the strategy could theoretically be adjusted to suit other time periods.
In summary...
This strategy has a bias for HODL (Holds on to Losses) meaning that it provides NO STOP LOSS protection!
Also note that the default behavior is designed for up to 15 open long orders, and executes one order to close them all at once.
Opening a long position is predicated on The Trend Flex Oscillator (TFO) rising after being oversold, and ATR above a certain volatility threshold.
Closing a long is handled either by TFO showing overbought while above a certain ATR level, or the Trailing Stop Loss. Pick one or both.
If the strategy is allowed to sell before a Trailing Stop Loss is triggered, you can set a "must exceed %". Do not mistake this for a stop loss.
Short positions are not supported in this version. Back-testing should NEVER be considered an accurate representation of actual trading results.
// portions © allanster (date window code)
// portions © Dr. John Ehlers (Trend Flex Oscillator)
This code is provided for educational purposes only. The results of this strategy should not be considered investment advice.
The user of this script acknowledges that it can result in serious financial loss when used as a trading tool

EMA Cross V1 for eth 4HFor ETH in Bullish Zone (Time frame 4H)
Condition Back test
- 50% of Equity (for decrease max drawdown less than 15%)
Warning : Many fake signals are in Sideway or Bearish.

A simple trading strategy for XTZ/EUR (December 2021)This is my current trading strategy for XTZ/EUR for this month of December.
It tries to avoid pumps/dumps (i.e. does not trade on big candles).
It always performs one order in each candle for the trading window of the rebalance bear/bull market indicator (check my profile for it).
It has alerts configured so that you can use it in your server/broker (just pass along the `{{strategy.order.alert_message}}` in the alert message, it will include a positive number of XTZ when to buy, or a negative number when to sell).
It does not repaint.
The amount of crypto and fiat in the portfolio can be configured in the cog.
It does not outperform buy/hold for the bull months.
Check the results in the Data Window of Trading View (please avoid the Strategy Tester, it has too many bugs and is not intended for out of the box strategies such a this one).
All code is open source.

B.Bands | Augmented | Intra-range | Long-OnlyHere you have the essential trading engine based on Bollinger Bands .
The idea behind is to trade the intra-range of the bands.
How is going to work?
Define which Bollinger Bands we want to use. Classic Bollinger Bands or Augmented Bollinger Bands . Without selecting, the algorithm doesn't show a strategy.
Define the length of the Moving Average and the Standard Deviation by default the classic 20-2.
Define the Bollinger Bands Spread Max Range (Upper-Lower) to be able to determine wheter or not you're in a price range or potential breakout.
Define data source to trigger exit and entry points.
Define profit based on Middle Band or Opposite Band.
Define Stop Loss % and activate Trailing Stop if desired with the percentage required.
Determine if you want to sell only on profit after triggering the entry signal. * Note Stop Loss remains activated.
Choose a date range if you want to study a specific period.
Bear in mind, this is the essential trading engine, open for you to test, try and improve under your requirements. You can determinate when is the ideal market to implement it based on many other indicators. Maybe you wish to change the stop loss settings for ATR, previous low, etc. Totally up to you.
Note the script comes with initial capital, fee % and slippage by deault. This may change for your assets. Make sure you define it in advance.
NOTE: If you trade assets such BTC, you must update the initial capital. By default 5000 (USD) The script doesn't support fraction trading such 0.01BTC.
Will be updated on next version.
Feel free to get in touch if you've got any question.

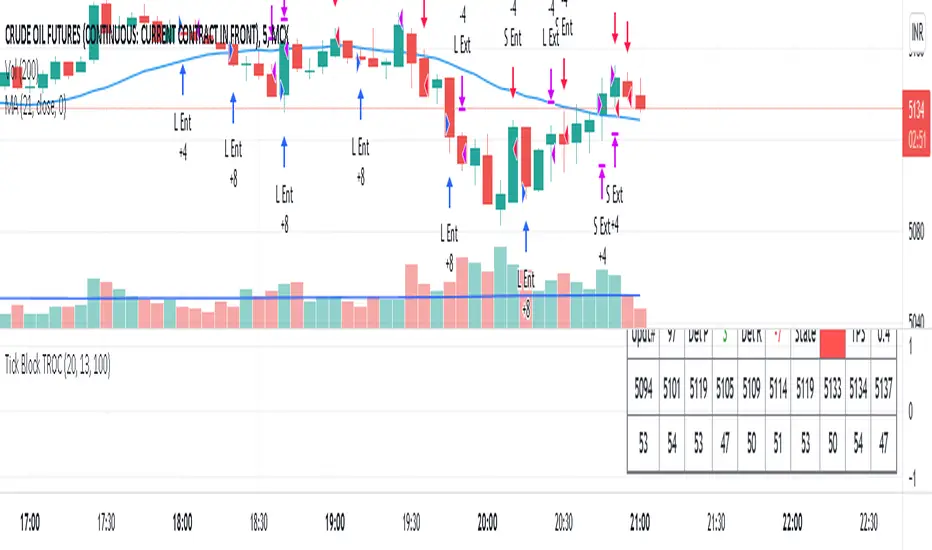
Up Down RatioWORKS ONLY IN LIVE MARKET. NO BACK TESTING POSSIBLE.
A Tick block is defined as a set of last 'n' ticks. 'n' is user specified and default is 100.
Script calculates the ratio of upticks to downticks in every tick block. This is called UDR (up down ratio)
It also calculates the lowest price in the tick block.
The price lows (in each block) are matched with UDR and looks for convergence or divergence.
Script generates entry and exit signals based on convergence/ divergence.
Profit and loss can be user defined.
Default settings work for CRUDE OIL (Indian Rupee)
Convergence is Bullish
Divergence is Bearish.
Ticks per second for the last tick block is displayed as TPS.
TPS may be used to gauge activity level and co-relates largely with volume acceleration.
NRTH_ Momentum AlgoA NRTH_ Premium Momentum Based Strategy
Comes included with the Premium Package.
Indicator features
Built-In Alerts
Visual Risk Management
Customizable Entry Rules
4 Levels of confirmation
Customizable MA Ribbon
Usage Tips
This strategy is designed for Swing Trading and Intra-Day timeframes (1hr+)
The Algo uses multiple levels of convolution and confirmation before entering a trade, best used in trending markets. utilizing Stochasitc RSI overbought and oversold levels and an 1-3 MAs to identify trends and pullbacks.
Maximize the accuracy of your signals with up to 4 levels of convolution before entering a trade, filtering out the noise as much as possible.
You can set the overbought and oversold levels required for trade entries and set the types of MAs and how many are required to confirm trending momentum
Works for all markets with the ability to customize to your liking.
Backtesting Results Info
Period 23/9/2021-15/11/2021
Entry value at $1000 with 10x leverage
Binance standard taker fee rate (0.04%)
ATR Exits : 1:2.66 RR
-------------------------------------------
Disclaimer
Copyright NRTH_ Indicators 2021.
NRTH_ and all affiliated parties are not registered as financial advisors. The products & services NRTH_ offers are for educational purposes only and should not be construed as financial advice. You must be aware of the risks and be willing to bear any level of risk to invest in financial markets. Past performance is not necessarily indicative of future results. NRTH_ and all individuals associated assume no responsibility for your trading results or investments.
All investments involve risk, and the past performance of a security, industry, sector, market, financial product, trading strategy, or individual’s trading does not guarantee future results or returns. Investors are fully responsible for any investment decisions they make. Such decisions should be based solely on an evaluation of their financial circumstances, investment objectives, risk tolerance, and liquidity needs.

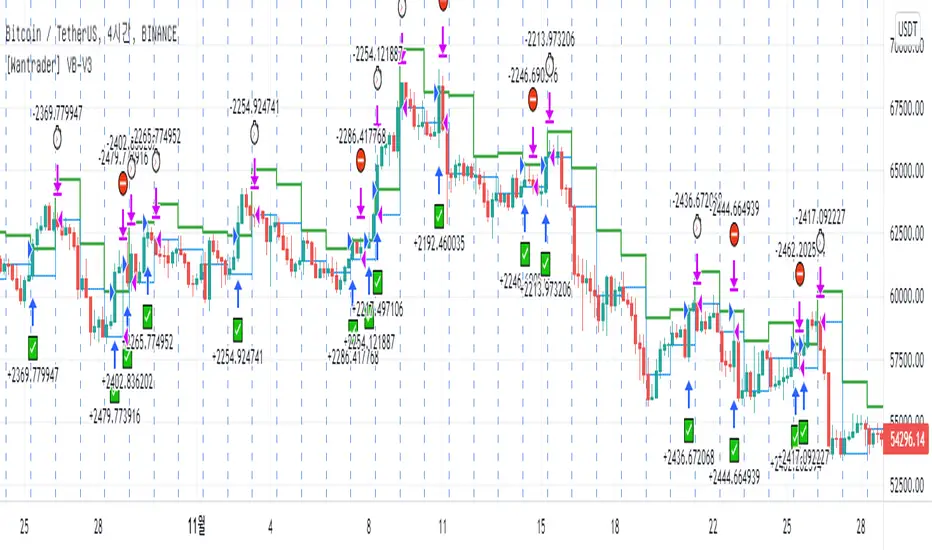
[Wantrader] Volatility Breakout Strategy V3This is the Wantrader's volatility breakthrough version 9,
which developed Larry Williams' volatility breakthrough strategy.
The following elements are included.
- Entry : Enter the market price, calculated by the volatility (TR) * ratio (K) of the previous day.
- Exit : Based on the selected time frame, closing the closing price, closing the market price,
- Stop loss: When it breaks through the entry price and buys, returns to the market price (the previous day's closing price) and changes to bear candle, stop loss.
- Long/short comparison: When short version is selected, it shows the result of short instead of long.
This strategy is a low-level strategy.
When used in practice, it can be stronger and more compliant than expected, but it is not smart.
I recommend you to develop a more hidden edge and use it as a drawing paper to create your own strategy.
Through the option settings,
I'll check if it's right for my first salary or at different times.
It will be an opportunity to think about why there is a difference in profits between Long and Short.
Also, the result shows the big difference between having and not having a loss.
I hope it will be an opportunity to break the relationship in the future.
========================================================================================
래리윌리엄스의 변동성돌파전략을 발전시킨
원트레이더 변동성돌파 버전3 입니다.
아래 요소가 포함되어있습니다.
- 진입 : 전일변동성(TR) * 비율(K) 로 계산한 진입가에, 시장가 진입
- 청산 : 선택한 타임프레임 기준으로 종가에, 시장가 청산
- 손절 : 진입가 돌파하여 매수 후, 당일 시가(전일 종가)로 돌아와서 음봉으로 바뀔때 손절
- 롱/숏 비교 : 숏버전을 선택하면 롱대신 숏으로만 처리한 결과를 보여줌
본 전략은 레벨이 낮은 전략으로
실전에서 사용 시 생각보다 강건하고 준수할 순 있으나 스마트하진 못합니다.
더 숨겨진 엣지를 개발하여 자신만의 전략을 만들기 위한 도화지 처럼 사용하시길 추천드립니다.
옵션 설정을 통해
일봉에서 잘 맞는지 다른 시간대에서 맞는지 등을 확인하고
롱과 숏의 수익의 차이는 왜 나는 것인지 고민해보는 계기가 될 것입니다.
또한 손절이 있는 것과 없는 것의 큰 차이를 결과로 확인하여
앞으로 반드시 손절을 넣게 되는 계기가 되길 기원합니다.
NRTH_ Smart SignalsA Custom Unique indicator by NRTH_
Comes included with the Premium Package.
NRTH_ Smart Signals is made up of over 5+ indicators and custom calculation methods. Get access to a full set of trading tools & relevant data all within one indicator to give you the levels of confluence you need.
Smart Signals works in any market & allows users to:
Detect the direction of trends in the price using two different algorithms designed for both trend following and contrarian traders.
Get automatic pivot point levels in real-time.
Filter out noise with the MA Trend Filter
Built-In Alerts
Visual Risk Management
Customizable Entry Rules
2 Calculation Methods
Get Confirmation
Use our MA Trend filter to detect the direction of trends for any asset & on any timeframe allowing traders to increase their confidence in positions and follow trends. The larger the cloud, the larger the trend.
Choose between the two calculation methods:
Leading
More sensitive
Designed to predict moves based on market data
Lagging
Less sensitive
Waits for confirmation signals
Both calculation methods have the possibility to adjust the sensitivity of these signals to market price variations, as well as the option to make them less sensitive to ranging markets so that you can trade only the variations you want.
The algo uses both momentum and trend calculation to find an entry, highly recommended use with the built-in MA Filter for best results.
Trade 24/7 without pressing a button
Smart Signals has integrated alerts which give you the ability to automate your signals with 3rd party applications. Simply adjust the sensitivities for your market and trade on autopilot.
You can also use Heikin Ashi Charts with the algo IF you only place limit orders on the exact price line that the trade outputs to ensure accurate real-time results
(Heikin Ashi trading is NOT recommended for automated trading, manual limit orders must be placed in order to match real-time results with backtested data)
Backtesting Results Info
Period 7/7/2021-15/11/2021
Entry value at $1000 with 10x leverage
Binance standard taker fee rate (0.04%)
ATR Exits : 1:2 RR
-------------------------------------------
Disclaimer
Copyright NRTH_ Indicators 2021.
NRTH_ and all affiliated parties are not registered as financial advisors. The products & services NRTH_ offers are for educational purposes only and should not be construed as financial advice. You must be aware of the risks and be willing to bear any level of risk to invest in financial markets. Past performance is not necessarily indicative of future results. NRTH_ and all individuals associated assume no responsibility for your trading results or investments.
All investments involve risk, and the past performance of a security, industry, sector, market, financial product, trading strategy, or individual’s trading does not guarantee future results or returns. Investors are fully responsible for any investment decisions they make. Such decisions should be based solely on an evaluation of their financial circumstances, investment objectives, risk tolerance, and liquidity needs.
Instagram

QaSH DCA DaytraderThis script takes advantage of the power of DCA implemented in the QaSH DCA Algorithm script, and it applies it to new entry conditions. A "Quickfingers Luc" mode has been added, which creates new entry orders whenever a level of support has been identified. If price breaks the support level and quickly drops down, the orders will already be in place to catch the dip. This method can even catch the 1-second long, 50% flash dips that occur in some exchanges.
Four entry conditions are included in this initial release : ASAP, Quickfingers Luc, Bullish Pivot point, and Bearish Pivot point
All order placements are customizable
All take profit % values are based on the average entry price
Take profit % values can change based on how big the price dip was
Entry condition filter has been added and it uses a variable timeframe EMA
Stoploss function is available
Order size can be sent in the alerts, which allows for multiple setups to be running simultaneously in one account
All alerts are sent using the new "Any alert() function call" feature, which means this indicator will only take up one alert slot to cover all entry and exit alerts
Settings advice:
- If you think price is inflated, try conservative settings that either use a stoploss and EMA filter, or no stoploss but have some of your orders placed far below the current price with increasing volume. In a bear market this will beat the buy and hold.
- If you think the market is ready for a new bull run, then try experimenting with very aggressive settings to beat the buy and hold. For example: ASAP mode with 3 layers turned on. Orders placed at 0.5%, 3%, and 5%. Volumes at 30%, 30%, and 40% respectively. No stoploss. These settings were tested on ETH and beat the buy and hold during an extreme bull market period.

Smoothed Waddah ATR~~~All Credit to LAZY BEAR for posting the original Script which is an old MT4 indicator.~~~~
No this system does not repaint... if it does let me know. Either the code is wrong or you are using a repainting chart such as renko candles.
*PURPOSE*
This Is an "Enhanced or Smoothed" version of the script that captures the heiken-ashi closing price as its main calculation variable. While using normal bar or line charts. Enhancements integrate trade filters to reduce false signals.
*WHAT TYPE OF TRADING STRATEGY IS THIS?*
This is a Long Only, Trend Trading System. Is intended to be applied to Charts/Timeframes that produce sustainable trends for which ever asset you are trading.
*NOTE OF ADVICE REGARDING SETTINGS*
Settings can be tweaked but I have found that best results come with the given settings. If a chart is too choppy to trade this indicator successfully, it is advised not to change the settings but either find a different timeframe or different asset to apply this strategy to.
TLDR
Indicator measures the change of the MacD (difference between MAC D of given EMA's) and compares it to the difference between the Upper and Lower Bollinger bands. Green bar over trigger line= entry. Red bar over trigger line = close.
*SETTINGS AND INPUTS*
-MacD of HeikenAshi chart (will always be of the Heikenashi chart even when applied to different chart type)
sensitivity = input(150, title='Sensitivity') =range should be (125-175)multiplier so that MacD can be compared to BB
fastLength = input(20, title='MacD FastEMA Length')
slowLength = input(40, title='MacD SlowEMA Length')
-Bollinger Band of currently used price chart type
channelLength = input(20, title='BB Channel Length')
mult = input(1.5, title='BB Stdev Multiplier')
-14 Period RSI Trade Filter (set to 0 to Disable)
RSI14filter = input(40, title='RSI Value trade filter') =only gives entry when RSI is higher than given value
*ABSTRACT & CONCEPT*
TLDR - Indicator measures the change of the MacD (difference between MAC D of given EMA's) and compares it to the difference between the Upper and Lower Bollinger bands. Green bar over trigger line= entry. Red bar over trigger line = close.
Indicator plots -
Bars are the change in the MAC D and the indicator line is the difference in the BB.
When Bars are higher than the indicator line then it is considered a trend "Explosion"
Green Bars are Trend Explosion to the upside, Red Bars are Trend explosion to the downside.
GENERAL DETAIL-
the core calculation is measuring the change in MacD of current candle compared to the MacD of two previous candles.
This value is multiplied by the sensitivy so it can be compared to the change in Bollinger Band Width.
if the MACD change is positive then you get a green/lime bar for that value. If the MacDchange is negative you get a red/orange bar for that value.
and are determined by whether the actual change is increasing in that direction or decreasing. (bars getting taller or bars getting shorter)
Entry signal for long is A positive change in MACD difference (Green bar) that is greater than the change of the bollinger band (orange signal line) AND if the RSI value is above your filter.
Close signal or Trend Stop Warning Signal is given when a Negative MacD Difference (red bar) is greater than the change of the bollinger band (orange Line)
*CONSIDERATIONS AND THOUGHTS*
I have over 150 iterations of this indicator and this is the most consistent and best version of settings and filters I was able to generate. I built this indicator specifically for 3 charts. SPY monthly, QQQ monthly, BTC 3 Day. However this indicator works well on any long term bullish chart. (tech stocks are great) .
Trend trading systems are intended to be homerun hitting, plunge protecting indicators that allow for long legs and expanding volatility. This indicator does this as the trigger line is Dynamic with the expansion and contraction of the bollinger band.
I do not take every signal specifically not the close signals. Instead they more like warnings in ultra bullish environments.
If i had to pair this indicator with any other filter than the RSI, it would be a long term moving average i.e. the 50 week or equivalent for your chart. signals above rising moving averages means that you are trading with an upward trending market.
Hope this helps. Happy trades.
-SnarkyPuppy

Orion Algo Strategy v2.0Hi everyone.
I decided to make the latest Orion Algo open to people. I don't have enough time to work on it lately, so I figured it would be best that everyone can have it to work on it. I took out some stuff from the original but it should give an idea on how things work. I made two strategies with this so far so you can use that to come up with your own. I recommend the DCA strategy because it gives you the most bang for Orion Algo's buck. It's pretty good at finding long entries.
Overall I hope you guys like this one. Also, Banano is the best crypto currency :)
-INFO-
Orion Algo is a trading algorithm designed to help traders find the highs and lows of the market before, during, and after they happen. We wanted to give an indicator to people that was simple to use. In fact we created the algorithm in such a way that it currently only needs a single input from the user. Since no indicator can predict the market perfectly, Orion should be used as just another tool (although quite a sharp one) for you to trade with. Fundamental knowledge of price action and TA should be used with Orion Algo.
Being an oscillator, Orion currently has a bias towards market volatility . So you will want to be trading markets over 30% volatility . We have plans to develop future versions that take this into account and adjust automatically for dead conditions. Also, while there are some similarities across all oscillators, what sets ours apart is the prediction curve. The prediction curve looks at the current signal values and gives it a relative score to approximate tops and bottoms 1-2 bars ahead of the signal curve. We also designed a velocity curve that attempts to predict the signal curve 2+ bars ahead. You can find the relative change in velocity in the Info panel. The bottom momentum wave is based on the signal curve and helps find overall market direction of higher time-frames while in a lower one.
Settings and How to Use them:
User Agreement – Orion Algo is a tool for you to use while trading. We aren’t responsible for losses OR the gains you make with it. By clicking the checkbox on the left you are agreeing to the terms.
Super Smooth – Smooths the main signal line based on the value inside the box. Lower values shift the pivot points to the left but also make things more noisy. Higher values move things to the right making it lag a bit more while creating a smoother signal. 8 is a good value to start with.
Theme – Changes the color scheme of Orion.
Dashboard – Turns on a dashboard with useful stats, such as Delta v, Volatility , Rsi , etc. Changing the value box will move the dashboard left and right.
Prediction – A secondary prediction model that attempts to predict a reversal before it happens (0-2bars). This can be noisy some times so make your best judgement. Curve will toggle a curve view of the prediction. Pivots will toggle bull/bear dots.
∆v – Delta v (change in velocity). This shows momentum of the signal. Crossing 0 signals a reversal. If you see the delta v changing direction, it may signify a reversal in the several bars depending on the overall momentum of the market.
Momentum Wave – Uses the signal as a macro trend indicator. Changes in direction of the wave can signify macro changes in the market. Average will toggle an averaging algorithm of the momentum waves and makes it easy to understand.
-STRATEGIES-
Simple - Just buy and sell on the dots
DCA - Uses the settings in the script for entries. If a buy dot appears then it will buy, if the price goes below the percentage it will wait for another dot before entering. This drastically improves DCA potential.

Volume Difference Delta Cycle OscillatorVolume Difference Delta Cycle Oscillator indicator:
Using the power of my Volume Difference Indicator and standard deviations based on Bollinger Bands and more, we present this wonderful indicator with the following features:
Price Action Histogram: This is the bread and butter of this graph, if the PAH is above 0, this is considered a BULL cycle, and if below 0, this is considered a BEAR cycle. The histogram will move up and down based on the Histagram settings you set in the properties field. Be careful, we advise using default settings.
Custom Overbought & Oversold Lines:mean
These lines can be used to identify when to buy and sell the security, and help you make sense of the action of the histogram. Change the color, size, and linewidth!
These lines are what are used to perform the trades with the strategy as well, so if you change them, they will make an impact on the strategy itself.
EzSpot Background:
Do you want to turn your brain off and just trade when you you're inside an Overbought or Oversold line? Awesome! Turn on EzSpot backgrounds, and when it's green, go long, when it's red go short! Simple as that!
How it works:
By taking the Delta of the Volume Difference Indicator we're able to find the rate of change of the amount of change of volume, allowing us to see changes in volume before price changes. To add onto these, we supercharge it by taking the output of this line as the input source of bollinger bands which we use to output the %B of the Delta of the Volume Difference Indicator.
Separately, we calculate the %B of the current close to use later.
The final step is taking the second %B (which is an indication of where price lies on the curve of historical price data), and from it subtract the first %B, which allows us to visualize the standard deviation of the closing price, minus the standard deviation of Delta of the Volume Difference , which in essence allows us to see when volume changes but price does not and vice versa.
This final output is then plotted along with an over bought and over sold line, which we use to perform our trades on.
Simplified: This indicator shows the cycles of price action - volume based on the rate of the rate of volume changes based on price and the closing price.
Super Simple: Notice when volume increases but price hasn't, and vice versa with this indicator.

OnePunch Algo KITEIntroducing One of OnePunch ALGO Flagship plugin. In this plugin it comes with a in-built risk management system plus it allows users stop loss input per trade. This can be used with Cryptocurrency and Stocks equally.
#################################
########## User Guide ###########
################################
OnePunch ALGO KITE should be used with 30min or upper time limits, this is built for long term trading strategies. Make sure once you pick a crypto or stock to trade, check its backtest data: which can be found at Strategy Tester. A good strategy should always out perform the Buy & Hold for a given timeframe.
Best Bar Time: 45m
Other Options
___________________________________________________________
Short Term/Day Trading Setup
For Short Term or Day Trade: 5min, 15min & 30min candlesticks
Mid Term Trading Setup
For Mid-term traders: 45m, 1hr, 2hr, and 3hr setup works really well.
For Long Term Trading Setup
For long term traders: 4hr, 1D, 1Week and 1Month Setup works well.
* Best timeframe should beat buy and hold for a given timeline.
#################################
####### How Strategy Work ########
################################
Strategy use multiple signals and technical data. Including and not limited to Simple Moving Averages, Volume , & Trends. In this chart, we picked Polkadot (DOTUSD) crypto coin as an example with an initial capital of $1k. We have also added a slippage of 1 just to be on the safe side and a commission rate of 0.01% (Commission rates depends of your broker).
#################################
######## Built with Inputs #########
################################
Date Pick: User can backtest the plugin with exact date you want from to till. For an example, you can check date from 01 / 01 /2020 (Default setting date) till day, and compare apple to apple results with other stocks. This is mostly used to check if another stock/crypto do better than the other compared to a given timeframe.
Risk Management per Trade: This also allows users to put their own risk management loss percentage. In default it is set to 100%. This allows user to see in the long run, if this provide better results with or without a stop loss.
Commission Rates: User can update commission rates according to their broker's fees
Slippage: To be more conservative about the entry and exit of a trade, user can input any slippage amount
#################################
#### How to Detect BUY Signals #####
################################
When a teal color BUY signal is given, it is a BUY. This signal basically happen when a stock land in a high volatility zone. We use in-build systems such as MA , Support and Resistance and Trends to come up with the Buy Signal. Algorithm make a market order when the criteria's are met and algorithm exit if this turns out to be a bluff bullish signal.
#################################
#### How to Detect SELL Signals #####
################################
When a maroon color SELL signal is given, it is a SELL happen when a momentum changed in a bearish downtrend. Sell happen when a momentum changed in a bearish downtrend. We use moving averages and trend analysis to identify downtrends. Algorithm make a market order when the criteria's are met. There is a in-built risk management that make an exit order when a bullish alert turns out to be a bluff.
#################################
#### Bullish and Bearish Signals #####
################################
When a silver color Bearish signal is given, it is a BEARISH trend alert. It's up to the user to decide what to do when this alert is given. (Note: Backtest data only shows Buy and Sell Signal market orders results, it does not account bearish alerts), a Bearish signal given when the stock/crypto is overbought in multiple technical indicators.
When a sea blue Bullish trend signaled. (Mind this sea blue color signal will not be calculated in the backtest, it is up to the users to decide what to do with this bullish signal) - This signal happen when a stock is oversold in multiple technical indicators.
DISCLAIMER: Stocks and options trading involves substantial RISK of LOSS and is NOT suitable for every investor. The valuation of stocks and options may fluctuate, and, as a result, clients may lose more than their original investment. If the market moves against you, you may sustain a total loss greater than the amount you deposited into your account. You are responsible for all the risks and financial resources you use and for the chosen trading system. You should not engage in trading unless you fully understand the nature of the transactions you are entering into and the extent of your exposure to loss. If you do not fully understand these risks, you must seek independent advice from your financial advisor.
All trading strategies are used at your own risk. And OnePunch ALGO Developer does NOT take any responsibility for your losses using any of the advice or suggestions or strategies are shown/said in any of OnePunch ALGO publications.

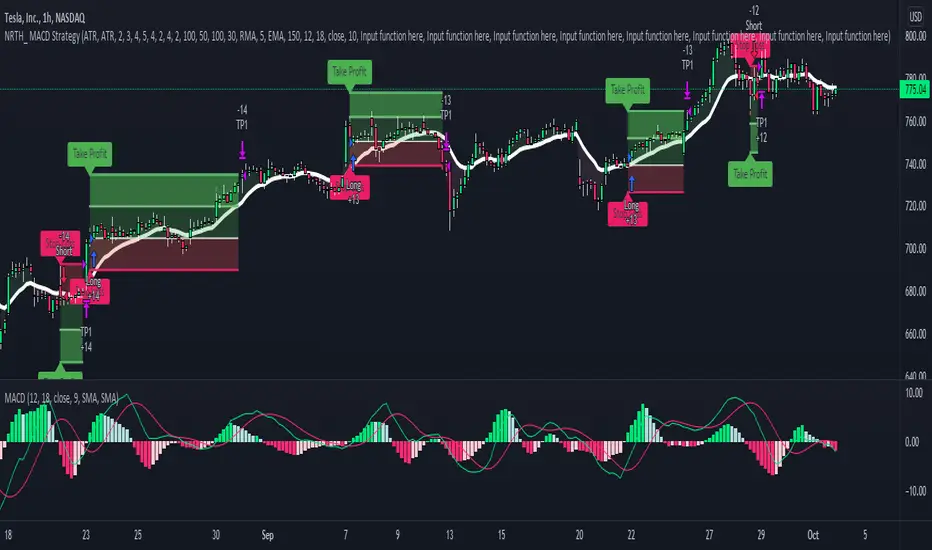
MACD StrategyNRTH_ MACD strategy, packed with alerts, visual backtesting, and ready for automation.
Comes included with the Premium Package.
Indicator features
Built-In Alerts
Visual Risk Management
Customizable Entry Rules
Usage Tips
Works on any timeframe, tweak period lengths accordingly.
Recommended for use on higher timeframes, with the MA Filter
Simple, and customizable MACD strategy, trade with a defined exit strategy and entry parameters.
Works for all markets with the ability to customize to your liking.
Backtesting Results Info
Period 1/1/2021-1/10/2021
Entry value at $1000 with 10x leverage
ATR Exits : 1:2 RR
-------------------------------------------
Disclaimer
Copyright NRTH_ Indicators 2021.
NRTH_ and all affiliated parties are not registered as financial advisors. The products & services NRTH_ offers are for educational purposes only and should not be construed as financial advice. You must be aware of the risks and be willing to bear any level of risk to invest in financial markets. Past performance is not necessarily indicative of future results. NRTH_ and all individuals associated assume no responsibility for your trading results or investments.
All investments involve risk, and the past performance of a security, industry, sector, market, financial product, trading strategy, or individual’s trading does not guarantee future results or returns. Investors are fully responsible for any investment decisions they make. Such decisions should be based solely on an evaluation of their financial circumstances, investment objectives, risk tolerance, and liquidity needs.
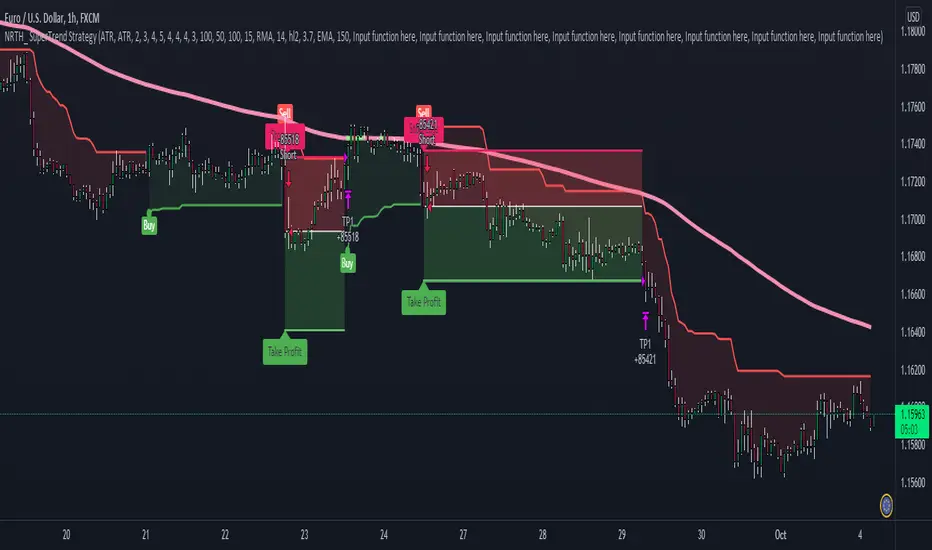
SuperTrend StrategyNRTH_ SuperTrend strategy, packed with alerts, visual backtesting, and ready for automation.
Comes included with the Premium Package.
Indicator features
Built-In Alerts
Visual Risk Management
Customizable Entry Rules
Usage Tips
Works on 15m+ timeframes, tweak sensitivity accordingly
We recommend using higher timeframes with very strict entries
Well known SuperTrend strategy, packed into a NRTH_ strategy package, with visual backtesting, custom risk management, and alerts ready for automation
Works for all markets with the ability to customize to your liking.
Backtesting Results Info
Period 1/1/2021-1/10/2021
Entry value at $1000 with 100x leverage
ATR Exits : 1:1.35 RR
-------------------------------------------
Disclaimer
Copyright NRTH_ Indicators 2021.
NRTH_ and all affiliated parties are not registered as financial advisors. The products & services NRTH_ offers are for educational purposes only and should not be construed as financial advice. You must be aware of the risks and be willing to bear any level of risk to invest in financial markets. Past performance is not necessarily indicative of future results. NRTH_ and all individuals associated assume no responsibility for your trading results or investments.
All investments involve risk, and the past performance of a security, industry, sector, market, financial product, trading strategy, or individual’s trading does not guarantee future results or returns. Investors are fully responsible for any investment decisions they make. Such decisions should be based solely on an evaluation of their financial circumstances, investment objectives, risk tolerance, and liquidity needs.
Smart Entry BETAA Custom Unique indicator by NRTH_
Comes included with the Premium Package.
Indicator features
Built-In Alerts
Visual Risk Management
Customizable Entry Rules
Usage Tips
Smart Entry is currently a BETA algo. we are still in the process of tweaking and programming it only give entry signals when they are confirmed, and work of very strict parameters to allow for trading all the way down to the 5m timeframe. It is currently at a stage where it can produce profitable trades or even just act as a confirmation signal in use with another strategy, but this project will be ongoing until we can obtain high profitability levels on very low timeframes.
The algo uses both momentum and trend calculation to find an entry, highly recommended use with the built-in MA Filter for best results.
Works for all markets with the ability to customize to your liking.
Backtesting Results Info
Period 1/1/2021-1/10/2021
Entry value at $1000 with 10x leverage
Binance standard taker fee rate (0.04%)
ATR Exits : 1:2.9 RR
-------------------------------------------
Disclaimer
Copyright NRTH_ Indicators 2021.
NRTH_ and all affiliated parties are not registered as financial advisors. The products & services NRTH_ offers are for educational purposes only and should not be construed as financial advice. You must be aware of the risks and be willing to bear any level of risk to invest in financial markets. Past performance is not necessarily indicative of future results. NRTH_ and all individuals associated assume no responsibility for your trading results or investments.
All investments involve risk, and the past performance of a security, industry, sector, market, financial product, trading strategy, or individual’s trading does not guarantee future results or returns. Investors are fully responsible for any investment decisions they make. Such decisions should be based solely on an evaluation of their financial circumstances, investment objectives, risk tolerance, and liquidity needs.

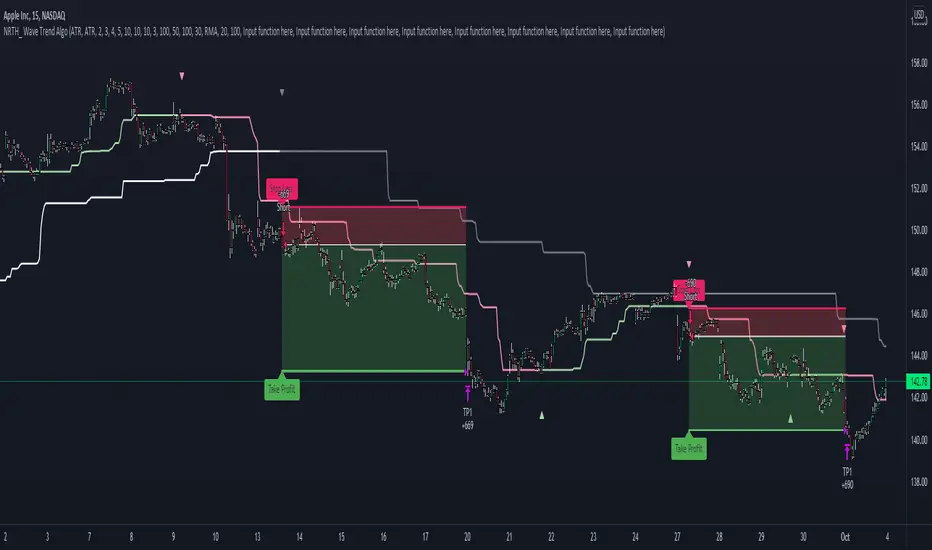
Wave Trend AlgoA NRTH_ Premium Double Trend Confirmation Algo
Comes included with the Premium Package.
Indicator features
Built-In Alerts
Visual Risk Management
Customizable Entry Rules
Usage Tips
This strategy works on timeframes as low as 15m, however not recommended for scalping with high fees.
Best performance with high Risk/Reward Ratios
The double trend confirmation (1 slow, 1 fast) uses lagging trend confirmation to your advantage, Identify confirmed moves and enter trades with high RR for the best results.
Works for all markets with the ability to customize to your liking.
Backtesting Results Info
Period 1/1/2021-1/10/2021
Entry value at $1000 with 100x leverage
ATR Exits : 1:3.3 RR
-------------------------------------------
Disclaimer
Copyright NRTH_ Indicators 2021.
NRTH_ and all affiliated parties are not registered as financial advisors. The products & services NRTH_ offers are for educational purposes only and should not be construed as financial advice. You must be aware of the risks and be willing to bear any level of risk to invest in financial markets. Past performance is not necessarily indicative of future results. NRTH_ and all individuals associated assume no responsibility for your trading results or investments.
All investments involve risk, and the past performance of a security, industry, sector, market, financial product, trading strategy, or individual’s trading does not guarantee future results or returns. Investors are fully responsible for any investment decisions they make. Such decisions should be based solely on an evaluation of their financial circumstances, investment objectives, risk tolerance, and liquidity needs.
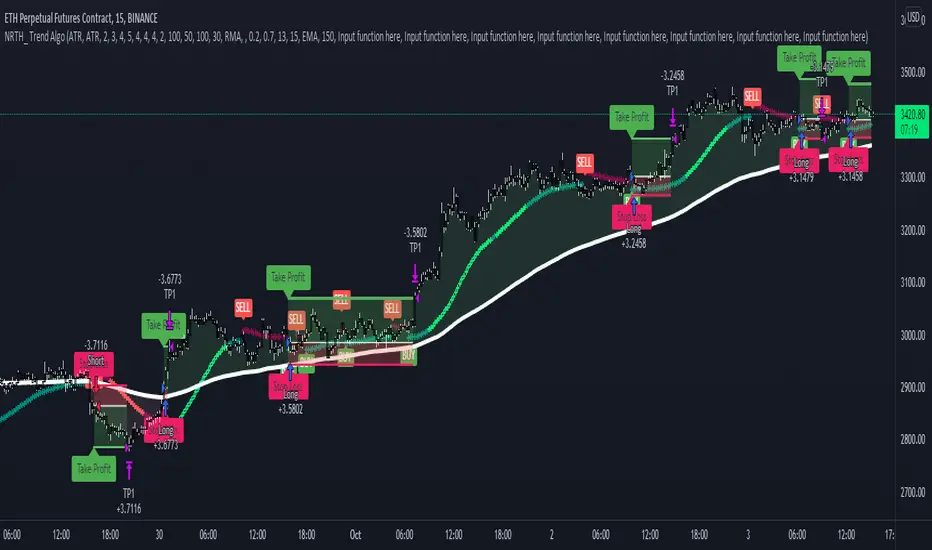
Trend AlgoA NRTH_ Premium Momentum Based Strategy
Comes included with the Premium Package.
Indicator features
Built-In Alerts
Visual Risk Management
Customizable Entry Rules
Usage Tips
This strategy works on timeframes as low as 5m, great for scalping or day trading.
The algo identifies price momentum with strict entry signal settings (can be made more or less sensitive).
Works for all markets with the ability to customize to your liking.
Backtesting Results Info
Period 1/1/2021-1/10/2021
Entry value at $1000 with 10x leverage
Binance standard taker fee rate (0.04%)
ATR Exits : 1:2 RR
-------------------------------------------
Disclaimer
Copyright NRTH_ Indicators 2021.
NRTH_ and all affiliated parties are not registered as financial advisors. The products & services NRTH_ offers are for educational purposes only and should not be construed as financial advice. You must be aware of the risks and be willing to bear any level of risk to invest in financial markets. Past performance is not necessarily indicative of future results. NRTH_ and all individuals associated assume no responsibility for your trading results or investments.
All investments involve risk, and the past performance of a security, industry, sector, market, financial product, trading strategy, or individual’s trading does not guarantee future results or returns. Investors are fully responsible for any investment decisions they make. Such decisions should be based solely on an evaluation of their financial circumstances, investment objectives, risk tolerance, and liquidity needs.
Pullback AlgoFlagship NRTH_ Premium Strategy
Comes included with the Essentials or Premium Package.
Indicator features
Built-In Alerts
Visual Risk Management
Customizable Entry Rules
Usage Tips
This strategy is designed for Swing Trading and Intra-Day timeframes (1hr+)
The algo targets pullbacks in an up or down-trending scenario allowing for multiple entries in a strong trending market.
Works for all markets with the ability to customize to your liking.
Backtesting Results Info
Period 1/1/2021-1/10/2021
Entry value at $1000 with 10x leverage
Binance standard taker fee rate (0.04%)
ATR Exits : 1:2 RR
-------------------------------------------
Disclaimer
Copyright NRTH_ Indicators 2021.
NRTH_ and all affiliated parties are not registered as financial advisors. The products & services NRTH_ offers are for educational purposes only and should not be construed as financial advice. You must be aware of the risks and be willing to bear any level of risk to invest in financial markets. Past performance is not necessarily indicative of future results. NRTH_ and all individuals associated assume no responsibility for your trading results or investments.
All investments involve risk, and the past performance of a security, industry, sector, market, financial product, trading strategy, or individual’s trading does not guarantee future results or returns. Investors are fully responsible for any investment decisions they make. Such decisions should be based solely on an evaluation of their financial circumstances, investment objectives, risk tolerance, and liquidity needs.

Algo Trading Strategy (Nifty & BankNifty)What is Algo Trading Strategy ( Nifty & Bank Nifty )?
There are many 9 to 5 working professionals who have some spare money to invest each month but they can not do active trading because they are busy with their full time job.
So they wish to have an automated system which could take and close trades for them with a proven back-tested strategy, proper money management, ability to trade within particular timings, pre-defined maximum loss they can bear and so on.
To cater needs of such type of traders, we created from scratch; and published an 'AutoTrading Algo (Nifty & Bank Nifty) in Sep 2021. (The link is given below, please read on).
Many people who want to try this AutoTrading Algo want us to share stats of this algo with them.
In order to fulfil this demand, we have converted that "Algo Trading" Study into a Strategy whose description you are reading right now.
For all other queries related to how our "Algo Trading (Nifty & Bank Nifty)" works, what are its limitations, benefits and other features, please read the description of our main 'Algo Trading (Bank Nifty & Nifty )' study which is available at following link:
Note:
1. in order to test this strategy on longer time period, you must have a Premium TradingView account.
2. If you have premium TradingView account, the stats you generate will exactly match with our stats which we keep sharing in our channel.
3. To Enable Auto-Trading, You will need to connect this Algo with your broker's trading platform through 3rd party platforms. We will guide you on how to do this, when you contact us.

Bagheri IG Ether v2In this version, the winning ratio has been decreased, but the Risk to Reward Ratio (RRR) has been set to be better than the previous version.
This is a technical trading strategy for Ethereum ( BINANCE:ETHUSDT ). We built and developed it on MetaEditor and optimized it with MetaTrader optimizer.
The main indicators are Donchian Channel, Oscillator of ROC , Bears Power, Balance of Power , and Simple Moving Average ( SMA ). Default values in the input panel are the best combination of these indicators, but you can change any of them and try it for better results.
Please notice that this strategy has been optimized on the 1-minute chart of Ethereum .
For each position, you can see the Take Profit (TP) and Stop Loss (SL) levels. Also, you can find the values of mentioned TP and SL in points from the input panel of the script.
Attention: The price of Ethereum has 2 decimal places.
Therefore, 3000 points for TP means 30 USDT for trading 1 BINANCE:ETHUSDT .
